Dataset Development of Changes in Afforested Area of Key
Forestry Ecological Projects in China (2002–2020)
LU Dan ZHANG Chunhua* CAO Yue MA Jie WANG Ran
School of Resources and
Environmental Engineering, Ludong University, Yantai 264025, China
Abstract: Benefiting from large-scale ecological projects implemented over the past
decades, the Grain for Green Project and afforestation initiatives, forest
coverage in China has substantially increased. Investigating changes in
afforestation area under key forestry ecological projects is therefore of great
significance for enhancing forest carbon sequestration and achieving carbon
neutrality nationwide. Based on data from the China Forestry Statistical
Yearbook and the China Forestry and Grassland Statistical Yearbook, we combined
statistical and spatial analyses to examine the spatiotemporal dynamics of
afforestation area under key forestry ecological projects in China between 2002
to 2020 at national, regional, and provincial scales. The results show that the
afforestation area under China’s key forestry ecological projects decreased
from 6.78×10⁶ ha in 2002 to 2.42×10⁶ ha in 2020, with a
cumulative total of 64.98×10⁶ ha over 19 years. The Grain for Green
Project contributed the largest share (27.62×10⁶ ha), followed by
the Three-North Shelter Forest Project and Yangtze River Shelter Forest
Project, and the Natural Forest Protection Project. At the regional scale,
North China accounted for the largest cumulative afforestation area, followed
by Northwest and Southwest China. At the provincial scale, Inner Mongolia and
Shaanxi ranked first and second in cumulative afforestation area, respectively. The dataset includes the following data from China from
2002 to 2020: (1) annual total afforestation area and proportion of key
forestry ecological projects in 31 provinces; (2) annual afforested area from
different key forestry ecological projects; (3) the cumulative afforested area
from different key forestry ecological projects in each province; (4) annual
afforested area of key forestry ecological projects in 6 regions; The dataset
is archived in .xlsx data format, and consists of 1 file with data size of 240
KB. This dataset supported the
completion of the first author’s Master degree of Science thesis.
Keywords: afforestation area; key forestry
ecological projects; China Forestry Statistical Yearbook; spatial and temporal
dynamics; China; Master degree of Science thesis
DOI: https://doi.org/10.3974/geodp.2026.04.04
Dataset Availability Statement:
The dataset supporting this paper was published and
is accessible through the Digital Journal
of Global Change Data Repository
at: https://doi.org/10.3974/geodb.2026.02.02.V1
1 Introduction
Forests constitute the
dominant component of terrestrial ecosystems, accounting for more than 80% of
Earth’s carbon sink[1,2]. Within nature-based solutions,
afforestation is widely regarded as one of the most cost-effective approaches
for absorbing anthropogenic CO2 emissions, mitigating the global
greenhouse effect, and enhancing forest carbon sequestration[3–5].
Since 2000, terrestrial ecosystems worldwide have exhibited a persistent
“greening” trend, to which China’s large-scale afforestation and ecological
restoration projects have been identified as major contributors[6,7].
As the world’s largest afforestation country, China has implemented a series of
major forestry ecological projects over recent decades, including the
Three-North and Yangtze River Shelter Forest Project, the Grain for Green
Project, and the Natural Forest Protection Project, resulting in substantial
increases in both forest area and carbon sink capacity[8–10].
National forest inventory data indicate that China’s forest coverage increased
from 18.2% in 1999–2003 to 23.0% in 2014–2018, with afforestation contributing
more than two-thirds of the total gain[11]. However, compared with
earlier periods, the rate of forest expansion has slowed in recent years. In pursuit of its 2060 carbon neutrality target, China
continues to intensify afforestation efforts and has set goals to increase
forest coverage to 26% by 2035 and 30% by 2050. A systematic understanding of
the spatiotemporal dynamics of afforestation area is therefore essential not only
for evaluating the effectiveness of major ecological projects, but also for
optimizing land greening strategies, enhancing forest carbon sequestration, and
supporting the national “dual carbon” strategy[12].
In recent years, scholars have conducted extensive
research on national key forestry ecological projects, achieving substantial
progress in areas such as vegetation restoration[13,14], forest
carbon sequestration[15,16], and ecosystem services[17,18].
Existing studies suggest that the carbon sequestration capacity of forest
ecosystems, as well as their potential to mitigate climate change, largely
depends on afforestation area and its spatial distribution. At present, data on
afforestation area and spatial distribution in China are derived mainly from 2
sources: nationwide baseline surveys and satellite-based information
extraction. Baseline datasets, including land surveys, forest resource
inventories and annual statistics released by the National Forestry and
Grassland Administration, provide relatively systematic information on
provincial afforestation area and classify it by afforestation purpose,
planting mode and major ecological project type. These data provide an
essential basis for greening policy formulation, forest ecosystem service
assessment, and carbon sink accounting. Owing to its broad spatial coverage,
strong temporal continuity and relatively limited dependence on ground
conditions, remote sensing has become an important means of acquiring large-scale
forest area information. In afforestation research, its
applications have mainly focused on the identification and mapping of potential
afforestation space. For example, Xu, et al.[19] estimated the
area and 30-m spatial distribution of potential afforestation land in China for
the year 2020 based on land-cover data and Liebig’s law of the minimum. Yao, et
al.[5] combined remote-sensing big data with tree-growth
suitability models to map the spatial pattern of tree-planting potential in
China at a spatial resolution of 1 km. Although these studies have improved
understanding of afforestation area and spatial distribution in China,
estimates from different sources still vary considerably because of differences
in afforestation definitions, threshold criteria, classification systems and
data sources[5,20].
Overall, existing studies have provided an
important foundation for understanding afforestation patterns and their
ecological effects in China. However, limitations remain in characterizing the
long-term spatiotemporal dynamics of actual afforestation area. Previous
studies have focused primarily on identifying potential afforestation space,
assessing vegetation restoration outcomes, and evaluating carbon sequestration
effects, whereas systematic analysis of the long-term dynamics
of actual afforestation area is still relatively limited. Although
satellite-based estimates offer strong spatial continuity, they still differ
from statistical survey data in terms of afforestation definitions,
identification accuracy and correspondence with categories of key forestry
ecological projects, making it difficult to accurately capture the actual scale
and spatiotemporal evolution of afforestation implemented under different
projects. Existing studies of afforestation area have largely concentrated on
local regions, individual projects or single years, and comprehensive
comparative analyses based on a unified statistical framework that
simultaneously cover the national, regional and provincial levels remain
scarce. To address these gaps, this study draws on afforestation area data for
key forestry ecological projects in China from 2002 to 2020 provided by the
National Forestry and Grassland Administration. By integrating statistical
methods with spatial analysis, it systematically examines the spatiotemporal
dynamics of afforestation area under different projects across multiple scales
and further reveals patterns of centroid shift and regional differentiation.
The results help to fill existing gaps in long-term analysis of actual
afforestation area and in the fine-grained characterization of major projects,
provide scientific data for optimizing afforestation planning, evaluating
project effectiveness and developing strategies to enhance forest carbon
sequestration in China.
2 Metadata of the Dataset
The metadata of the Dataset on changes in
afforested area of key forestry ecological projects in China (2002–2020)[21],
including the dataset name, authors, geographic region, year of the dataset,
data format, data size, data files, data publisher, are summarized in Table 1.
3 Methods
3.1 Study Area
This study focuses on the areas in China
covered by widely implemented key forestry ecological projects, encompassing 31
provincial-level administrative regions: Beijing, Tianjin, Hebei, Shanxi, Inner
Mongolia, Liaoning, Jilin, Heilongjiang, Shanghai, Jiangsu, Zhejiang, Anhui,
Fujian, Jiangxi, Shandong, Henan, Hubei, Hunan, Guangdong, Guangxi, Hainan,
Chongqing, Sichuan, Guizhou, Yunnan, Xizang, Shaanxi, Gansu, Qinghai, Ningxia,
and Xinjiang. Results from the 2023 National Land Change Survey show that China
currently has 2.84×10⁸ ha of forest land and 2.47×10⁸ ha
of forest area, with a forest coverage exceeding 25%. The area of existing
planted forests has reached 92.41×10⁶ ha, ranking first in the
world. China is recognized as the country with the fastest and largest growth
in forest resources worldwide[23].
3.2 Data Sources
The data used in this study were obtained from the China Forestry
Statistical Yearbook (2002–2017)[24,25] and the China Forestry and
Grassland Statistical Yearbook (2018–2020)[26]. The dataset includes
annual afforestation area associated with key forestry ecological projects
across different regions of China, including the Natural Forest Protection
Project, the Grain for Green Project, the Three-North and Yangtze River Shelter
Forest Project, the Beijing and Tianjin Sand Source Control Project, the
Fast-growing and High-yield Timber Forest Base Construction Project, the Rocky
Desertification Control Project, and the National Reserve Forest Construction
Project. The dataset covers all provinces in China’s mainland. For national
statistics reported in this study, Hong Kong, Macao and Taiwan Province are temporarily
excluded. Afforestation area under the Fast-Growing and
Table 1 Metadata
summary of the Dataset on changes in afforested area of key forestry ecological
projects in China (2002–2020)
|
Items
|
Description
|
|
Dataset full name
|
Dataset on changes in afforested area of key forestry
ecological projects in China (2002–2020)
|
|
Dataset short name
|
ChinaAfforestedArea2002-2020
|
|
Authors
|
Lu,
D., School of Resources and Environmental Engineering, Ludong University,
ludan_717@163.com
Zhang,
C. H., School of Resources and Environmental Engineering, Ludong University,
zchqs@126.com
Cao,
Y., School of Resources and Environmental Engineering, Ludong University,
plcaoyue@163.com
Ma,
J., School of Resources and Environmental Engineering, Ludong University, 19861556716@163.com
Wang,
R., School of Resources and Environmental Engineering, Ludong University,
wangran202409@126.com
|
|
Geographical region
|
China’s mainland (data for Hong Kong, Macau, and Taiwan
not available)
|
|
Year
|
2002–2020
|
|
Data format
|
.xlsx
|
|
Data size
|
240 KB
|
|
Data files
|
(1) Annual
total afforestation area and proportion of key forestry ecological projects
in 31 provinces; (2) annual afforested area from different key forestry
ecological projects; (3) the cumulative afforested area from different key
forestry ecological projects in each province; (4) annual afforested area of
key forestry ecological projects in 6 regions
|
|
Foundation
|
National
Natural Science Foundation of China (42471132)
|
|
Data publisher
|
Global
Change Research Data Publishing & Repository, http://www.geodoi.ac.cn
|
|
Address
|
No.
11A, Datun Road, Chaoyang District, Beijing 100101, China
|
|
Data sharing policy
|
(1) Data
are openly available and can be free downloaded via the Internet; (2) End
users are encouraged to use Data subject to citation; (3) Users, who
are by definition also value-added service providers, are welcome to
redistribute Data subject to written permission from the GCdataPR
Editorial Office and the issuance of a Data redistribution license;
and (4) If Data are used to compile new datasets, the “ten percent
principle” should be followed such that Data records utilized should
not surpass 10% of the new dataset contents, while sources should be clearly
noted in suitable places in the new dataset[22]
|
|
Communication and
searchable system
|
DOI,
CSTR, Crossref, DCI, CSCD, CNKI, SciEngine, WDS, GEOSS, PubScholar, CKRSC, OARL
|
High-yield Timber Forest Base
Construction Project is reported only for 2002–2011, afforestation area
under the Rocky Desertification Control Project only for 2017–2020, and
afforestation area under the National Reserve Forest Construction Project only
for 2019–2020.
3.3 Data Preprocessing
Using
data from the China Forestry Statistical Yearbook and the China Forestry and
Grassland Statistical Yearbook, the original afforestation area for the period
of 2002–2020 were compiled and organized. Based on these sources, a dataset was
constructed covering the annual afforestation area of key forestry ecological
projects and their cumulative afforestation area for each province and region
in China from 2002 to 2020.
This study
employs a linear regression method (y=ax+b) to examine the interannual variation
of afforestation area under different key forestry ecological projects in China
from 2002 to 2020. The regression coefficient a is calculated using the
following Equation.
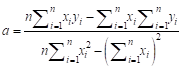 (1)
(1)
where
n represents the number of years and equals 19; xi
denotes the time sequence (1, 2, 3, , 19); and yi represents the afforestation
area of key forestry ecological projects in the i-th year (ha). When a>0, it indicates an increasing
trend in afforestation area, whereas when a<0, it indicates a
decreasing trend.
, 19); and yi represents the afforestation
area of key forestry ecological projects in the i-th year (ha). When a>0, it indicates an increasing
trend in afforestation area, whereas when a<0, it indicates a
decreasing trend.
To explore the spatial variation of
afforestation area under key forestry ecological projects, a spatial database of cumulative
afforestation area for 31 provinces in China over the period 2002–2020 was
established using the ArcGIS 10.8 platform. Spatial visualization was then
conducted for the afforestation area of different key forestry ecological projects
across provinces. The Natural Breaks (Jenks) classification method was applied
to divide the afforestation area into 5 categories. Different color gradients
were used to represent the gradient differences in afforestation scale across
regions. Based on this approach, the spatial variation of cumulative
afforestation areas under key forestry ecological projects in China from 2002
to 2020 were analyzed.
4 Data Results
4.1 Dataset Composition
The dataset includes the following data from
2002 to 2020: (1) annual total afforestation area and proportion of key
forestry ecological projects in 31 provinces; (2) annual afforested area from
different key forestry ecological projects; (3) the cumulative afforested area
from different key forestry ecological projects in each province; (4) annual
afforested area of key forestry ecological projects in 6 regions. The dataset
is archived in .xlsx format.
4.2 Interannual Variation of National Afforestation
Area
From
2002 to 2020, the afforestation area under key forestry ecological projects in
China exhibited an overall declining trend. However, significant differences
existed among project types. In general, except for the Three-North and Yangtze
River Shelter Forest Project and the National Reserve Forest Construction
Project, most projects showed a continuous decrease in afforestation area.
Among them, the Fast-growing and High-yield Timber Forest Base Construction
Project and the Grain for Green Project experienced the most pronounced
declines.
The total afforestation
area in China increased from 6.78×10⁶ ha in 2002 to a peak of
8.26×10⁶ ha in 2003, and then continuously declined to 2.42×10⁶
ha in 2020, representing an overall decrease of approximately 64% (Figure 1a).
The afforestation area under the Natural Forest Protection Project showed
relatively small fluctuations and remained generally stable, reaching a
temporary peak around 2009 (Figure 1b).
The Grain for Green
Project exhibited a typical pattern of “decline-rebound- stabilization” and is
one of the most fluctuating project types. Its afforestation area was 4.42×10⁶
ha in 2002. Although a brief recovery occurred, it never returned to the 2003
level. By 2020, it had fallen to 6.69×10⁵ ha, representing a
reduction of 89% (Figure 1c).
The Three-North and
Yangtze River Shelter Forest Project and the Beijing and Tianjin Sand Source
Control Project showed an overall “decline-increase” trend. The former
experienced a marked decrease from 2002 to 2006, followed by a temporary peak
in 2009. The latter exhibited a fluctuating pattern of decline followed by
increase, with a peak in 2003 (Figure 1d, 1e).
The Fast-growing and
High-yield Timber Forest Base Construction Project and the Rocky
Desertification Control Project showed an “increase-decrease” pattern. Among
them, the former experienced the largest decline, with afforestation area
dropping rapidly from 2002 to 2011, resulting in an overall decline of 98%
(Figure 1f). The Rocky Desertification Control Project reached its peak around
2018 and then decrease slightly (Figure 1g). In contrast, the National Reserve
Forest Construction Project started relatively late but had shown a clear
increasing trend since 2019 (Figure 1h).
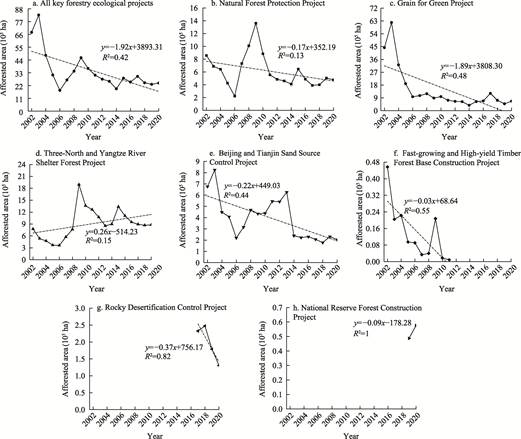
Figure 1 Afforestation area trends of
key forestry ecological projects in China (2002–2020)
4.3 Interannual Variation of Regional-Scale
Afforestation Area
At the regional scale, the afforestation area
under key forestry ecological projects across 6 regions of China[27]
generally showed a declining trend from 2002 to 2020. However, the magnitude
and stage characteristics of changes in afforestation area varied significantly
among regions.
The afforestation area under the Grain for Green
Project declined in most regions, with the most pronounced decreases observed
in North and East China. In North China, the afforestation area decreased from
8.92×10⁵ ha in 2002 to 9.86×10⁴ ha in 2020, representing
a decline of 89%. In Northeast China, the decrease was nearly 100%, with
afforestation activity approaching 0 in later years (Figure 2a, 2b). In
contrast, Southwest China exhibited the greatest fluctuations, reaching high
levels in the early period and then gradually declining. The Natural Forest
Protection Project remained relatively stable overall, with only minor
variations across regions. A noticeable peak occurred in Southwest China around
2009, while other regions generally maintained stable or slowly declining
trends. The Three-North and Yangtze River Shelter Forest Project exhibited
regionally differentiated patterns. North and East China showed a “decline-increase-decline”
pattern, while Northeast, South, Southwest, and Northwest China generally
followed a “increase-decrease” pattern. Notably, Northwest China experienced a
marked increase after 2007 and then stabilized (Figure 2c–2f). The Beijing and
Tianjin Sand Source Control Project was distributed only in North China. Its
afforestation area showed an overall decline, from 6.76×10⁵ ha in
2002 to 1.95×10⁵ ha in 2020. However, fluctuations were relatively
pronounced before 2014, after which the trend became stable. The Fast-growing
and High-yield Timber Forest Base Construction Project accounted for a
relatively small proportion across regions. Except for East and Southwest
China, most regions exhibited a continuous decline. The Rocky Desertification
Control Project was primarily concentrated in South and Southwest China, where
it has remained at relatively high levels in recent years, while other regions
have generally experienced declines.
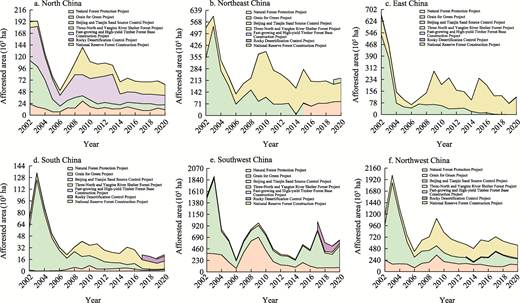
Figure 2 Interannual variation of afforestation area of key
forestry ecological projects in different regions of China (2002–2020)
4.4 Provincial-Scale Afforestation Area Interannual
Variation
At the provincial scale,
changes in afforestation area under different key forestry ecological projects
exhibited obvious spatial heterogeneity (Figure 3). Overall, 3 typical patterns
could be identified: a stable pattern (e.g., Shaanxi, Shanxi), a “U-shaped”
pattern (e.g., Guizhou, Hebei), and an inverted “U-shaped” pattern (e.g.,
Jiangsu, Sichuan). In addition, some provinces showed a continuous declining
trend.
The Grain for Green Project exhibited a
significant decline in most provinces. Only Chongqing showed continuous growth, with afforestation area increasing by
more than twofold. In contrast, some provinces in Northeast and South China
(e.g., Heilongjiang, Henan) experienced decreases close to or reaching 100%,
indicating a marked contraction in the regional implementation of this project.
The Natural Forest Protection Project showed significant growth in a few
provinces, such as Jilin and Qinghai, while traditional key regions (e.g.,
Sichuan, Yunnan, and Inner Mongolia) exhibited declining trends. The
Three-North and Yangtze River Shelter Forest Project increased significantly in
regions such as Inner Mongolia and Guizhou, but significant declines in areas such
as Shanghai and Liaoning, highlighting strong regional disparities. The Rocky
Desertification Control Project was primarily concentrated in a few provinces,
such as Guizhou and Hubei, where it exhibited stage-wise increases in recent
years, while most other regions experienced an overall decline.
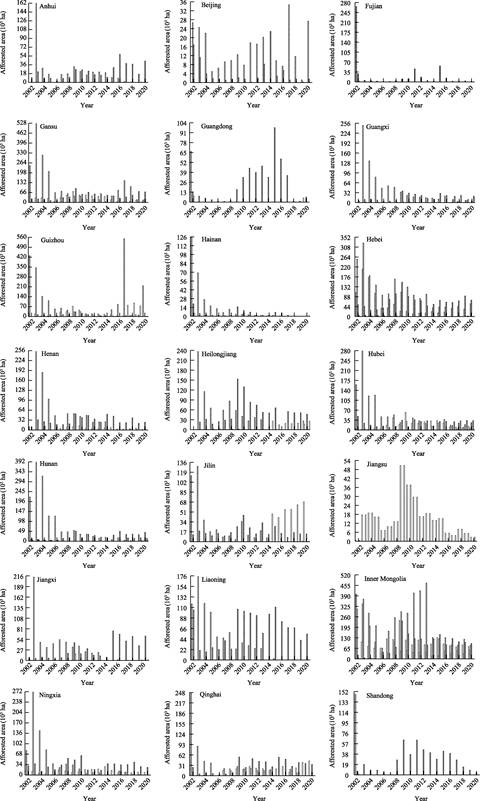
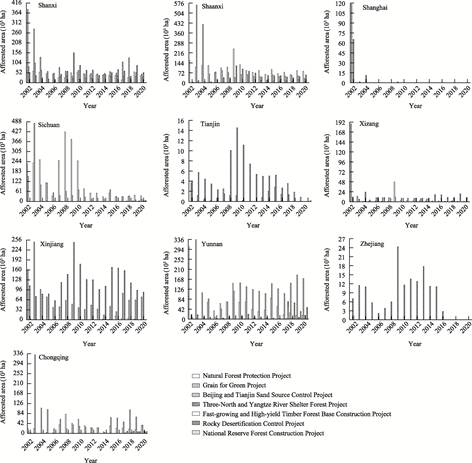
Figure 3 Interannual variation of afforestation area of key
forestry ecological projects in different provinces of China (2002–2020)
4.5 Spatial Distribution of Cumulative
Afforestation Area
Overall,
the total afforestation area under key forestry ecological projects in China
exhibited a spatial pattern of “higher in the west and lower in the east,
higher in the north and lower in the south”. This pattern was mainly due to the
formation of large-scale, rapid afforestation in northeastern and southwestern
provinces, where forest area is significantly larger than in other regions of
China[28].
At the provincial scale, the total
afforestation area exhibited a clear clustering distribution. Inner Mongolia
(96.39×10⁵ ha), Shaanxi (48.16×10⁵ ha), and Yunnan
(41.75×10⁵ ha) ranked among the highest in the country and served as
core regions for afforestation activities. In contrast, eastern coastal region
(e.g., Shanghai, Jiangsu, and Zhejiang) had relatively small afforestation
scales and generally showed declining trends (Figure 4a). In terms of change
direction, afforestation area has generally decreased in northern and some
eastern provinces (e.g., Hebei, Liaoning, and Shandong), while southwestern and
northwestern regions (e.g., Guizhou, Yunnan, and Shaanxi) showed varying
degrees of increase. This indicates a gradual shift in the focus of ecological
engineering toward western region of China.
Different project types
exhibited clear spatial clustering characteristics. The afforestation area of the Natural Forest Protection Project was primarily
concentrated in Sichuan (26.01×10⁵ ha) and Inner Mongolia (20.08×10⁵
ha), indicating its dominant role in key forest regions of southwest and north
China (Figure 4b). The Grain for Green Project was mainly distributed in Yunnan
(26.19×10⁵ ha), Guizhou (22.29×10⁵ ha), and Gansu
(20.69×10⁵ ha), forming a concentration zone centered in the
southwest-northwest region (Figure 4c).
The Three-North and
Yangtze River Shelter Forest Project was highly concentrated in north China,
with Xinjiang (23.62×10⁵ ha), Inner Mongolia (16.78×10⁵
ha), and Hebei (12.91×10⁵ ha) as the main distribution areas (Figure
4d). The Beijing and Tianjin Sand Source Control Project showed even stronger
spatial concentration, with Inner Mongolia and Hebei occupying a dominant
position. Inner Mongolia alone accounted for 42.16×10⁵ ha, exceeding
half of the total afforestation area. (Figure 4e).
The Rocky Desertification Control Project was primarily
distributed in the karst regions of southwest China, with the highest
concentrations in Guizhou (2.51×10⁵ ha) and Yunnan (2.25×10⁵
ha), while other provinces showed relatively low participation (Figure 4f). The
National Reserve Forest Construction Project exhibited an emerging clustering
pattern, mainly distributed in Heilongjiang (5.21×10⁴ ha) and
Guangxi (2.72×10⁴ ha), with significant growth after 2019 (Figure
4g). The Fast-growing and High-yield Timber Forest Base Construction Project
was relatively small in scale, largely concentrated in Hebei and Hunan, and
showed a more dispersed spatial distribution (Figure 4h).
Overall, the spatial
differentiation of various key forestry ecological projects reflected a transition
in China’s ecological governance from east to west and from a balanced
distribution to a concentration in key regions. It also highlighted the
distinct division of roles among projects in terms of ecological function and
regional suitability.
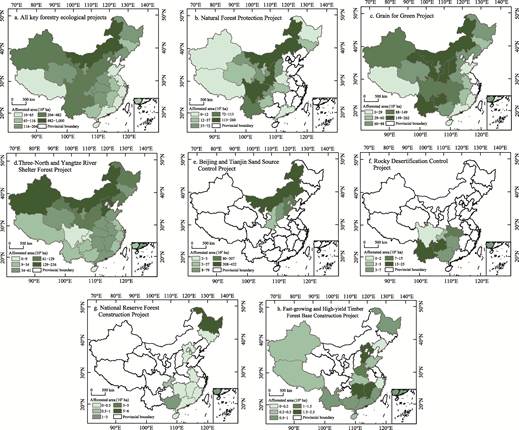
Figure 4 Spatial distribution maps of cumulative
afforestation area under different key forestry ecological projects in China (2002–2020)
5 Discussion and Conclusion
This study was based on
afforestation area data for key forestry ecological projects released by the
State Forestry Administration and the National Forestry and Grassland
Administration from 2002 to 2020. By combining mathematical statistics and
spatial analysis methods, it systematically examined the spatiotemporal
dynamics of afforestation area under different key forestry ecological projects
at national, regional, and provincial scales. From 2002 to 2020, the cumulative
afforestation area under key forestry ecological projects in China reached
64.98×10⁶ ha. Overall, it exhibited a fluctuating
pattern, with rapid growth in the early stage followed by a decline, decreasing
from 6.78×10⁶ ha in 2002 to 2.42×10⁶ ha in 2020, and
showing a slight rebound in recent years. This fluctuation reflects adjustments
in national ecological construction strategies and the stage-specific
characteristics of project implementation. The contributions of different
projects varied over time. After 2009, the Grain for Green Project and the
Three-North and Yangtze River Shelter Forest Project became the dominant
contributors to afforestation. Spatially, the afforestation area exhibited a
“higher in the west, lower in the east” pattern. North China (18.75×10⁶
ha), Northwest China (15.12×10⁶ ha), and Southwest China (13.50×10⁶
ha) served as core regions. At the provincial level, Inner Mongolia (96.39×10⁵
ha), Shaanxi (48.16×10⁵ ha), and Yunnan (41.75×10⁵ ha)
ranked as the top three in total afforestation area.
Based on data from the China
Forestry and Grassland Statistical Yearbooks (2002–2020), this study applied a
multi-scale framework (national-regional-provincial) combined with a
spatiotemporal coupling approach to clearly characterize the dynamics of afforestation
area across key forestry ecological projects. It revealed both the national
spatial pattern of “higher in the west, lower in the east” and the temporal
trend of “fluctuating evolution”, while identifying the dominant regions and
stage-specific differences among projects. This provides a systematic
perspective for understanding the dynamics of project implementation.
However, some
limitations remain. The study focuses primarily on afforestation area and lacks
analysis linking afforestation quality and ecological benefits. It also
provides limited interpretation of driving mechanisms, such as policy
adjustments and natural factors, and does not extend to future trend
projections. Future research could strengthen a three-dimensional coupling
framework integrating “quantity-quality-benefit”, deepen analysis of policy and
natural drivers, and align with emerging strategies such as the dual carbon
goals, thereby enhancing the study’s relevance for optimizing ecological
engineering practices. This dataset supported the completion of
the first author’s Master of Science thesis.
Author Contributions
Lu, D. contributed to the data collection and sorting,
data processing, and linear regression analysis, as well as drafted the paper
manuscript. Zhang, C. H. contributed to the overall design of the dataset and
research plan guidance, and participated in revising and guiding the data
paper. Cao, Y., Ma, J. and Wang, R. assisted in collecting and organizing the
data.
Acknowledgements
I
am deeply grateful to my supervisor, Zhang, C. H., for her invaluable guidance
and support during the writing of this thesis.
Conflicts of
Interest
The authors
declare no conflicts of interest.
References
[1]
Harris,
N. L., Gibbs, D. A., Baccini, A., et al. Global maps of twenty-first
century forest carbon fluxes [J]. Nature Climate Change, 2021, 11(3):
234–240.
[2]
Zhu,
J. J., Gao, T., Yu, L. Z., et al. Forest ecosystem carbon sink: concept,
temporal effect and enhancement approaches [J]. Chinese Journal of Applied
Ecology, 2024, 35(9): 2313–2321.
[3]
Piao,
S. L., Yue, C., Ding, J. Z., et al. On the role of terrestrial ecosystem
carbon sink in achieving carbon neutrality [J]. Scientia Sinica Terrae,
2022, 52(7): 1419–1426.
[4]
Tian,
H., Zhu, J., Lei, X., et al. Models considering the theoretical stand
age will underestimate the future forest carbon sequestration potential [J]. Forest
Ecology and Management, 2024, 562: 121982.
[5]
Yao,
L., Liu, T., Qin, J., et al. Carbon sequestration potential of tree
planting in China [J]. Nature Communications, 2024, 15: 8398.
[6]
Piao,
S. L., Wang, X. H., Park, T., et al. Characteristics, drivers and
feedbacks of global greening [J]. Nature Reviews Earth &
Environment, 2020(1): 14–27.
[7]
Ruehr,
S., Keenan, T. F., Williams, C., et al. Evidence and attribution of the
enhanced land carbon sink [J]. Nature Reviews Earth & Environment,
2023(4): 518–534.
[8]
Yang,
Y. H., Shi, Y., Sun, W. J., et al. Characteristics of carbon sources and
sinks in terrestrial ecosystems in China and globally and their contribution to
carbon neutrality [J]. Scientia Sinica Vitae, 2022, 52: 534–574.
[9]
Liu,
S. R., Wang, H., Li, H. K., et al. Projection of forest carbon storage
and carbon sink changes and potential enhancement approaches for China under
carbon neutrality goal [J]. Scientia Silvae Sinicae, 2024, 60(4):
157–172.
[10]
Wei,
S. K., Li, X. Y., Wang, K., et al. Persistent greening of vegetation in
China from 2001 to 2023 [J]. Scientia Sinica Terrae, 2025, 55(4):
1099–1108.
[11]
Zhang,
M. N., Liu, S. R., Luo, X. Z., et al. Incorporating site suitability and
carbon sequestration of tree species into China’s climate-adaptive forestation
[J]. Science Bulletin, 2025, 70(11): 1834–1845.
[12]
Cai,
D. W., Ge, Q. S., Wang, X. M., et al. Contributions of ecological
programs to vegetation restoration in arid and semiarid China [J]. Environmental
Research Letters, 2020, 15: 114046.
[13]
Song,
W. Q., Feng, Y. H., Wang, Z. H. Ecological restoration programs dominate
vegetation greening in China [J]. Science of the Total Environment,
2022, 848: 157729.
[14]
Lu,
F., Hu, H. F., Sun, W. J., et al. Effects of national ecological
restoration projects on carbon sequestration in China from 2001 to 2010 [J]. Proceedings
of the National Academy of Sciences of the United States of America, 2018,
115(16): 4039–4044.
[15]
Zhang,
Y., Yuan, J., You, C. M., et al. Contributions of national key forestry
ecology projects to the forest vegetation carbon storage in China [J]. Forest
Ecology and Management, 2020, 462: 117981.
[16]
Ma,
Y. Q., Huang, L., Li, J. H., et al. Carbon potential of China’s Grain to
Green Program and its contribution to the carbon target [J]. Resources,
Conservation & Recycling, 2024, 200: 107272.
[17]
Zhai,
J. J., Wang, L., Liu, Y., et al. Assessing the effects of China’s
Three-North Shelter Forest Program over 40 years [J]. Science of the Total
Environment, 2023, 857: 159354.
[18]
Fu,
B. J., Liu, Y. X., Meadows, M. E. Ecological restoration for sustainable
development in China [J]. National Science Review, 2023, 10(7): 60–71.
[19]
Xu,
J. Y. Estimation of spatial distribution of potential afforestation land and
its climatic productivity potential in China [J]. Acta Geographica Sinica,
2023, 78(3): 677–693.
[20]
Xu,
H., Yue, C., Zhang, Y., et al. Forestation at the right time with the
right species can generate persistent carbon benefits in China [J]. Proceedings
of the National Academy of Sciences of the United States of America, 2023,
120(41): e2304988120.
[21]
Lu,
D., Zhang, C. H., Cao, Y., et al. Dataset on changes in afforested area
of key forestry ecological projects in China (2002–2020) [J/DB/OL]. Digital
Journal of Global Change Data Repository, 2026.
https://doi.org/10.3974/geodb.2026.02.02.V1.
[22]
GCdataPR
Editorial Office. GCdataPR data sharing policy [OL].
https://doi.org/10.3974/dp.policy.2014.05 (Updated 2017).
[23]
Wang,
S. Y. 2024 China Natural Resources Bulletin released [N]. China Natural
Resources News, 2025-03-14(001).
[24]
National
Forestry Administration. China Forestry Statistical Yearbook (2002–2016) [M].
Beijing: China Forestry Publishing House, 2003–2017.
[25]
National
Forestry and Grassland Administration. China Forestry Statistical Yearbook 2017
[M]. Beijing: China Forestry Publishing House, 2018.
[26]
National
Forestry and Grassland Administration. China Forestry and Grassland Statistical
Yearbook (2018–2020) [M]. Beijing: China Forestry Publishing House, 2019–2021.
[27]
Fang,
J. Y., Chen, A. P., Peng, C. H., et al. Changes in forest biomass carbon
storage in China between 1949 and 1998 [J]. Science, 2001, 292:
2320–2322.
[28] Xu, S. R. Spatiotemporal variation
analysis and potential prediction of forest carbon sink and its economic value
in China [D]. Harbin: Harbin Normal University, 2023.