1-km
Grid Dataset Development of Land Surface Human Activity Intensity of China
(1980–2023)
CHAI Yi1 ZHANG Rui1,2 SHI Shengxiang3,4 ZHOU Qiang1 ZHAO Lei1,2* MIAO Peipei1,2*
1. Faculty of
Geography, Yunnan Normal University, Kunming 650500, China;
2. Engineering Research Center of GIS Technology for West-China
Resources and Environment, Ministry of Education, Yunnan Normal University,
Kunming 650500, China;
3. State Key Laboratory of Remote Sensing and Digital Earth,
Beijing Normal University, Beijing 100875, China;
4. Faculty of Geographical
Science/Beijing Engineering Research Center for Global Land Remote Sensing
Products, Beijing Normal University, Beijing 100875, China
Abstract:
Harmonious coexistence between humans and nature is fundamental to the
sustainable development of human civilization. However, continuous observations
of land-surface human activity intensity at the national scale and over
extended periods remain limited. In response to the major data requirements of
coupled human-environment systems and global change research, this study used
multiperiod land-use remote sensing monitoring data from China, comprising 12
epochs covering 1980–2023 and released by the Resource and
Environmental Science Data Platform, as the baseline data. Relying on the
Google Earth Engine (GEE) cloud platform, we integrated multisource feature
variables, including long-term remote sensing imagery, meteorological, and
topographic features. By employing the random forest algorithm and
spatiotemporal consistency constraint mechanisms, we reconstructed a long-term
sequence of land use type data products for China from 1980 to 2023. On this
basis, using the construction land equivalent coefficient method, we converted
different land use types into a unified metric of human contribution,
generating a 1-km spatial resolution dataset of the land-surface human activity
intensity (HAI) index. The contents of this dataset include (1) 40 epochs of
land-surface HAI data for 1980 and continuously from 1985 to 2023; (2) land-use
transition matrix data at 5-year intervals from 1980 to 2023, along with code
explanation files; (3) historical statistical data on China’s equivalent
construction land area and HAI; and (4) the intermediate process data used for
calculations. The dataset is archived in .tif, .xlsx, clr, and .txt formats,
consisting of 93 data files with a total size of 1.93 GB (compressed into a
single 307 MB file). This
dataset supported the first author’s Master of Science thesis in Cartography
and Geographic Information System.
Keywords: human activity intensity; construction land equivalent coefficient; sustainable
development; China; Master of Science thesis
DOI: https://doi.org/10.3974/geodp.2026.05.02
Dataset Availability Statement:
The dataset supporting this paper
was published and is accessible
through the Digital Journal of Global Change
Data Repository at:
https://doi.org/10.3974/geodb.2026.06.01.V1.
1 Introduction
The
profound impacts of anthropogenic activities on the Earth system mark the
advent of the “Anthropocene”[1,2]. As
interactions within coupled human-environment systems intensify, accurately
characterizing and measuring the spatiotemporal impacts of anthropogenic
activities on the land surface has become a central focus of global
environmental change and sustainability research[3–5].
Although point-source or latent disturbances—such as industrial emissions,
groundwater overextraction, and deep mineral exploitation—exert significant
influences on ecosystems, land use and land cover change (LUCC) remains the
most direct and spatially extensive core indicator of human occupation and
modification of the land surface[6,7]. Processes
such as construction land expansion[7],
agricultural intensification[8], and forest
degradation and restoration[9] intuitively
reflect the intensity of human impacts on land-surface material cycles and
energy flows.
As a crucial
representation of human disturbance to natural systems, the land-surface human
activity intensity (HAI) index provides an integrated, standardized metric for
measuring the extent to which construction land expansion, land use structural
transformation, and spatial pattern evolution impose graduated pressures on
ecological processes and environmental outcomes[10,11].
Consequently, HAI holds fundamental value for territorial spatial planning,
ecological civilization assessment, ecological redline effectiveness
evaluation, and monitoring progress toward China’s “dual carbon” (carbon
peaking and carbon neutrality) goals.
Existing studies
and products mapping human activity intensity largely follow 3 technical
pathways. The first pathway involves the construction of composite indices from
remotely sensed variables such as nighttime lights, population density, and
impervious surfaces[12,13]. While
advantageous in terms of update frequency and spatial coverage, this approach
is only indirectly linked to categorical land use planning. The second pathway
overlays and weights socioeconomic factors such as population density, GDP, and
road density[13], which offers strong
explanatory power but is highly susceptible to temporal inconsistencies in
statistical definitions. The third approach employs equivalence weighting
factors based on land use/cover datasets[10].
This method aligns well with territorial management classification systems and
associated policy implications, yet it is traditionally constrained by the
spatiotemporal resolution, classification consistency, and temporal continuity
of the underlying data.
At the national
scale in China, earlier products commonly suffer from discrete observation
periods, spurious changes induced by shifting classification schemes over time,
a lack of annual continuity, and difficulties in achieving high-resolution,
nationally consistent spatial representation. These limitations hinder the
accurate characterization of rapid urbanization, industrial relocation, and
large-scale ecological projects (e.g., the Grain for Green Program) since the
1980s and obscure the pronounced geographic gradients across the HU Huanyong
Line. Recently, the accumulation of long-term remote sensing archives, the
widespread adoption of cloud computing platforms, and the maturation of machine
learning methods have created unprecedented opportunities for constructing
long-term, cross-comparable land-surface products[14,15].
To address these
scientific and practical demands, this study developed a spatiotemporally
continuous HAI dataset for China covering the period from 1980 to 2023 by
undertaking the following work:
(1) Utilizing the multiperiod land use remote
sensing monitoring data of China as a baseline[16],
we leveraged the Google Earth Engine (GEE) cloud platform and a random forest
classifier to construct a temporally consistent national land use product and
applied cross-period consistency constraints to suppress classification noise
and spurious changes. (2) Based on the built-up land equivalence coefficient
method, we generated an annual, 1-km gridded HAI dataset (1980, 1985–2023),
which was aligned with the territorial spatial management classification system
under a unified metric. Compared with previous products that rely on
single-source proxies or statistical overlays, this unified-metric dataset
achieves a superior balance among indicator interpretability, policy relevance,
and cross-period consistency.
2 Metadata of the Dataset
The
metadata of the 1-km grid dataset of land surface human activity
intensity of China (1980–2023)[17]—including
the dataset title, authors, geographic coverage, year of the data, temporal
resolution, spatial resolution, data files, publication and sharing platforms,
and data-sharing policy—are summarized at the Table
1.
Table 1 Metadata summary of the 1-km
grid dataset of land surface human activity intensity of China (1980–2023)
|
Items
|
Description
|
|
Dataset full name
|
1-km grid dataset of land surface human
activity intensity of China (1980–2023)
|
|
Dataset short name
|
CNHAI1980–2023
|
|
Authors
|
Chai, Y., Faculty of Geography, Yunnan Normal
University, chaiyi@ynnu.edu.cn
Zhang, R., Faculty of Geography, Yunnan Normal
University, 2243206000084@ynnu.edu.cn
Shi, S. X., Beijing Normal University,
202621051162@mail.bnu.edu.cn
Zhou, Q., Faculty of Geography, Yunnan Normal
University, 2143206000378@ynnu.edu.cn
Zhao, L., Faculty of Geography,
Yunnan Normal University, and Engineering Research Center of Geographic
Information Technology for Western Resources and Environment, Ministry of
Education, zhaolei@ynnu.edu.cn
Miao, P. P., Faculty of Geography, Yunnan Normal
University, 200107@ynnu.edu.cn
|
|
Geographical region
|
China
|
|
Year
|
1980, 1985–2023
|
|
Temporal resolution
|
Year
|
|
Spatial resolution
|
1 km
|
|
Data format
|
tif, .xlsx, .clr, .txt
|
|
Data size
|
307 MB (compressed)
|
|
Data files
|
40 continuous epochs of spatial HAI data covering
1980 and 1985–2023; Land-use transition matrices at 5-year intervals from
1980 to 2023, along with code explanation files; Historical statistics on
equivalent construction land area and HAI in China, etc.
|
|
Foundations
|
Yunnan Province Science and Technology Department
(202405AC350070, 202601CI070025); Yunnan Federation of Social Sciences
(YB202444)
|
|
Data computing
environment
|
GEE, GDAL, Python 3.10
|
|
Data publisher
|
Global Change
Research Data Publishing & Repository, http://www.geodoi.ac.cn
|
|
Address
|
No. 11A, Datun Road, Chaoyang District,
Beijing 100101, China
|
|
Data sharing policy
|
(1) Data are
openly available and can be freely downloaded via the Internet; (2) End users
are encouraged to use Data subject to citation; (3) Users, who are by
definition also value-added service providers, are welcome to redistribute Data
subject to written permission from the GCdataPR Editorial Office and the
issuance of a Data redistribution license; and (4) If Data are
used to compile new datasets, the “ten percent principle” should be followed
such that Data records utilized should not surpass 10% of the new
dataset contents, while sources should be noted in suitable places in the new
dataset[18]
|
|
Communication and
searchable system
|
DOI, CSTR, Crossref, DCI, CSCD, CNKI,
SciEngine, WDS, GEOSS, PubScholar, CKRSC, OARL
|
3 Methods
3.1 Technical Workflow
The
overall workflow for dataset construction is illustrated in Figure 1.
First, we utilized 12 epochs of land use remote sensing monitoring data from
China (1980, 1990, 1995, 2000, 2005, 2008, 2010, 2013, 2015, 2018, 2020, and
2023) released by the Resource and Environmental
Science Data Platform, Chinese Academy of Sciences, as baseline datasets[19]. To overcome the lack of
dense, year-by-year historical ground truth samples, we adopted a temporally
stable sample extraction strategy. By overlaying adjacent baseline land use
maps separated by more than 5 years (e.g., 1990–1995) at the pixel level, we
identified pixels with unchanged land use classes and treated them as
high-confidence, temporally stable samples. Through stratified random sampling,
we acquired approximately 1.95 million sample points covering 26 land use
classes. Second, leveraging the GEE platform, we systematically acquired
surface reflectance imagery from the Landsat TM, ETM+, and OLI/ OLI-2 sensors
for the period from 1980–2023 period (30-m spatial resolution). Utilizing
quality assessment (QA) bands for cloud masking, we applied a median compositing
algorithm over the vegetation growing season (May–October) to generate
high-quality, cloud-free annual remote sensing mosaics.
For feature space
construction, in addition to the six original Landsat multispectral bands, we
calculated 4 core spectral indices representing vegetation growth, surface
moisture, and built-up characteristics: the NDVI, NDWI, NDBI, and EVI. For the
terrain variables, we incorporated the 30-m SRTM DEM from NASA to derive
elevation, slope, and aspect. We further integrated core bioclimatic covariates
from the approximately 1-km WorldClim global dataset (BIO1, BIO12, BIO4, and
BIO15). Together, these variables formed a 17-dimensional base feature space
for the pre-2000 data. After 2000, we integrated annual MODIS vegetation
indices (MOD13A2 V6.1), expanding the feature space to 19 dimensions. Third, by
employing the random forest (RF) ensemble learning algorithm, we partitioned
the samples into training (70%) and validation (30%) sets, optimizing the
hyperparameters via cross-validation. To guarantee temporal continuity and
classification consistency, we introduced Savitzky-Golay temporal smoothing,
cross-period classification standardization, and trend interpolation as
spatiotemporal constraints, ultimately producing 40 epochs of annual land use
maps.
Finally, following
the construction land equivalent coefficient framework proposed by Xu, et al.[10], we assigned equivalent coefficients
to 26 land-use classes according to their relative levels of human disturbance,
treating construction land as the reference (equivalent coefficient=1). We then
computed the HAI index for each 1-km grid cell using an area-weighted averaging
approach, thereby generating a spatially continuous HAI dataset for all of
China (Figure 1).
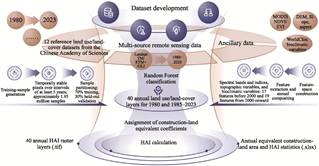
Figure 1 Flowchart of the dataset development
3.2 Algorithm
3.2.1 Construction of Multisource
Feature Space
To balance robustness for long-term
computation with the richness of land-surface information, we constructed a
dynamically dimensioned multisource feature space (Table 2). The base RF feature space comprises 17
variables: 6 original Landsat multispectral bands (blue, green, red,
near-infrared, shortwave infrared 1, and shortwave infrared 2), 4 derived
spectral indices, 3 SRTM-based topographic variables, and 4 WorldClim-based
climatic variables. For 2000 and later, we incorporated annual composite
vegetation index products (MOD13A2 V6.1) from the MODIS sensor, extending the
feature space to 19 dimensions. Owing to its high temporal resolution, MODIS
can effectively compensate for the limited observation frequency of Landsat
30-m imagery in cloud-prone regions, providing complementary multiscale
information.
To obtain continuous, high-quality annual mosaics, we departed from
conventional single- step compositing and adopted a multilevel image
prioritization and cooperative gap-filling strategy. This method first
prioritizes high-quality imagery within each year and applies median
compositing at the pixel level. For local areas where effective observations
were missing because of persistent cloud masking, we dynamically retrieved
Landsat L2 surface reflectance products, rigorously masked clouds via QA bands,
and performed median compositing for valid cloud-free pixels during the growing
season (May–October) for gap filling. For a very small fraction of areas with
extreme observation scarcity, we applied a constant zero-value masking. This
approach ensured complete spatial coverage and consistent temporal series
based on the foundational imagery.
Table
2
Variables included in the feature
space for random forest classification
|
Feature category
|
Variables
|
Number of variables
|
Data source and product
|
|
l bands
|
Blue, green, red, near-infrared, shortwave-infrared
1, and shortwave- infrared 2
|
6
|
USGS Landsat Level-2 surface reflectance products
(TM/ETM+/OLI/OLI-2)
|
|
Landsat spectral
indices
|
NDVI, NDWI, NDBI, and EVI
|
4
|
Calculated from Landsat surface reflectance bands
|
|
Topographic variables
|
Elevation, slope, and aspect
|
3
|
NASA/USGS SRTM Version 3 digital elevation
model (30 m)
|
|
Bioclimatic variables
|
Annual mean temperature (BIO1), annual precipitation
(BIO12), temperature seasonality (BIO4), and precipitation seasonality
(BIO15)
|
4
|
WorldClim Version 1 global bioclimatic dataset
|
|
MODIS vegetation
indices
|
Annual composite MODIS NDVI and EVI
|
2
|
NASA Terra MODIS vegetation-index product (MOD13A2
Version 6.1; included from 2000 onward)
|
|
Total
|
/
|
17/19 (17 variables before 2000 and 19 variables from
2000 onward)
|
3.2.2 Random Forest Parameterization
Land
use/cover classification is essentially a complex, nonlinear mapping problem in
a high-dimensional feature space[20]. In this study,
we adopted the RF ensemble learning algorithm as the core classifier. As a
decision-tree-based ensemble model, the RF introduces bootstrap aggregation of
samples and random selection of split features at each node, effectively
reducing overfitting. When dealing with LUCC, RF not only exhibits strong
tolerance and robustness to highly collinear, multisource, high-dimensional
data (spectral, terrain, climate, etc.) but also efficiently captures nonlinear
decision boundaries among land-use types (e.g., paddy field vs. dry cropland
and grassland with different cover levels) in complex spectral and phenological
spaces[21].
To balance classification accuracy with computational efficiency at the
national scale and for long-term remote sensing data, we systematically tuned
and strictly constrained the global RF hyperparameters: the number of decision
trees was set to 500 to ensure model convergence and generalization; the
maximum number of features for node splits was set to the square root of the
total feature count; the minimum number of samples per leaf node was set to 1;
the bootstrap sampling rate was 0.7; and the maximum node complexity was
constrained to 128. These settings promote the stability and reproducibility of
long-term classification predictions.
3.2.3 Construction Land Equivalent Coefficients and HAI Calculation
Following
the theoretical framework of land surface-human activity intensity proposed by
Xu, et al.[10], we treat
construction land—where the natural landform is completely transformed and
human influence is dominant—as the reference (equivalent coefficient=1). The
other land-use types are assigned coefficients according to their relative
levels of anthropogenic disturbance (Table 3). The
HAI for each 1-km grid cell is computed as an area-weighted average:
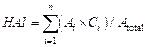 (1)
where  is the area of land-use category i within the grid cell,
 is its equivalent coefficient, and
 is the total area of the grid cell. The index
ranges from 0 to 1, with higher values indicating greater human activity
intensity.
Table
3 Construction land equivalence coefficients for land use/land cover classes
|
First-level class
|
Second-level code
|
Land use/land-cover class
|
Equivalent coefficient
|
|
Cropland
|
11/12
|
Paddy field/dry cropland
|
0.200
|
|
Forest
|
21/22/23
|
Closed-canopy forest/shrubland/sparse
woodland
|
0.000
|
|
24
|
Other forestland
|
0.133
|
|
Grassland
|
31
|
High-coverage grassland
|
0.133
|
|
32
|
Medium-coverage grassland
|
0.067
|
|
33
|
Low-coverage grassland
|
0.000
|
|
Water bodies
|
41–46
|
Rivers and canals/lakes/reservoirs
|
0.000
|
|
Built-up land
|
51/52/53
|
Urban land/rural settlements/other
built-up land
|
1.000
|
|
Unused land
|
61–67
|
Sandy land/Gobi Desert/bare land
|
0.000
|
4 Data Results and Validation
4.1 Dataset Composition
The “1-km grid dataset of land surface human activity
intensity of China (1980–2023)” includes the following components: (1) 40
epochs of continuous HAI data for 1980 and annually from 1985 to 2023; (2)
land-use transition matrices at 5-year intervals from 1980 to 2023 and
associated code description files; (3) annual equivalent construction land area
and national-level HAI statistics; and (4) intermediate-process data used
during HAI computation.
4.2 Data Validation and Uncertainty
Attribution
Using the reserved 30% independent validation
samples, we constructed confusion matrices and evaluated classification
performance using overall accuracy (OA) and the kappa coefficient. The results
show an OA of 86.92% and a kappa coefficient of 0.86. Spatial patterns of
accuracy exhibit clear geographical regularities: the classification of lakes
(95.03%) and forestland (91.98%) is highly reliable. The accuracy loss is
concentrated mainly in rural residential land within the construction land
category (F1 score of approximately 32.27%). This limitation is rooted in the
“mixed-pixel” effect under specific geomorphological conditions: in the
extensive mountainous areas of Southwest China and the fragmented rural
settlements of the Huang-Huai-Hai Plain, rural homesteads are highly scattered
and intermixed; at a 30 m spectral resolution, they easily blend with
surrounding croplands or forest canopies. In addition, in the desert-grassland
ecotone in western China, slope shadows and other terrain effects further blur
the boundaries between bare land and low-coverage grassland (OA<80%).
Despite these confusions in certain
fine-scale land-use subclasses, aggregation to the 1-km grid and area-weighted
conversion substantially reduce their impact on HAI estimates. Overall, the
resulting HAI patterns are consistent with known geographical gradients and
socioeconomic development trajectories, and are therefore considered robust and
reasonable for macroscale applications.
4.3 Data Result Analysis
4.3.1 Spatiotemporal Characteristics of Land use Transitions
in China
The spatiotemporal patterns of land use transitions over the
past four decades (1980–2023) was illustrated at the Figure 2,
it covers multiple subperiods with a cumulative transition area of
approximately 2,312,772 km2, or approximately 24.4%
of the national land area. Four dominant transition flows characterize the core
features of land use change: cropland to construction land (approximately
289,649 km2, 12.5% of total transitions), grassland to forestland
(approximately 214,495 km2, 9.3%), cropland to forestland
(approximately 222,552 km2, 9.6%), and forestland to cropland
(approximately 242,127 km2, 10.5%). Net construction land area
increased by 2.7 percentage points, from 1.5% of the national land area in 1980
to 4.2% in 2023, whereas cropland decreased by 1.8 percentage points; grassland
and unused land declined slightly, by 0.7 and 0.6 percentage points, respectively.
From a temporal
perspective, the overall transition rate was relatively low (approximately 15%)
from 1980 to 2000, peaked from 2000 to 2015 (approximately 20%), and remained
high from 2020 to 2023, while construction land expansion continued to be
substantial (approximately 19%). Overall, land use underwent a transformation
from agricultural and natural dominance toward an urban-ecological codominance
pattern, with pronounced spatial heterogeneity. In eastern China, construction
land expansion was dominant, accounting for approximately 45% of all
transitions, especially in major urban agglomerations such as the Yangtze River
Delta and Pearl River Delta. In western China, mutual transitions between
grassland and unused land were prominent (approximately 12%), driven by the
vulnerability of dry climates and complex terrain, where grassland tends to
degrade into unused land. Moreover, reforms and urbanization led to path
dependence, supporting the conversion of cropland to construction land.
The
socio-political mechanisms exhibit two-way coupling: ecological restoration
programs such as Grain for Green provide negative feedback that promotes forest
recovery (forest gains accounting for approximately 15% of transitions from
2000 to 2010), whereas urbanization exerts positive feedback that challenges
the protection of cropland “red lines”. The overall pattern is scale-dependent:
at the national scale, transition shares among land- use categories change only
slightly, and the system appears relatively stable; however, at regional
scales, changes can be dramatic, with ecological degradation-dominated
trajectories in parts of western China and rapid expansion of construction land
in the east, exemplifying the principle of human dominance in land-surface
processes in the Anthropocene.
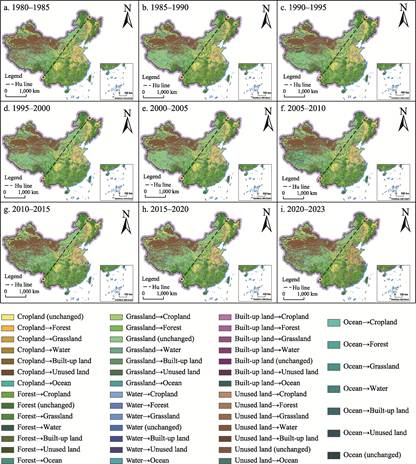
Figure 2 Maps of the land use/land-cover transitions
patterns in China during 9 periods (1980–2023)
4.3.2 Spatiotemporal Change of Land Surface Anthropogenic Activity
Intensity in China
The significant spatiotemporal changes in China’s HAI between
1980 and 2023 was illustrated at the Figure 3. The national mean HAI increased
from 0.18 in 1980 to 0.37 in 2023, a growth of 105.6%. Spatially, high-value
HAI zones are concentrated in the eastern coastal regions (e.g., the Yangtze
River Delta and Pearl River Delta) and key northern urban clusters (e.g.,
Beijing-Tianjin-Hebei), reflecting the imprint of urbanization. The western
plateau and northern grassland regions are characterized by low HAI, but
localized hotspots are emerging around mining areas and major infrastructure
corridors.
In terms of
temporal evolution, 1990–2010 was a period of rapid growth, with an average
annual HAI increase of approximately 2.5%, corresponding to the peak of
industrialization and urbanization under the reform and opening-up policy.
After 2010, growth slowed to approximately 1.2% per year, largely attributable
to the strengthened implementation of ecological protection policies.
The evolution of HAI follows a “point
agglomeration-corridor expansion-polarization intensification” pattern. From
1980 to 2000, the HAI increased mainly through broad-scale expansion, with
low-intensity areas shrinking by approximately 60,097 km2, primarily
in the eastern monsoon region plains. From 2000 to
2020, rapid urbanization drove medium-high HAI expansion, with high-intensity
areas increasing by more than 4,500 km2 per year and
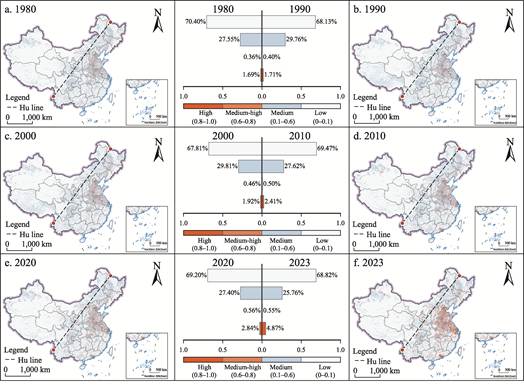
Figure
3 Distribution
maps of HAI class composition in China
extending
into central hilly regions and major river valleys. From 2020 to 2023, patterns
underwent rapid restructuring, with high-intensity areas surging by
approximately 192,897 km2 and an average annual growth rate of
6.43%, forming a “string of pearls” like network of urban clusters.
This pattern is
strongly shaped by geographic fundamentals. East of the HU Huanyong
Line—occupying approximately 45% of China’s land area but hosting approximately
94% of its population—HAI is highest, while western high-mountain and desert
regions exhibit the lowest intensity, with a clear gradient of attenuation from
coast to inland. The observed evolution reflects the interplay between
environmental determinism and spatial polarization theory: biophysical
conditions in eastern plains (including fertile soils and dense river networks)
underpin the transition from low to medium HAI (approximately 32% of transitions),
whereas human geographic factors, such as population concentration in urban
clusters, such as Beijing-Tianjin-Hebei, drive the increase from medium to high
HAI (approximately 40%). These patterns highlight geographic trade-offs in
socioecological processes.
5 Discussion and Conclusion
The
dataset developed in this study fills an important gap in long-term HAI
products for China, providing annual continuity and explicit alignment with
land-use policy frameworks. Nonetheless, uncertainty remains, mainly arising
from limitations in remote sensing spatial resolution and the subjective nature
of construction land equivalent coefficients. Future work can integrate
higher-resolution imagery, more advanced machine-learning methods, and richer
multisource socioeconomic data to further improve classification accuracy and
broaden the application scope. The dataset can serve as a foundational input
for assessing progress toward the Sustainable Development Goals (SDGs),
evaluating the effectiveness of ecological red-line policies, and modeling
coupled human–environment systems.
5.1 Uncertainties in the Classification Framework
and Scale Effects
Large-scale
Earth observations inevitably entail methodological uncertainties. Owing to the
limited effective coverage of Landsat TM imagery before 2000—particularly in
some border regions of western China—this study relies on machine-learning
models that integrate climate and terrain variables supplemented by temporal
logic filters to predict land-use classes and fill gaps. This approach may
reduce sensitivity to some extent to localized, abrupt land-cover disturbances.
In addition, while the 1 km spatial resolution is well suited to national-scale
ecological assessments, it inevitably introduces homogenization errors when the
extremely fragmented human-environment landscapes of Southwest China’s karst
mountains are represented through upscaling.
5.2 Limitations of the Physical Representation
of HAI
The
HAI derived from LUCC-based equivalent conversion essentially measures the
intensity of human-induced alteration of land-surface material and energy
fluxes. This theoretical framework cannot yet capture multidimensional “hidden”
human footprints such as industrial chemical pollution, atmospheric aerosol
forcing, deep groundwater depletion, or the disruption of ecological
connectivity due to habitat fragmentation. Looking ahead, frontier research in
Earth system science may combine this two-dimensional LUCC-derived indicator
with nighttime light radiance, carbon emission inventories, mobile phone
signaling, and other big-data proxies of socioeconomic processes to construct a
more comprehensive representation of human activity footprints.
This dataset
supported the first author’s Master of Science thesis in Cartography and
Geographic Information System.
Author Contributions
Chai, Y. designed the overall framework and led the development of the dataset.
Chai, Y. and Zhang, R. jointly wrote the data paper. Shi, S. X. and Zhou, Q.
collected and processed the remote sensing data. Zhao, L. and Miao, P. P.
reviewed and revised the dataset and manuscript.
Conflicts
of Interest
The
authors declare no conflicts of interest.
References
[1]
Crutzen, P. J. Geology of
mankind: the anthropocene [J]. Écologie & Politique, 2007,
34(1): 141–148.
[2]
Zalasiewicz, J., Waters, C. N.,
Williams, M., et al. When did the anthropocene begin? a mid-twentieth
century boundary level is stratigraphically optimal [J]. Quaternary
International, 2015, 383: 196–203.
[3]
Mottl, O. E., Flantua, S. G.
A., Bhatta, K. P., et al. Global acceleration in rates of vegetation
change over the past 18,000 years [J]. Science, 2021, 372(6544):
860–864.
[4]
Zuo, L. J., Zhang, Z. X.,
Carlson, K. M., et al. Progress towards sustainable intensification in
China challenged by land-use change [J]. Nature Sustainability, 2018,
1(6): 304–313.
[5]
Yang, Y. S. The impacts of
global environmental changes on typical ecosystems: status, challenges and
trends [J]. Acta Ecologica Sinica, 2017, 37(1): 1–11.
[6]
Fu, B. J., Zhang, L. W.
Land-use change and ecosystem services: concepts, methods and progress [J]. Progress
in Geography, 2014, 33(4): 441–446.
[7]
Kuang, W. H., Liu, J. Y., Dong,
J. W., et al. The rapid and massive urban and industrial land expansions
in China between 1990 and 2010: a CLUD-based analysis of their trajectories,
patterns, and drivers [J]. Landscape and Urban Planning, 2016, 145:
21–33.
[8]
Yuan, J. T., Chen, W. X., Zeng,
J. Spatio-temporal differentiation of cropland use change and its impact on
cropland NPP in China [J]. Journal of Natural Resources, 2023, 38(12):
3135–3149.
[9]
Williams, B. A., Beyer, H. L.,
Fagan, M. E., et al. Global potential for natural regeneration in
deforested tropical regions [J]. Nature, 2024.
[10] Xu, Y., Sun, X. Y., Tang, Q. Human activity intensity of land
surface: concept, method and application in China [J]. Acta Geographica
Sinica, 2015, 70(7): 1068–1079.
[11] Duan, Q. T., Luo, L. H. Summary and prospect of spatialization
method of human activity intensity: taking the Qinghai-Tibet Plateau as an
example [J]. Journal of Glaciology and Geocryology, 2021, 43(5):
1582–1593.
[12] Wu, B., Song, Z. C., Wu, Q. S., et al. A vegetation nighttime
condition index derived from the triangular feature space between nighttime
light intensity and vegetation index [J]. IEEE Transactions on Geoscience
and Remote Sensing, 2023, 61: 1–15.
[13] Xing, X. Y., Huang, Z., Cheng, X. M., et al. Mapping human
activity volumes through remote sensing imagery [J]. IEEE Journal of
Selected Topics in Applied Earth Observations and Remote Sensing, 2020, 13:
5652–5668.
[14] Fu, D. J., Xiao, H., Su, F. Z., et al. Remote sensing cloud
computing platform development and Earth science application [J]. National
Remote Sensing Bulletin, 2021, 25(1): 220–230.
[15] Liang, J. T., Chen, C., Sun, W. W., et al. Spatio-temporal
land use/cover change dynamics in Hangzhou Bay, China, using long-term Landsat
time series and GEE platform [J]. National Remote Sensing Bulletin,
2023, 27(6): 1480–1495.
[16] Liu, J. Y., Ning, J., Kuang, W. H., et al. Spatio-temporal
patterns and characteristics of land-use change in China during 2010–2015 [J]. Acta
Geographica Sinica, 2018, 73(5): 789–802.
[17] Chai, Y., Zhang, R., Shi, S. X., et al. 1-km grid dataset of land
surface human activity intensity of China (1980–2023) [J/DB/OL]. Digital
Journal of Global Change Data Repository, 2026. https://doi.org/10.3974/ geodb.2026.06.01.V1.
[18]
GCdataPR Editorial Office.
GCdataPR data sharing policy [OL]. https://doi.org/10.3974/dp.policy.2014.05
(Updated 2017).
[19]
Xu, X. L., Liu, J. Y., Zhang,
S. W., et al. Dataset of remote sensing monitoring of land use in China
over multiple periods (CNLUCC) [DS]. Resource and Environmental Science Data
Platform, 2018. DOI: 10.12078/2018070201.http://www.resdc.cn/.
[20] Feng, Q. L., Niu, B. W., Zhu, D. H., et al. Review for deep
learning in land use and land cover remote sensing classification [J]. Transactions
of the Chinese Society for Agricultural Machinery, 2022, 53(3): 1–17.
[21] Ma, H. J., Gao, X. H., Gu, X. T. Random forest classification of
Landsat 8 imagery for the complex terrain area based on the combination of
spectral, topographic and texture information [J]. Journal of Geo-Information
Science, 2019, 21(3): 359–371.