Dataset
Development of China Root-zone Soil Moisture Based on the TCH Method (2018–2021)
Tian, J.1* Ma, H. L.2*
1. Key
Laboratory of Water Cycle and Related Land Surface Processes, Institute of
Geographic Sciences and Natural Resources Research, Chinese Academy of
Sciences, Beijing 100101, China;
2. River
and Lake Protection Center, Ordos Water Conservancy Bureau, Ordos 017000, China
Abstract:
Root zone soil
moisture (RZSM) is a key variable linking surface water cycling with vegetation
ecological processes, and it serves as an important indicator for medium- to
long-term drought monitoring, agricultural water management, and
ecohydrological assessment. However, current spatiotemporally continuous RZSM
data face considerable challenges due to limitation in direct observation and
model uncertainties. In this study, RZSM data from 2 land surface models and 3
reanalysis datasets were integrated using the Triangle Corned Hat (TCH) method
to produce a daily, 0.25° root zone (0–100 cm) soil moisture dataset for China’s
mainland covering 2018–2021. The dataset is archived in .tif format. Validation
using observations from 2,061 soil moisture monitoring stations across China
indicates that the fused dataset achieves a median RMSE of 0.077 m3/m3,
a median correlation coefficient (r) of 0.5, a bias peak close to 0, and
a median unbiased RMSE (ubRMSE) of 0.04 m3/m3. These
results demonstrate that the dataset is robust and reliable, providing valuable
support for regional-scale drought monitoring, eco-hydrological analyses, and
agricultural applications.
Keywords: root zone soil moisture; three-corned hat method; data fusion
DOI: https://doi.org/10.3974/geodp.2025.04.04
Dataset Availability Statement:
The
dataset supporting this paper was published and is accessible through the Digital
Journal of Global Change Data Repository at: https://doi.org/10.3974/geodb.2025.08.08.V1.
1 Introduction
Root
zone soil moisture (RZSM) refers to the soil water content within the main
rooting depth of vegetation and is a key variable that links surface water
cycling with vegetation ecological processes. RZSM not only directly affects
plant water availability, evapotranspiration, photosynthetic rate, and crop
yield, but also plays a crucial role in regulating land-atmosphere energy and
water exchanges within the climate system. Compared with surface soil moisture,
RZSM exhibits stronger buffering and memory capacities, making it a more
reliable indicator for medium- to long-term drought monitoring, agricultural
water management, and ecohydrological assessment[1,2]。
With the
increasing occurrence and severity of droughts and intensification of extreme
hydrological events under climate change, obtaining accurate RZSM information
is crucial for improving drought monitoring accuracy, guiding agricultural
irrigation management, and assessing ecosystem resilience. However, due to the
scarcity of in situ observations, the limited penetration depth of
remote sensing, and the high uncertainty associated with model simulations,
current RZSM data still face significant limitations[3,4].
Therefore, developing multi-source fused RZSM datasets that integrate
multi-source data (e.g., remote sensing, meteorological forcing, in situ
observations, and machine learning) is a critical foundation for advancing
integrated hydrological, ecological, and agricultural studies.
In this study,
RZSM data from 5 land surface models and reanalysis products were fused using
the Three-Cornered Hat (TCH) method to produce a root-zone (0–100 cm) soil
moisture dataset for China’s mainland. This dataset provides an important data
resource for regional drought monitoring, eco-hydrological process analysis,
and agricultural water management applications.
2 Metadata of the Dataset
The
metadata information of the Root zone (0–100 cm) soil moisture 0.25°/daily
dataset over China (2018–2021)[5] including the title, author,
geographical region, spatial and temporal resolution, data size, data file,
etc., is summarized in Table 1.
3 Methods
This
study fused the root-zone soil moisture (RZSM) data from two land surface
models and three reanalysis products (Table 2) using the TCH method to produce
a new RZSM product (0–100 cm) for China. The dataset was systematically
evaluated against observations from more than 2,000 soil moisture monitoring
stations across the country. The methodological framework consists of two main
components:
(1) Computation
of 0–100 cm root-zone soil moisture: Multi-layer soil moisture data from each
model and observation site were aggregated using a depth-weighted averaging
method. The weighting coefficients were determined based on the relative
proportion of the distance between the centers of 2 adjacent soil layers within
the total 100 cm depth, representing each layer’s relative contribution to the
total 100 cm depth. This weighted averaging process was applied independently
to each dataset, resulting in comparable 0–100 cm RZSM estimates across all
models and observation sites.
(2) Generation
of the fused product: After obtaining the 0–100 cm RZSM estimates from the 5
data sources, the TCH method was applied to quantify error variances and derive
optimal weights for each dataset, thereby producing a fused product without the
need for ground truth data. This approach objectively evaluates the relative
error levels of multiple data sources and adjusts the weighting scheme
accordingly, thereby improving the accuracy consistency, and robustness of the
fused product. The resulting dataset combines the complementary strengths of
different models while reducing the uncertainties associated with any single
source.
All data were averaged to daily temporal
resolution using arithmetic means and resampled to a 0.25° spatial resolution
via bilinear interpolation, ensuring consistent spatiotemporal
Table 1
Metadata summary of the Root zone (0–100 cm) soil moisture 0.25°/daily
dataset over China (2018–2021)
|
Item
|
Description
|
|
Dataset full name
|
Root
zone (0–100 cm) soil moisture 0.25°/daily dataset over China (2018–2021)
|
|
Dataset short name
|
RZSM_China_2018-2021
|
|
Author
|
Tian,
J., Institute of Geographic Sciences and Natural Resources Research, Chinese
Academy of Sciences, tianj.04b@igsnrr.ac.cn
|
|
Geographical region
|
China’s
mainland
|
|
Year
|
2018–2021
|
|
Temporal
resolution
|
Day
|
|
Spatial
resolution
|
0.25°
|
|
Data
format
|
.tif
|
|
Data
size
|
99.4
MB (compressed)
|
|
Data
file
|
Mean
root zone (0–100 cm) soil moisture
|
|
Foundations
|
Department of Science and Technology of Inner Mongolia
Autonomous Region, Ordos Science and Technology Bureau (ZD20232303); National
Natural Science Foundation of China (42071327)
|
|
Computing
environment
|
Python
|
|
Data publisher
|
Global
Change Research Data Publishing & Repository, http://www.geodoi.ac.cn
|
|
Address
|
No.
11A, Datun Road, Chaoyang District, Beijing 100101, China
|
|
Data
sharing policy
|
(1)
Data are openly available and can
be free downloaded via the Internet; (2) End users are encouraged to use Data subject to citation; (3) Users,
who are by definition also value-added service providers, are welcome to
redistribute Data subject to
written permission from the GCdataPR Editorial Office and the issuance of a Data redistribution license; and (4)
If Data are used to compile new
datasets, the “ten percent principal” should be followed such that Data records utilized should not
surpass 10% of the new dataset contents, while sources should be clearly
noted in suitable places in the new dataset[6]
|
|
Communication and searchable
system
|
DOI,
CSTR, Crossref, DCI, CSCD, CNKI, SciEngine, WDS, GEOSS, PubScholar, CKRSC
|
Table 2
Multi-layer soil moisture products from 5 land
surface models
|
Data name
|
Spatial resolution
|
Temporal resolution (h)
|
Depth of soil moisture (cm)
|
|
ERA5[7]
|
0.1°
|
3
|
0–7, 7–28,
28–100, 100–289
|
|
MERRA-2[8]
|
0.5°×0.625°
|
3
|
0–5, 0–100
|
|
CFSR[9]
|
0.205°×0.204°
|
1
|
0–10, 10–40,
40–100, 100–200
|
|
GLDAS-NOAH2.1[10]
|
0.25°
|
3
|
0–10, 10–40,
40–100, 100–200
|
|
SMAP Level 4[11]
|
9 km
|
3
|
0–5, 0–100
|
representation
across the entire domain.
3.1 Algorithm
(1)
Computation of 0–100 cm root-zone soil moisture
As described
above, 0–100 cm RZSM was calculated as the weighted average of multi-layer soil
moisture data, where the weights corresponding to the proportional thickness of
each soil layer within the 0–100 cm depth. For example, in the GLDAS-NOAH2.1
product, 3 layers are available within 0–100 cm: 0–10 cm, 10–40 cm, and 40–100
cm, with respective weights of 0.1, 0.3, and 0.6. The RZSM for 0–100 cm is
computed as:
 (1)
(1)
where is the averaged 0–100 cm soil
moisture.
is the averaged 0–100 cm soil
moisture. is the soil moisture at a
specific layer. The same method was applied to other datasets in Table 2.
is the soil moisture at a
specific layer. The same method was applied to other datasets in Table 2.
(2) TCH data
fusion method
TCH
method is used to evaluate the relative errors among multiple data sources and
perform weighted fusion without requiring a true reference value. It is
proposed by Tavella and Premoli [12]. Xi (i=1,2,  , N)
represents the time series of the ith RZSM product, where N
is the number of products (here, N=5). Each Xi
consists of the true value Xt and an error term εi:
, N)
represents the time series of the ith RZSM product, where N
is the number of products (here, N=5). Each Xi
consists of the true value Xt and an error term εi:
 (2)
(2)
where
i = 1, 2 , N.
To estimate εi, differences between N–1 products and
a randomly chosen reference product XR are computed as:
 (3)
(3)
where
i = 1, 2 , N–1.
The covariance between the errors εi and εj
is:
 (4)
(4)
where
i, j = 1, 2 , N–1. M is the number of temporal samples. and
and are the mean of error of the ith
RZSM product and jth RZSM product, respectively. The
superscript T denotes the transpose. Accordingly, the covariances
between Yi and Yj can be expressed as:
are the mean of error of the ith
RZSM product and jth RZSM product, respectively. The
superscript T denotes the transpose. Accordingly, the covariances
between Yi and Yj can be expressed as:
 (5)
(5)
where i, j = 1, 2
, N–1.
rij, riR, rjR, and rRR
represent the covariance between εi and εj,
the covariance between εi and εR, the
covariance between εj and εR, and the
covariance between εR and εR, respectively,
and are calculated using Equation 4. However, Equation 4 cannot be solved
directly because the number of unknowns exceeds the number of equations. Galindo and Palacio (1999) proposed the constrained
minimization problem based on the Kuhn- Tucker theorem and
solved this problem[13]. The objective function F and the
constraint condition H are:
 (6)
(6)
 (7)
(7)
 (8)
(8)
 (9)
(9)
 (10)
(10)
where R represents the error covariance matrix; S represents
the covariance matrix of the sum; K represents the identity matrix. rij
( i = 1, 2, , N) represents the error
covariance between the ith and jth
products. All pairwise interactions among the products yield an error
covariance matrix. The weights used in fusing soil moisture products are
determined by the inverse of this error covariance matrix. This matrix not only
estimates the uncertainty of the TCH method but also accounts for error
correlation. According to the Gauss-Markov theorem, this method yields a
weighted average with the minimum variance.
 (11)
(11)
 (12)
(12)
where
C denotes the error covariance matrix obtained from calculations,W represents
the weight matrix. Xweighted is the transformed form
of the weight matrix. J is the design matrix, which is a vector
consisting entirely of 1,i.e. [1, ,1]T.
The weight value of each product in data fusion is
derived from the above parameters.
3.2 Technical Workflow
|
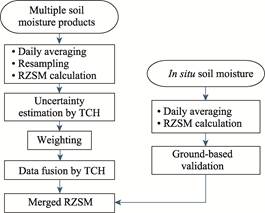
Figure 1 Flowchart of the dataset development
|
The
development of this dataset involved 6 steps: (1) Preprocessing of soil
moisture data products: For each dataset, the temporal mean values were
computed, and all data were resampled to a 0.25° spatial resolution to ensure
consistency. Then, the 0–100 cm root-zone soil
moisture was derived using a depth-weighted averaging method. (2) Preprocessing
of in situ soil moisture observations: Daily mean soil moisture
values were calculated for each observation site, and the 0–100 cm soil
moisture was derived using the same depth-weighted approach as applied to the
other soil moisture products. (3) Estimation of error variance using the TCH
method: Error variances for the preprocessed soil moisture products were
calculated based on the TCH method. (4) Weight determination: The relative
weights of each product were calculated according to their estimated error
variances, reflecting their reliability in the subsequent fusion process. (5)
Data fusion: The individual soil moisture products were combined using the derived
weights to produce the fused RZSM dataset. (6) Validation: The fused dataset
was validated against in situ soil moisture
observations from monitoring stations to evaluate its accuracy and robustness
(Figure 1).
4 Data Results and Validation
4.1 Dataset Composition
The
Root zone (0–100 cm) soil moisture 0.25°/daily dataset over China (2018–2021)
provides daily root zone (0–100 cm) soil moisture data for China’s mainland
from 2018 to 2021, with a spatial resolution of 0.25° and archived in .tif
format. A total of 1,461 files is included in the dataset.
4.2 Data Results
Figure
2 illustrates the multi-year monthly mean distribution of RZSM across China’s
mainland (January–December). The spatial patterns exhibit distinct regional
differences, with soil moisture generally decreasing from the humid southeast
to the arid northwest. Southeastern China maintains higher soil moisture levels
due to abundant precipitation, humid climate, and dense vegetation cover, all
of which enhance soil moisture retention. In contrast, northwestern China
experiences much lower soil moisture because of its arid climate, limited
rainfall, and high evaporation rates, which constrain effective soil moisture
recharge. In high-altitude regions such as the Qinghai-Xizang Plateau, soil
moisture dynamics are further shaped by cold temperatures, permafrost
conditions, and complex hydrothermal processes.
Temporally, RZSM
exhibits clear seasonal variations: (1) Spring (March–May): As temperatures
rise and precipitation increases, soil moisture gradually replenishes following
the winter dry period. (2) Summer (June–August): Concentrated rainfall induces
the annual peak in soil moisture, representing the main recharge season. (3)
Autumn (September– November): With declining temperatures and reduced
precipitation, soil moisture begins to decrease. (4) Winter
(December–February): Under low temperatures and snow-dominated precipitation,
combined with low evaporation, soil moisture remains relatively stable at a low
level.
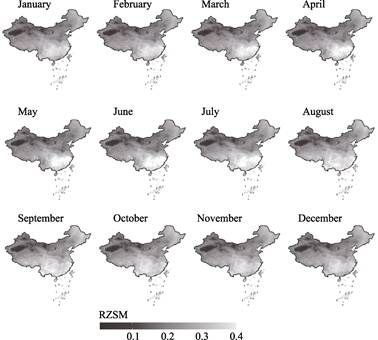
Figure
2 Maps of
multi-year monthly average values of RZSM of China
4.3 Data Validation
Validation
of the TCH-fused dataset was performed using observations from 2,061 soil
moisture stations across China’s mainland (Figures 3, 4). The observation
network is denser in eastern and central China, while coverage is sparser in
the west. Figure 3 shows no pronounced spatial trend although higher
correlation coefficients (r) are observed in northern and southern
China. RMSE values peak between 0.05 and 0.10 m3/m3 with
a median of 0.077 m3/m3, indicating moderate errors at
most stations, though a high-value tail reflects a few larger deviations.
Correlation coefficient (r) peaks between 0.5 and 0.8, with a median of
0.5, suggesting generally good linear consistency, though a small portion of
low correlations persists, particularly in the northwestern region. Bias
cluster around 0, mostly within –0.05 m3/m3 to 0.05 m3/m3,
implying no significant systematic bias at the national scale, though slight
underestimation is evident in parts of North China. ubRMSE values peak between
0.03 and 0.05 m3/m3, with a median of 0.04 m3/m3,
indicating small random errors for most stations but a few outliers exhibit
higher uncertainty. Overall, these validation results demonstrate that the
TCH-based fusion method provides reliably and robust performance at the
national scale. However, remaining discrepancies are mainly associated with the
inherent accuracy of the input datasets. Additionally, scale mismatches may
contribute to uncertainty, as station observations represent point-scale
conditions, whereas the fused dataset corresponds to a 0.25° grid, encompassing
a substantially larger spatial extent.
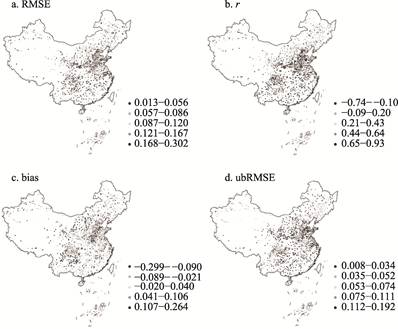
Figure
3 Maps of site
verification effect diagram of soil moisture data after TCH fusion of China
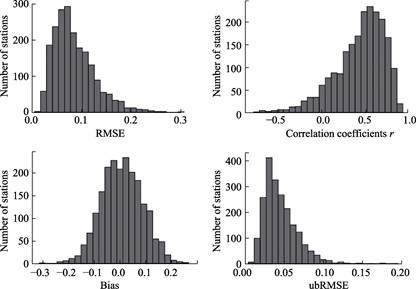
Figure
4 Histogram
statistics of site verification results
5 Discussion and Conclusion
Using
the TCH fusion method, multiple RZSM datasets were integrated and validated
against observations from 2,061 soil moisture stations across China. The median
values of the key validation metrics for the fused dataset were 0.077 m3/m3
for RMSE, 0.5 for the correlation coefficient, 0.008 m3/m3
for bias, and 0.04 m3/m3 for ubRMSE. The peak values were
primarily concentrated within the ranges of 0.05–0.10 m3/m3
for RMSE, 0.5–0.8 for r, near 0 for bias, and 0.03–0.05 m3/m3
for ubRMSE. These results demonstrate that the fused dataset exhibits good
reliability and that the TCH method performs robustly, making it well-suited
for large-scale applications across China. Considering the scarcity and observational
challenges of in situ RZSM measurements, the resulting dataset provides
valuable support for hydrological, agricultural, and ecological research.
Future improvements could further enhance fusion accuracy by incorporating
additional data sources and optimizing the selection of input variables to
better capture spatiotemporal variability in root zone soil moisture.
Author Contributions
Ma, H. L. contributed to the overall design of the dataset
development; Tian, J. processed, analyzed the data and wrote the paper.
Conflicts of Interest
The authors
declare no conflicts of interest.
References
[1]
Tobin, K. J., Torres, R., Crow,
W. T. Multi-decadal analysis of root-zone soil moisture applying the
exponential filter across CONUS [J]. Hydrology and Earth System Sciences,
2017, 21 (9): 4403–4417.
[2]
Zohaib, M., Kim, H., Choi, M.
Evaluating the patterns of spatiotemporal trends of root zone soil moisture in
major climate regions in East Asia [J]. Journal of Geophysical Research-Atmospheres,
2017, 122 (15): 7705–7722.
[3]
Xu, L., Chen, N. C., Zhang, X.,
et al. In-situ and triple-collocation based evaluations of eight
global root zone soil moisture products [J]. Remote Sensing of Environment, 2023, 254: 112248.
[4]
Tian, J., Zhang, Y. Q.
Comprehensive validation of seven root zone soil moisture products at 1153
ground sites across China [J]. International Journal of Digital Earth,
2023, 16(2): 4008–4022.
[5]
Tian, J. Root zone (0–100 cm)
soil moisture 0.25°/daily dataset over China (2018–2021) [J/DB/OL]. Digital Journal of Global Change Data Repository, 2025. https://doi.org/10.3974/geodb.2025.08.08.V1.
[6]
GCdataPR Editorial Office.
GCdataPR data sharing policy [OL]. https://doi.org/10.3974/dp.policy.2014.05
(Updated 2017).
[7]
Bell, B., Hersbach, H.,
Simmons, A., et al. The ERA5 global reanalysis: preliminary extension to
1950 [J]. Quarterly Journal of the Royal Meteorological Society, 2021,
147(741): 4186–4227.
[8]
Reichle, R. H., Draper, C. S.,
Liu, Q., et al. Assessment of MERRA-2 land surface hydrology estimates
[J]. Journal of Climate, 2017, 30(8): 2937–2960.
[9]
Saha, S., Moorthi, S., Wu, X.
R., et al. The NCEP climate forecast system version 2 [J]. Journal of
Climate, 2014, 27(6): 2185–2208.
[10]
Rodell, M., Houser, P. R.,
Jambor, U., et al. The global land data assimilation system [J]. Bulletin
of the American Meteorological Society, 2004, 85(3): 381–394.
[11]
Reichle, R. H., Liu, Q.,
Koster, R. D., et al. Version 4 of the SMAP Level-4 soil moisture
algorithm and data product [J]. Journal of Advances in Modeling Earth
Systems, 2019, 11(10): 3106–3130.
[12]
Tavella,
P., Premoli, A. Estimating the instabilities of N-Clocks by measuring
differences of their readings [J]. Metrologia, 1994, 30(5): 479-486.
[13]
Galindo, F. J., Palacio, J.
Estimating the instabilities of N correlated clocks [C]. In Proceedings of the
31th annual precise time and time interval systems and applications meeting.
1999, 285–296.