Toward
Demand-Driven Intelligent Perception Paradigm in Agricultural Remote Sensing:
From Data Acquisition to Precision Services
ZHANG Qingnian WANG Yiyao DENG Liqiong FU Hao SHI Qian LIU Mengxi
*
School of Geography and Planning, Sun Yat-sen
University, Guangzhou 510275, China
Abstract: With
the widespread application of satellite and unmanned aerial vehicle (UAV)
remote sensing platforms, agricultural remote sensing has entered an era of big
data. However, the “supply–demand mismatch” between data provision and
practical application requirements has become increasingly prominent, severely
hindering the maximization of data utility. This study has systematically
analyzed 3 core bottlenecks in the current application of agricultural remote
sensing data: spatiotemporal mismatch, semantic representation gap, and
redundant feature construction. To address these challenges, this paper
proposes a demand-driven intelligent perception paradigm for agricultural
remote sensing. Using the fine-scale monitoring of litchi as a typical case study, this study elaborates on the core
architecture and implementation pathways of this paradigm. Centered on the
demands of agricultural production applications, the paradigm revolves around 4
key elements (4K: Key Space, Key Time, Key Object, and Key Feature). Driven by
end-use requirements, it dynamically designs and iteratively optimizes remote
sensing observation strategies, thereby constructing a “Demand-Acquisition-Service-Feedback”
(DASF) closed-loop collaborative mechanism. Through continuous iterative
optimization of the perception strategy, full-process synergy from data
acquisition to information services is achieved. Furthermore, this study
analyzes the practical challenges faced by this paradigm, including the
accuracy of demand interpretation, multi-source collaborative scheduling, and
service-oriented transformation. Future development directions are forecasted,
including knowledge graph-driven automatic demand parsing, cloud-edge-end
collaborative intelligent acquisition systems, and the “Observation as a
Service” (OaaS) model, providing a novel theoretical framework and technical
pathway for the application of remote sensing technology in precision
agricultural management.
Keywords: agricultural remote sensing; intelligent perception;
demand-driven; phenological monitoring; space-air-ground integration
DOI: https://doi.org/10.3974/geodp.2026.04.02
1 Introduction and Challenges
With
the rapid advancement of Earth observation technologies, particularly the
widespread adoption of satellite remote sensing and unmanned aerial vehicle
(UAV) platforms, agricultural remote sensing has entered an era of big data[1–3]. Currently, thousands of satellites in orbit around the world are
continuously observing agricultural ecosystems on a large scale and at multiple
frequencies, generating massive data resources in various spectral bands,
including visible, infrared, and microwave[4–6]. Meanwhile, low-altitude remote sensing
technologies, such as UAVs, have scaled down the observation of farmland from a
regional scale to a field scale, significantly enhancing the spatial accuracy
and temporal flexibility of data acquisition[7,8]. The sustained improvement of
high-resolution Earth observation platforms is not only attributed to
advancements in satellite design and manufacturing technologies, but also to
the significant enhancement of data processing capabilities[9]. Despite the explosive growth in data
volume, the efficiency of converting these data into usable information for
agricultural management remains low, and massive amounts of data fail to
effectively support decision-making. Current agricultural remote sensing still
faces core problems at the data application level, including spatiotemporal
mismatch of remote sensing data, semantic representation gap, and redundant
feature construction. These issues intertwine and collectively constitute the
core issue of the “supply-demand mismatch” in agricultural remote sensing,
which hinders the practical application of remote sensing technology in
agricultural fine-scale management.
1.1 Spatiotemporal Data
Mismatch
Current
remote-sensing observations mostly adopt strategies of fixed time intervals or
maximum spatial coverage, which ignore the phased changes and spatial
heterogeneity characteristics of crop phenology, thus resulting in a
disconnection between data acquisition and actual needs. In the temporal
dimension, optical remote sensing is susceptible to interference from clouds,
resulting in a reduction of usable images and making it difficult to capture
the critical phenotypic monitoring stage of crops in a timely manner, which
affects the monitoring accuracy[10–12]. However, the limitations of
observation resolution are the main source of uncertainty in phenological
information extraction, making it challenging to accurately characterize the
growth differences within the fields[13,14].
The inherent limitations of different observation platforms further
exacerbate the spatiotemporal data mismatch. Although wide-swath,
high-frequency satellites (such as MODIS and VIIRS) can achieve near-daily
coverage, the problem of mixed pixels is prominent, hindering accurate
identification of the phenological characteristics of specific crops within
heterogeneous areas[15,16]. High-spatial-resolution satellites such as
WorldView and the Gaofen series can finely delineate field-level differences;
however, their long revisit cycles impede continuous monitoring of phenological
transition windows. Medium-resolution data such as Sentinel-2 and Landsat 8/9
offer a favorable balance of spatiotemporal resolution; however, they remain
constrained by temporal discontinuities caused by cloud cover[17,18]. UAVs, which are capable of acquiring
centimeter-level resolution imagery, are limited by the spatial extent of
single-flight coverage and the effective operational time window[19–21].
1.2 Semantic Representation
Gap
Currently,
there is a significant semantic gap between agricultural information provided
by remote sensing and the indicators required for production management, making
it difficult to convert data directly into a basis for production decisions.
For instance, most existing studies have focused on extracting general
phenological indicators, such as the start of the growing season and end of the
growing season, from vegetation index time series[22,23], or on a few key transitional stages,
such as the maturity stages[24]. These indicators are suitable for
large-scale vegetation dynamic monitoring; however, it is difficult to meet the
requirements of precise production management for specific crops and cannot
directly support decision- making for detailed field operations.
Taking the
fine-scale management of a litchi orchard as an example, the core premise is to
accurately determine the precise phenological stages, such as the white millete
appearance stage, female floral phase, and fruit expansion stage. This
determines the timing and specific plans for management measures, such as
fertilization, flower and fruit thinning, and pest and disease control[25]. However, owing to the limitations of the spatiotemporal resolution
of the data and insufficient dimensionality of the spectral information,
traditional remote sensing methods are unable to achieve precise identification
and differentiation of such fine phenological stages[26]. Even with the use of UAV platforms to
obtain more accurate phenological information, reliable methods for mapping
this information and actual management indicators remain underdeveloped, and
differences in the definitions and estimation standards of the same
agricultural indicator by different researchers have further exacerbated the
semantic gap problem[11,27], greatly restricting the
effectiveness of remote sensing technology in agricultural precision
production.
1.3 Redundant Feature
Construction
The rapid development of data storage technologies
has led to the emergence of high-dimensional and large-scale remote sensing
datasets; however, they contain a large amount of redundant information, making
it difficult to directly serve specific monitoring tasks. In practical
applications, feature construction is often guided by data accessibility, and a
large number of spectral, temporal, and texture features are indiscriminately
introduced, which not only increases data storage and computing costs but may
also introduce noise, leading to overfitting of the model, decreased
generalization ability, and reduced monitoring accuracy[28].
The requirements
for remote-sensing features vary significantly among crops and monitoring
tasks. The lack of a targeted feature selection mechanism further exacerbates
redundancy. In the study of corn monitoring, the REIP, CRI550, CRI700, and MSBI
indices performed the best, and the multi-feature combination effect was
superior to that of a single index[29]; in the monitoring of wheat, fAPAR,
fCover, EVI, PSRI, and NDVI are more suitable for crop growth management, while
ARI2, MCARI, and NDWI are more suitable for crop type identification[30]. From the perspective of task
differences, phenological period extraction may only require low-altitude,
high-resolution images from UAVs, whereas precise early disease identification
requires submeter-level hyperspectral data support[31,32]. Currently, agricultural remote
sensing lacks monitoring‑specific feature selection, causing a disconnect
between features and needs, and building up ineffective ones—raising processing
costs, lowering information density, and limiting data utility.
In summary, current
agricultural remote sensing suffers from a “supply-demand mismatch” in critical
links including data acquisition, semantic representation, and feature
construction. The traditional observation mode is oriented toward data
acquisition capabilities, resulting in an “data acquisition prior to practical
application” model. This leads to a significant supply-demand mismatch and
makes it difficult to fully leverage the core value of remote sensing data. In
order to address this issue, this paper has proposed a demand-driven
intelligent perception paradigm for agricultural remote sensing. Taking the
end-use application requirements of agricultural production as the starting
point, this paradigm leverages 4 key elements (4K: Key Space, Key Time, Key
Object, Key Feature) to guide the dynamic design of observation strategies and
construct an intelligent perception system that forms a closed-loop linkage
with agricultural decision-making. This approach facilitates the transition of
data acquisition from “passive acquisition” to application- oriented “active
intelligent perception”, thereby achieving full-process optimization from data
acquisition to information services.
2 Demand-Driven
Intelligent Perception Paradigm for Agricultural Remote Sensing
2.1 Connotation and Core Characteristics
The demand-driven intelligent perception paradigm
for agricultural remote sensing refers to a novel data acquisition model that
considers end-use application requirements as the starting point, and guides
the dynamic design of observation strategies. Unlike the traditional “data
acquisition prior to practical application” model, this paradigm emphasizes the
active traction effect of demands on acquisition: First, clearly define
specific monitoring targets and precision requirements, then specifically determine
the optimal observation time, spatial range, observation platform, and feature
combination, and finally, use the feedback of service effects to drive the
continuous iterative optimization of the acquisition strategy, achieving a
full-chain linkage of “demand defines the task, task guides acquisition,
acquisition supports services”, breaking the traditional gap between
acquisition and application (Figure 1).
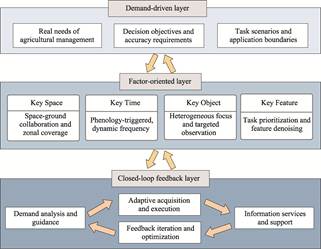
Figure 1 Demand-driven intelligent perception paradigm
for agricultural remote sensing
This paradigm has 3
core features that together constitute its key advantages over traditional
models. First, demand-driven. It takes the requirements of specific
agricultural management decisions (such as precise phenological identification,
early disease warning, and yield prediction)—rather than data availability—as
the starting point of the entire perception pipeline, thereby ensuring a high
degree of alignment between data acquisition and practical application. Second,
element-oriented. Through fine-grained analysis of the 4K elements, it achieves
precise allocation of acquisition resources, avoids ineffective data
collection, and improves data-utilization efficiency. Third, closed-loop
feedback. By leveraging the collaborative mechanism of “Demand-Acquisition-Service-Feedback”
(DASF), the perception strategy continuously iterates and optimizes in
practice, rather than being set statically once and then remaining unchanged.
It can respond flexibly to the dynamic complexity and uncertainty of
agricultural production.
From a broader
perspective, this paradigm is highly consistent with the overall trend in the
current field of Earth observation, which is shifting from “data-driven” to
“intelligent services”. The Asia-Oceania Group on Earth Observations (AOGEO)
clearly states that Earth observation systems should provide precise, efficient
services for high-quality regional development[9]. The demand-driven paradigm proposed in
this study is the specific implementation path for this transformation goal in
the agricultural fine-scale management scenario, providing a new concept and
theoretical support for the industrial application of agricultural remote
sensing technology.
2.2 Four Key Elements (4K)
Analysis
The
core architecture of the demand-driven paradigm consists of 4K that interact
with each other to form a precise definition framework for the acquisition
plan. This paper elaborates on the connotations and implementation paths of
each element based on a detailed monitoring case of litchi.
2.2.1 Partition-Guided Observation Based on Key Space
Agricultural
production space exhibits significant heterogeneity, with systematic
differences among plots in terms of soil conditions, crop variety distribution,
and field management practices[33,34]. Taking topography as an example,
sunny/shady slopes shift phenology by 5–10 d, slope gradient impacts drainage
and disease risk; yet traditional uniform sampling under‑samples key areas and
over‑samples others, wasting resources and failing precision monitoring.
Regarding the aforementioned issues, the core
strategy for the Key Spatial elements can be summarized as “first divide, then
collect”. The basis for this division should be directly linked to the
agronomic attributes of the crops, such as their phenology and growth status,
to ensure that the environmental conditions and growth responses within the
same division are highly consistent. For litchi flowering monitoring, DEM
derived aspect and slope guide intelligent orchard zoning: sunny slopes for
early flowering, shady for late, and low-lying areas for waterlogging
risk. Acquisition strategies vary—high frequency UAV flights focus on sunny
slopes to capture the white millete and female floral stages; shady slopes get
reduced frequency or delayed windows; waterlogged zones intensify disease
period monitoring. Medium resolution satellites (e.g.,
Sentinel 2) further detect macroscopic anomalies (e.g., growth aberrations,
disease patches) to refine zoning, directing UAVs to centimeter scale
observations in high value areas. This balances macroscopic coverage with
microscopic precision, enhancing data acquisition efficiency and targetedness[7,9].
2.2.2 Dynamic Triggering Acquisition Based on Key Time
Different
stages of crop growth have varying requirements for the frequency, accuracy,
and response timeliness of observations[35]. Taking the growth cycle of litchi as an
example, phenological transition periods, such as the white millete appearance
stage, female floral phase, and fruit expansion stage, are the most intense
periods of phenotypic change and the most critical windows for implementing
field management measures[25]. However, these transition periods are
short and exhibit rapid changes in growth dynamics, which require extremely
high observation timeliness. Traditional fixed-interval observations tend to
overlook such opportunities[26]. Moreover, unexpected events such as
meteorological disasters (e.g., low temperatures and drought), pest and disease
outbreaks, and abnormal growth also constitute Key Time windows that require
intensified observations.
Therefore, the Key
Time elements abandon the fixed acquisition rhythm of “equal time intervals”,
and instead focus on the crop growth requirements to achieve on-demand
acquisition and precise action[10,12]. For litchi, the white millete
stage is a critical window for flower-spike quality, pruning, and pest
control—missing it reduces yield and quality. A phenology-based Key Time
strategy deploys daily acquisition during this stage, weekly during stable
periods, reducing redundant data. It also integrates weather forecasts (e.g.,
cold waves, drought) and remote-sensing anomalies (e.g., sudden NDVI drops) to
auto-trigger intensified observations. This approach precisely captures
phenological transitions and sudden risks, providing timely data for field
management decisions.
2.2.3 Precise Target Selection Based on Key Objects
Within
the same crop category, plants of different varieties, ages, cultivation
methods, and growth conditions exhibit significant differences in the selection
of observation objects and requirements for the accuracy of information
extraction. Traditional observations often consider the crop category (such as
litchi) as a unified observation object, ignoring these fine-grained
differences, which makes it difficult for the collected data to adapt to the
requirements of precise management[36–38].
Therefore, the Key
Object elements abandon the “one-size-fits-all” observation approach and refine
the observation objects from general land cover type to specific varieties,
tree ages, growth conditions, etc., ensuring that the collected data closely match
the management requirements. In the monitoring of litchi, the acquisition
objects need to be precisely selected based on specific management goals. When
estimating yield, priority should be given to mature trees with strong
fruit-bearing capacity as the core acquisition objects, and the number and size
information of fruits in the fruit-bearing canopy should be focused on when
monitoring diseases. Plants with weak growth, low resistance, and dense
planting areas should be given priority attention. Early disease spots and
abnormal leaf conditions should be accurately captured when evaluating growth.
Different varieties, tree ages, and growth vigor of plants should be taken into
account, and the nutritional status data of the canopy should be comprehensively
collected. In addition, the Key Object strategy can be adjusted based on the
spatiotemporal dynamics. For example, in flower identification, different
varieties’ flower spike morphological differences should be modeled separately,
and in fruit maturity monitoring, priority acquisition should be set for early-
and late-maturing varieties in different zones. This precise target selection
based on Key Object can enhance the degree of matching between data and
management requirements, providing precise targeted data support for fine-scale
management.
2.2.4 Optimal Parameter Configuration Based on the Key Features
Feature
selection is a core part of remote sensing data applications and a key step in
improving the monitoring accuracy of the model. High-quality feature extraction
relies on the support of advanced models. These models achieve precise
conversion of remote sensing data into agricultural indicators by learning Key
Features. Without targeting, stacking many remote‑sensing parameters dilutes
key information, hindering model focus on core phenological drivers, thus
reducing sensitivity to critical stages and boundary resolution.
To address these
aforementioned issues, the Key Feature elements require configuring optimal
parameters based on task requirements, avoiding redundant stacking of
ineffective features[28,30]. Taking litchi monitoring as an
example, the selection of satellite observation features focused on the
correlation between macrotemporal sequences and spectral responses. In the
early disease identification task, the red-edge-related bands were found to be
more sensitive to abnormalities in leaf chlorophyll, and hyperspectral imaging
data were helpful for capturing spectral changes in the early stage of the disease[29]. The UAV observation platform can obtain ultrahigh spatial
resolution images, and its feature extraction strategy focuses on the precise
identification and analysis of the microscopic details of the plants. For
example, the monitoring of winter shoots length requires an extremely high
spatial resolution, reaching 0.01 cm/pixel[39]; while the fine classification of fruit
maturity, obtaining a spatial resolution of 0.19–0.25 cm/pixel at a flight
height of 6 m can meet the requirements[40]. In contrast, the extraction of tree
crown structure parameters (such as perimeter and projection coverage) only
requires a centimeter-level spatial resolution (such as 4.1 cm/pixel
corresponding to a height of 30 m), and different resolutions have consistency
in the measurement results of parameters such as tree crown width[41]. This indicates that for different
monitoring tasks, the optimal spatial resolution must be configured according
to the target feature scale to avoid the blind pursuit of an excessively high
resolution that leads to data redundancy. This method of optimal parameter
selection based on Key Features can ensure the precise matching of remote
sensing features with actual business needs and achieve the efficient
conversion of remote sensing data into management decision information.
2.3 Closed-Loop Collaborative
Mechanism Based on Service Feedback
These 4K elements establish a strategic framework
for a single acquisition task; however, the static design of the 4K framework
alone is insufficient to cope with the dynamic complexity of agricultural
production. The other core mechanism of the demand-driven paradigm lies in
constructing a closed-loop collaborative DASF mechanism to achieve adaptive
iterative optimization of the perception strategy and ensure that the paradigm
can dynamically adapt to the changing demands of agricultural production. This
closed-loop consists of 4 stages: First, the demand analysis stage, which
converts users’ agricultural management goals (such as phenological period
monitoring, yield estimation) into operational 4K acquisition parameters,
clarifying the observation time, space, objects, and features, and forming an
initial acquisition plan; Second, the acquisition execution stage, which
obtains satellite data as needed based on the parameters and plans the UAV
flight route; Third, the service output stage, which preprocesses, extracts
features, and makes model inferences on the collected raw data, generating
phenological information products (such as monitoring reports, prediction
results) for the decision-making; Fourth, the feedback optimization stage,
which collects on-site verification results and user evaluations, assesses the
deviation of the current acquisition strategy (such as phenological period
prediction deviation, unreasonable feature selection, etc.), and accordingly
adjusts the 4K parameter configuration for the next round to achieve iterative
optimization of the acquisition strategy.
The key to this
closed-loop mechanism lies in adaptive iteration. Each observation and feedback
regarding services is a correction to the acquisition strategy, enabling each
observation to be closer to the actual demand than the previous observation. In
the litchi monitoring scenario, if the prediction of the first white millete
appearance stage is too early, the feedback mechanism can automatically adjust
the phenological prediction parameters; in the next growing season, the start
time of high-frequency acquisition can be corrected; and if the estimation
error of the yield in a specific variety area is too large, a special feature
selection and model re-training for that variety can be triggered. This
“Acquisition- Learning-Re-acquisition” adaptive cycle enables the system to
gradually improve the perception accuracy over time, forming a positive cycle
of “demand-driven acquisition, acquisition supporting services, and services
optimize acquisition”, continuously enhancing the practicality and adaptability
of the paradigm.
3 Discussion and
Conclusion
To resolve the profound contradiction between the
“explosion of data volume and the inefficiency of decision support” in the era
of agricultural remote sensing big data, this paper has systematically proposed
and elucidated a demand-driven intelligent perception paradigm for agricultural
remote sensing. With the core objective of addressing the “supply-demand
mismatch” problem in traditional agricultural remote sensing, and through an
in-depth case analysis of precision monitoring across the full phenological
lifecycle of litchi, this paradigm achieves source-level control over the 4
core elements of “Space, Time, Object, and Feature”. This alleviates the
problems of spatiotemporal data mismatch, semantic discontinuity, and feature
redundancy inherent in traditional coarse-grained acquisition, thereby
enhancing the utilization efficiency and value realization capability of remote
sensing data.
The proposed
paradigm successfully breaks the traditional linear observation model of “data
acquisition prior to practical application” and establishes a self-adaptive
closed-loop collaborative mechanism of DASF. It realizes a fundamental shift in
agricultural remote sensing from “passive acquisition” to “active sensing”,
providing a novel theoretical framework and implementation pathway for the
transition of agricultural remote sensing from data supply to intelligent
services. With the deep integration of a low-altitude economy, edge
intelligence, and large language models, the demand-driven paradigm will
progressively mature and become a core engine for future smart agricultural
infrastructure. This will help establish a space-air-ground integrated intelligent
sensing network and provide solid technical support for precise agricultural
management, food security, and the green and high-quality development of
agriculture.
However, several
practical challenges remain during its deployment, primarily in 3 aspects:
demand interpretation, multiplatform coordination, and service-oriented
transformation.
3.1 Challenges
3.1.1 Insufficient Precision in Acquiring Demand Interpretations
The
primary prerequisite of the demand-driven paradigm is to accurately comprehend
and formalize the agricultural management demands of users and subsequently
translate them into actionable 4K acquisition parameters. Nevertheless, in
practice, user-expressed demands are often vague and domain-oriented. For
example, farmers may ask, “Should I spray pesticides on litchi trees now?”
rather than issuing a specific instruction such as “Monitor canopy spectral
anomalies to identify early pest-induced stress”. There is a lack of clear
one-to-one correspondence between the precise phenological stages and yield
targets on which production managers focus and the spectral features and
structural parameters observable by remote sensing, creating a cross-layer gap
between the “demand description” and “technical parameters”.
Currently,
cross-layer mapping relies heavily on manual intervention by domain experts and
lacks automated and standardized parsing tools and methodologies. Experts must
leverage their experience to convert vague user demands into concrete
acquisition parameters. This process is not only inefficient but also prone to
subjective variances among different experts, making it difficult to guarantee
the consistency and precision of demand parsing while simultaneously
restricting the large-scale promotion of this paradigm. Therefore, constructing
a reliable “demand-parameter” mapping mechanism to achieve automated parsing
and quantitative transformation of vague demands stands as the primary
challenge to the engineering implementation of this paradigm, as well as a
critical breakthrough for improving its practicality.
3.1.2 High Complexity of Coordinating Multi-Source Collaborative Acquisition
The
demand-driven paradigm requires multiple platforms, such as satellites, UAVs,
and ground-based sensors, to coordinate and operate collaboratively in
real-time based on dynamic demands. However, significant differences among
these platforms in terms of communication protocols, task formats, and
operational entities have led to high technical barriers to multi-source
collaborative scheduling. Particularly, during critical phenological transition
periods of crops, rapid responses and simultaneous acquisition by multiple
platforms are required. Under such scenarios, real-time task coordination among
platforms is prone to conflicts and delays, affecting the timeliness of data
acquisition, and thereby constraining the quality of monitoring services.
Although
international cooperative frameworks such as AOGEO have promoted institutional
development for data sharing and collaborative observation, real-time
scheduling protocols and interface standards across different agencies and
platforms remain immature, and a unified collaborative scheduling architecture
is still lacking, limiting the large-scale realization of multi-source
collaborative sensing capabilities[42]. At the national level, the rapid
expansion of commercial remote sensing satellite constellations while
increasing data acquisition density also imposes higher management requirements
for multi-source data fusion and collaborative scheduling. Consequently,
breaking through the technical and institutional barriers of multiplatform
collaborative scheduling to achieve efficient integration and dynamic
allocation of multi-source observation resources serves as a vital pillar for
the implementation of this paradigm.
3.1.3 Technical and Application Barriers to Service-Oriented
Transformation
The
demand-driven paradigm aims to transition from “data supply” to “intelligent
services”, enabling users to obtain high-level semantic information and
decision support without having to process raw remote sensing data. However,
this service-oriented transformation faces several challenges. At the technical
level, the chain from high-precision data products to agricultural management
decisions is long and involves multiple links such as data processing, model
inversion, product generation, and user interface design. Currently, certain
links suffer from inadequate automation and the coordination between them is
inefficient, making it difficult for data processing and product generation to
meet the demands of large-scale, rapid responses. At the user level, most
agricultural producers lack professional backgrounds in remote sensing and
geographic information systems, and their information technology foundations
are relatively weak. This makes it difficult for them to interpret complex data
products and translate them into field management actions, creating a
“last-mile” barrier to service deployment and thereby constraining the
extension of the demand-driven paradigm from research to practice. Moreover, a
commercial model for agricultural remote-sensing services still remains
unclear. The costs of acquiring and processing high-resolution remote-sensing
data are high, whereas the overall profit margin in agriculture is relatively
low, and farmers have limited willingness and ability to pay[9]. Striking a balance between technical
advancement, economic feasibility, and user acceptance to construct a
sustainable commercial closed-loop is a realistic challenge that must be
addressed for the large-scale application of this paradigm.
3.2 Future Directions
To
address the three major challenges associated with the implementation of the
current demand-driven paradigm, and considering the development trends of
cutting-edge technologies such as the low-altitude economy, edge intelligence,
large language models, and knowledge graphs, the paradigm will continue to
evolve toward “intelligent, collaborative, and service-oriented” systems.
Future efforts will focus on the following 3 directions to propel engineering
implementation and large-scale application of the paradigm, thereby further
unlocking the value of agricultural remote sensing data.
3.2.1 Knowledge Graph-Driven Automatic Demand Interpretation
In
order to address the challenge of insufficient precision in demand parsing, a
viable technical pathway is to construct an agricultural remote sensing
knowledge graph that explicitly structures the mapping relationships between
crop phenology, monitoring task types, and acquisition parameter
configurations. Such knowledge graphs can integrate multi-source information,
including crop physiological characteristics, historical monitoring data, and
domain expert experience, thereby transforming expert knowledge into
machine-readable inference rules. This enables automated inference from natural
language demand descriptions to 4K parameters, substantially reducing the
reliance on manual intervention[43]. For instance, when a user submits a
request for “litchi flowering stage early warning”, the knowledge graph can
automatically parse out the trigger conditions (historical phenological
windows), key spatial boundaries (coordinates of core producing areas),
recommended observation frequency (daily during critical periods), and optimal
characteristic spectral bands (red edge and near-infrared). It then outputs a
standardized acquisition task order without
requiring the user to possess specialized knowledge. Furthermore, the
integration of large language models with domain-specific knowledge graphs is
expected to enable nonexpert users to rapidly generate complex acquisition
demands through natural language interactions. This democratizes agricultural
remote-sensing knowledge and significantly lowers barriers to adopting
this paradigm.
3.2.2 Cloud-Edge-End Collaborative Intelligent Acquisition System
Leveraging
the powerful computing capacity of the cloud and the real-time inference
capabilities of the edge, constructing an integrated scheduling system
characterized by “cloud planning, edge inferring, and terminal executing”
represents a critical pathway to overcoming multi-source coordination
challenges. Within this architecture, cloud platforms are responsible for
integrating multi-source information, such as satellite orbit predictions,
weather forecasts, and phenological models, to perform global planning of
cross-platform resource scheduling and optimize the collaborative workflow
between satellites and UAVs. The edge (onboard UAVs or ground stations) is
responsible for receiving real-time scheduling commands from the cloud and
dynamically adjusting tasks based on local environmental perceptions (e.g.,
real-time weather and terrain changes), ensuring the flexibility and timeliness
of acquisition tasks. Terminal sensors execute specific acquisition actions and
upload raw data in real-time[5,6]. This Cloud-Edge-End collaboration can
markedly improve the scheduling response speed, support large-scale,
multiplatform collaborative operations, and enable rapid replanning under
dynamically changing external conditions. Driven by the advancement of low-altitude
economic policies and the maturation of UAV swarm technologies, multi-UAV
coordination and autonomous task allocation are poised to achieve breakthroughs
in large-scale monitoring scenarios, paving the way for the scalable
application of intelligent agricultural remote-sensing acquisition, while
further enhancing the efficiency and precision of multi-source collaborative
acquisition.
3.2.3 Implementation and Promotion of the OaaS
Model
Translating
technological breakthroughs into industrial deployment requires innovations in
service models. OaaS encapsulates the demand-driven
sensing paradigm into standardized, accessible, and invocable service
interfaces, serving as the core pathway to drive service-oriented
transformation. Under the OaaS model, users are only
required to submit their monitoring objectives and geographic boundaries. The
system then automatically completes the entire workflow, including 4K parameter
interpretation, multiplatform acquisition planning, data processing, model
inference, and result delivery. This model eliminates the need for users to
possess a professional background in remote sensing, truly achieving the shift
of agricultural remote sensing from “data supply” to “intelligent service” and
breaking down the “last-mile” barrier to service deployment. In the future,
integrating OaaS with multi-source information
services, such as meteorological forecasts and agricultural product prices,
will further amplify its comprehensive value for agricultural decision support.
This will form a complete service chain of “sensing-analysis-decision- execution”,
promoting the widespread adoption of the paradigm across various agricultural
scenarios and providing core support for the development of smart agriculture.
Author Contributions
Zhang, Q. N., Wang, Y. Y., and Deng, L. Q. conducted the
literature review, summarized relevant research progress, and
drafted the initial manuscript. Fu, H. completed the data acquisition
and processing work. Shi, Q. and Liu, M. X. contributed to the
overall conceptual design, structural optimization, and critical revision and
polishing of the paper.
Conflicts of Interest
The
authors declare no conflicts of interest.
References
[1] de Mauro, A., Greco, M., Grimaldi, M. A
formal definition of big data based on its essential features [J]. Library
Review, 2016, 65(3): 122–135.
[2] Wolfert,
S., Ge, L., Verdouw, C., et al. Big data in
smart farming—a review [J]. Agricultural Systems, 2017, 153: 69–80.
[3] Chen, M.,
Mao, S., Liu, Y. Big data: a survey [J]. Mobile Networks and Applications,
2014, 19(2): 171–209.
[4] Rosenqvist,
Å., Milne, A., Lucas, R., et al. A review of remote sensing technology
in support of the Kyoto Protocol [J]. Environmental Science &
Policy, 2003, 6(5): 441–455.
[5] Liu, P. A
survey of remote-sensing big data [J]. Frontiers in Environmental Science,
2015, 3.
[6] Chi, M.,
Plaza, A., Benediktsson, J. A., et al. Big data
for remote sensing: challenges and opportunities [J]. Proceedings of the
IEEE, 2016, 104(11): 2207–2219.
[7] Huang,
Y., Thomson, S. J., Hoffmann, W. C., et al. Development and prospect of
unmanned aerial vehicle technologies for agricultural production management
[J]. International Journal of Agricultural and Biological Engineering,
2013, 6(3): 1–10.
[8] Sebastian,
C., Fabio, R., Michaela, D. G., et al. Evaluating multispectral images
and vegetation indices for precision farming applications from UAV images [J]. Remote
Sensing, 2015, 7(4): 4026–4047.
[9] Wu, J. J., Li, M.,
Liang, L., et al. Progress of
high-resolution Earth observation systems [J]. Journal of Global Change Data & Discovery, 2024, 8(4):
347–355. https://doi.org/10.3974/geodp.2024.04.02.
[10] Walker, J. J., de Beurs, K. M., Wynne, R. H. Dryland
vegetation phenology across an elevation gradient in Arizona, USA, investigated
with fused MODIS and Landsat data [J]. Remote Sensing of Environment,
2014, 144: 85–97.
[11] Zheng, Y., Wu, B.,
Zhang, M., et al. Crop phenology detection using high spatio-temporal
resolution data fused from SPOT5 and MODIS products [J]. Sensors, 2016,
16(12): 2099.
[12] Gao, F., Anderson,
M. C., Zhang, X., et al. Toward mapping crop progress at field scales
through fusion of Landsat and MODIS imagery [J]. Remote Sensing of
Environment, 2017, 188: 9–25.
[13] Zhang, X., Friedl,
M. A., Schaaf, C. B. Sensitivity of vegetation phenology detection to the
temporal resolution of satellite data [J]. International Journal of Remote
Sensing, 2009, 30(8): 2061–2074.
[14] Guan, K., Medvigy,
D., Wood, E. F., et al. Deriving vegetation phenological time and
trajectory information over Africa using SEVIRI daily LAI [J]. IEEE
Transactions on Geoscience and Remote Sensing, 2014, 52(2): 1113–1130.
[15] Zhang, X., Wang, J.,
Gao, F., et al. Exploration of scaling effects on coarse resolution land
surface phenology [J]. Remote Sensing of Environment, 2017, 190:
318–330.
[16] Vrieling, A.,
Skidmore, A. K., Wang, T., et al. Spatially detailed retrievals of
spring phenology from single-season high-resolution image time series [J]. International
Journal of Applied Earth Observation and Geoinformation, 2017, 59: 19–30.
[17] Zhu, Z., Wang, S.,
Woodcock, C. E. Improvement and expansion of the Fmask algorithm: cloud, cloud
shadow, and snow detection for Landsats 4–7, 8, and Sentinel 2 images [J]. Remote
Sensing of Environment, 2015, 159: 269–277.
[18] Novelli, A.,
Aguilar, M. A., Nemmaoui, A., et al. Performance evaluation of object based greenhouse detection from Sentinel-2 MSI and
Landsat 8 OLI data: a case study from Almería (Spain) [J]. International
Journal of Applied Earth Observation and Geoinformation, 2016, 52: 403–411.
[19] Hassanalian, M.,
Abdelkefi, A. Design, manufacturing, and flight testing of a fixed wing micro
air vehicle with Zimmerman planform [J]. Meccanica, 2017, 52(6):
1265–1282.
[20] Nhamo, L., van Dijk,
R., Magidi, J., et al. Improving the accuracy of remotely sensed
irrigated areas using post-classification enhancement through UAV capability
[J]. Remote Sensing, 2018, 10(5): 712.
[21] Agrawal, J., Arafat,
M. Y. Transforming farming: a review of AI-powered UAV technologies in
precision agriculture [J]. Drones, 2024, 8(11): 664.
[22] Reed, B. C., Brown, J. F., VanderZee, D., et al.
Measuring phenological variability from satellite imagery [J]. Journal
of Vegetation Science, 1994, 5(5): 703–714.
[23] de Beurs, K. M.,
Henebry, G. M. Spatio-Temporal Statistical Methods for Modelling Land Surface Phenology
[M]. Dordrecht: Springer Netherlands, 2010: 177–208.
[24] Zhang, X., Friedl,
M. A., Schaaf, C. B., et al. Monitoring vegetation phenology using MODIS
[J]. Remote Sensing of Environment, 2003, 84(3): 471–475.
[25] Wei, Y. Z., Zhang,
H. N., Li, W. C., et al. Phenological growth stages of lychee (Litchi
chinensis Sonn.) using the extended BBCH-scale [J]. Scientia
Horticulturae, 2013, 161: 273–277.
[26] Zeng, L., Wardlow,
B. D., Xiang, D., et al. A review of vegetation phenological metrics
extraction using time-series, multispectral satellite data [J]. Remote
Sensing of Environment, 2020, 237: 111511.
[27] Lu, L., Wang, C.,
Guo, H., et al. Detecting winter wheat phenology with SPOT-VEGETATION
data in the North China Plain [J]. Geocarto International, 2014, 29(3):
244–255.
[28] Liu, G., Jiang, X. G., Tang, B. H. Application of
feature optimization and convolutional neural network in crop classification
[J]. Journal of Geo-Information Science, 2021, 23(6): 1071–1081.
[29] Sonobe, R., Yamaya,
Y., Tani, H., et al. Crop classification from Sentinel-2-derived
vegetation indices using ensemble learning [J]. Journal of Applied Remote
Sensing, 2018, 12: 1.
[30] Vidican, R.,
Mălinaș, A., Ranta, O., et al. Using remote sensing vegetation indices
for the discrimination and monitoring of agricultural crops: a critical review
[J]. Agronomy, 2023, 13(12): 3040.
[31] Kuswidiyanto, L. W.,
Noh, H., Han, X. Plant disease diagnosis using deep learning based on aerial
hyperspectral images: a review [J]. Remote Sensing, 2022, 14(23): 6031.
[32] Moghadam, P., Ward, D., Goan, E., et al.
Plant disease detection using hyperspectral imaging: international conference on digital
image computing: techniques and applications (DICTA) [C]. Sydney, 2017.
[33] Araya, S.,
Ostendorf, B., Lyle, G., et al. Remote sensing derived phenological
metrics to assess the spatio-temporal crop yield variability [J]. Advances
in Remote Sensing, 2017, 6: 212–228.
[34] Kousar, R., Lone, A.
H., Shah, Z. A., et al. Farm-scale soil spatial variability at a
mountain research centre in Northwestern Himalayas [J]. Scientific Reports,
2025, 15(1): 19705.
[35] Potgieter, A. B.,
Zhao, Y., Zarco-Tejada, P. J., et al. Evolution and application of
digital technologies to predict crop type and crop phenology in agriculture
[J]. in silico Plants, 2021.
[36] Zhu, Y., Yang, G.,
Yang, H., et al. Identification of apple orchard planting year based on
spatiotemporally fused satellite images and clustering analysis of foliage
phenophase [J]. Remote Sensing, 2020, 12(7): 1199.
[37] Mahlayeye, M., Darvishzadeh, R., Nelson, A.
Cropping patterns of annual crops: a remote sensing review [J]. Remote
Sensing, 2022, 14(10): 2404.
[38] Ozdarici-Ok, A., Ok,
A. O. Using remote sensing to identify individual tree species in orchards: a
review [J]. Scientia Horticulturae, 2023, 321: 112333.
[39] Liang, C., Liu, D.,
Ge, W., et al. Detection of litchi fruit maturity states based on
unmanned aerial vehicle remote sensing and improved YOLOv8 model [J]. Frontiers
in Plant Science, 2025, 16.
[40] Shen, Z., Liu, B.,
Xu, R., et al. Evaluation of lychee winter shoot length using UAV remote
sensing technology [J]. International Journal of Agricultural and Biological
Engineering, 2025, 18(6): 241–249.
[41] Johansen, K.,
Raharjo, T., McCabe, M. Using multi-spectral UAV imagery to extract tree crop
structural properties and assess pruning effects [J]. Remote Sensing,
2018, 10: 854.
[42] Wu, J. J., Huang, Z. R., Liu, J. L., et al.
Progress of the Asia-Oceania Group on Earth Observations (AOGEO) Programme [J].
Journal of Global Change Data & Discovery, 2024, 8(4):
366–375. https://doi.org/10.3974/geodp.2024.04.04.
[43] Qin, Q. M. AlphaEarth Foundations: the potential and
challenges of remote sensing foundation models [J]. Journal of Geo-Information
Science, 2025, 27(10): 2283–2290.