Methodology of the Dataset Development of the Crop Planting
Structure for Changji Prefecture, Xinjiang (2020‒2024)
YU Lingxiang WANG Xiaoqin* ZHANG Hongyu LIU Hongwei
The Academy of Digital China (Fujian),
Fuzhou University, Fuzhou 350108, China
Abstract: Crop planting structure is a vital indicator
reflecting regional agricultural cultivation patterns and serves as a crucial
foundation for agricultural resource monitoring, food security assessment, and
refined cropland management. Changji Prefecture in Xinjiang, as an important
agricultural production base in China, is characterized by diverse cropping
patterns and abundant crop varieties. This dataset focuses on Changji
Prefecture, Xinjiang—a typical irrigated agricultural region—and integrates
time-series Sentinel-2 optical and Sentinel-1 radar data to develop a crop
classification model (Multi-source Spatial-Temporal-Phenological Integration,
MSTPI), from which the Changji Prefecture crop planting structure dataset (2020–2024)
was derived. The data reveals the impact of the expansion of cash crops on
ecological irrigation areas, in the context of water resource red-line
policies, providing a benchmark for sustainable agricultural policy assessment
in arid regions and supporting food security analysis in Central Asia along the
Belt and Road Initiative. The dataset has a spatial resolution of 10 m and
temporal resolution of 1 year, documenting the crop planting structure of
Changji Prefecture, Xinjiang from 2020 to 2024. The dataset consists of 4 files
with a total data volume of 245 MB (97.8 MB compressed).
Keywords: cropping
structure; crop classification; MSTPI model; multi-source remote sensing
features
DOI: https://doi.org/10.3974/geodp.2026.02.09
Dataset Availability Statement:
The
dataset supporting this paper was published and is accessible through the Digital
Journal of Global Change Data Repository at: https://doi.org/10.3974/geodb.2025.10.01.V1.
1 Introduction
Crop
planting structure is a fundamental aspect of agricultural geography and
sustainable development research, involving the spatial combination, layout and
proportions of different crop types in a specific region[1]. It
reflects the spatial distribution and combination patterns of major crop types
and their spatial distribution characteristics in a specific region or
agricultural unit, which not only reflects the diversity of crop types but also
reveals their distribution pattern in geospatial space, and is an important
basis for understanding the regional differences in agricultural activities and
guiding agricultural management decisions[2]. Existing planting
structure datasets mainly focuses on the extraction of planting structure over
a small area, fewer crop types or a single inter-annual period, e.g., Guo, et
al.[3] constructed a high-precision remote sensing
classification dataset of cash crops (apple, kiwifruit, etc.) in Yangling
Demonstration Area with a spatial resolution of 2 m and an overall classification
accuracy of 86.17%, which provides data support for the monitoring of orchards
in Guanzhong Plain and the research of related algorithms. Zhang, et al.[4] used Sentinel-2 and
Google Earth to construct a 10-m resolution planting structure fine mapping
dataset of 8 types of crops (rice, maize, etc.) in 2020 in Ningxia’s Huangyang
Irrigation District. Zhao, et al.[5] constructed a 10-m resolution
dataset of 8 types of crops (rice, maize, etc.) in 2018–2022 in the Loess
Plateau based on the Sentinel-2 image. You, et al.[6] used
Sentinel-2 images to generate a 10-m resolution maize, rice, and soybean
planting distribution map in Northeast China from 2017 to 2019 with an overall
accuracy of ≥81%, soybean planting distribution maps with an overall accuracy
of 0.81–0.86, which can support regional food security monitoring.
As an important agricultural production base in China, Changji
Hui Autonomous Prefecture (hereinafter referred to as “Changji Prefecture”) in
Xinjiang has a diverse agricultural cropping structure with a wide variety of
crops, and most of them are planted in a large-scale and continuous manner,
making the region suitable for plot-level crop classification. To accurately
extract the plot-scale crop information in this region, it is necessary to
fully synthesize the spatial, temporal, and climatic characteristics of remote
sensing images. Among them, crop phenology characteristics can be captured by
time series remote sensing data, which helps to distinguish different crop
types. Multi-source remote sensing data fusion technology shows unique
advantages in this process, for example, SAR remote sensing has the ability of
all-weather observation, which can effectively overcome the limitations of
optical remote sensing under cloudy and foggy conditions and provide stable and
continuous observation data[7,8]. In addition, the Time-Weighted
Dynamic Time Warping (TWDTW) algorithm has been widely used and achieved good
results in the identification of temporal features in the crop phenology cycle[9,10].
In terms of spatial feature extraction, SegFormer, a semantic segmentation
model based on the Transformer structure, has been preliminarily applied to the
remote sensing crop classification task, which shows a large potential for
application[11,12].
Therefore, this paper utilizes multi-source
medium-resolution time-series optical remote sensing and SAR remote sensing
data, integrates the advantages of spatial, temporal and crop phenology
features, constructs a plot-scale oriented multi-temporal and spatial phenology
feature fusion crop classification model, and extracts the crop planting
structure dataset for the period of 2020–2024, with a spatial resolution of 10 m,
using Changji Prefecture of Xinjiang as the study area. The time span is 5
years, aiming to provide scientific basis and decision support for precision
agriculture practice and sustainable development of regional agriculture.
2 Metadata of the Dataset
The metadata of A plot-level cropping structure dataset
based on Sentinel images and phenology information in Changji Prefecture,
Xinjiang Uygur Autonomous Region of China (2020–2024)[13]is
summarized in Table 1. It includes the dataset full name, short name, authors,
year of the dataset, temporal resolution, spatial resolution, data format, data
size, data files, data publisher, and data sharing policy, etc.
Table 1 Metadata summary of A plot-level cropping
structure dataset based on Sentinel images and phenology information in Changji
Prefecture, Xinjiang Uygur Autonomous Region of China (2020‒2024)
|
Items
|
Description
|
|
Dataset
full name
|
A
plot-level cropping structure dataset based on Sentinel images and phenology
information in Changji Prefecture, Xinjiang Uygur Autonomous Region of China
(2020–2024)
|
|
Dataset
short name
|
PLOTS_CRSP_XJ2020_24
|
|
Authors
|
Yu, L. X., The Academy
of Digital China (Fujian), Fuzhou University, 245527021@fzu.edu.cn
|
|
|
Wang, X. Q., The
Academy of Digital China (Fujian), Fuzhou University, wangxq@fzu.edu.cn
Zhang, H. Y., The
Academy of Digital China (Fujian), Fuzhou University, 892169168@qq.com
Liu, H, W., The Academy
of Digital China (Fujian), Fuzhou University, 235527039@fzu.edu.cn
|
|
Geographical
region
|
Changji
Hui Autonomous Prefecture, Xinjiang Uygur Autonomous Region, China
|
|
Year
|
2020–2024
|
|
Temporal
resolution
|
Year
|
|
Spatial
resolution
|
10
m
|
|
Data
format
|
.tif,
.txt
|
|
|
|
Data
size
|
97.8
MB (after compression)
|
|
|
|
Data
files
|
Plot-level
cropping structure dataset in Changji Prefecture (2020–2024)
|
|
Foundation
|
Department
of Science and Technology in Fujian (2023I0007)
|
|
Data
publisher
|
Global Change Research Data Publishing &
Repository, http://www.geodoi.ac.cn
|
|
Address
|
No.
11A, Datun Road, Chaoyang District, Beijing 100101, China
|
|
Data
sharing policy
|
(1)
Data are openly available and can
be free downloaded via the Internet; (2) End users are encouraged to use Data subject to citation; (3) Users,
who are by definition also value-added service providers, are welcome to
redistribute Data subject to
written permission from the GCdataPR Editorial Office and the issuance of a Data redistribution license; and (4)
If Data are used to compile new
datasets, the “ten percent principal” should be followed such that Data records utilized should not
surpass 10% of the new dataset contents, while sources should be clearly
noted in suitable places in the new dataset[14]
|
|
Communication and searchable system
|
DOI, CSTR, Crossref, DCI, CSCD, CNKI,
SciEngine, WDS, GEOSS, PubScholar, CKRSC
|
3 Methods
This
dataset is based on Sentinel-2 time-series optical imagery and Sentinel-1 SAR
data from 2020‒2024 provided by Google Earth Engine (GEE). By
integrating the advantages of spatial, temporal, and crop phenological
information with a parcel-scale multi-spatial-temporal-phenological feature
fusion crop classification model (MSTPI), crop classification and planting
structure extraction were conducted for Changji Prefecture, Xinjiang.
Subsequently, field survey data collected by the research team in Changji
Prefecture, Xinjiang in July 2024 were utilized for accuracy validation of the
2024 results.
3.1 Study Area
The study area is Changji Prefecture located in northern
Xinjiang Uygur Autonomous Region, China. It is situated between the northern
piedmont of the Tianshan Mountains and the southeastern margin of the Junggar
Basin, with geographical coordinates ranging from 43°20ʹN to 45°00ʹN and
85°17ʹE to 91°32ʹE. The prefecture is divided into eastern and western sections
by Urumqi City. The terrain is characterized by higher elevations in the south
and lower elevations in the north, with a temperate continental arid climate.
Cropland is primarily distributed in the alluvial plain
areas within the region, where agricultural production is dominated by
irrigated agriculture. Major crops include cotton, wheat, maize, tomato, beet,
pepper, edible seed watermelon, and seed gourd. The typical phenological
information for these crops is presented in Table 2, providing phenological
parameters for subsequent time-series remote sensing classification.
Table 2 Phenological stages
and key temporal windows for major crops
|
Crop
|
Phenological information
|
|
Cotton
|
Sown in April; buds in June; flowers in July; bolls open August–October;
growth ends late October
|
|
Wheat
|
Winter wheat: sown in September–October; regreens in March after overwintering;
heads in May; matures in June–July
Spring wheat: sown in March–April; heads in May–June; matures in July–August
|
|
Maize
|
Sown in April; enters jointing stage in June; tassels in late
July; matures in early September
|
|
Tomato
|
Seedlings raised in greenhouses in March; transplanted in late
April to early May; fruit formation begins in June; matures gradually in
August
|
|
Beet
|
Sown in April; enters vigorous growth in June; root enlargement
and sugar accumulation in mid-September; matures in late October
|
|
Edible seed watermelon
|
Sown from late April to early May; flowers in mid-June; matures
from mid-August to early September
|
|
Chili pepper
|
Seeded in March; transplanted in April–May; fruiting begins in
July; harvested from August to October depending on variety and cultivation
conditions
|
|
Seed gourd
|
Sown in April; rapid growth in June; leaves yellow by late July;
matures and harvested in September
|
3.2 Algorithm
The classification model employed in this dataset is a
two-branch crop classification model (MSTPI), consisting of a TWDTW branch and
a SegFormer branch, which integrates the classification results through a
rule-driven plot-level weighted fusion module to achieve high-precision
plot-level crop identification for extracting cropping structures. Figure 1
shows the MSTPI model framework.
(1)
TWDTW branch
The
DTW algorithm[15] is a method used to measure the similarity of 2
time series by allowing nonlinear distortions on the time axis to find the
optimal matching paths, and to achieve sequence alignment even if there are
differences in time scales. TWDTW is an algorithm improved by the DTW
algorithm, based on which the temporal weighting mechanism is introduced, which
further enhances the reasonableness of the matching and the classification
accuracy.
(2)
SegFormer branch
SegFormer
is a lightweight semantic segmentation architecture designed under the
Transformer architecture, which adopts a hierarchical encoder + MLP decoder
design without positional coding, and takes into account multi-scale feature
extraction and efficient reasoning, and realizes high-precision segmentation in
multiple scenarios. It is capable of strong context modeling and multi-scale
feature fusion in remote sensing image processing, and can accurately capture
spatial texture and structural features in remote sensing images.
(3) Rule-driven plot-level weighted fusion
The rule-driven plot-level weighted fusion
integrates multi-source remote sensing crop classification results, with plots
serving as the basic unit; then rules are formulated based on the image
confidence, plot features and neighborhood consistency to compute the
image-plot-level weights; finally, multi-source labels are fused with weights
within the plots to output a high-precision crop structure map of the plots,
which is significantly better than that of the image-level method.
3.3 Synergistic Mechanism of Crop Classification Based
on MSTPI Model
The technical route for
generating the 2020–2024 crop planting structure dataset of Xinjiang Changji
Prefecture using the MSTPI model is shown in Figure 2. Firstly, Sentinel-2
true-color
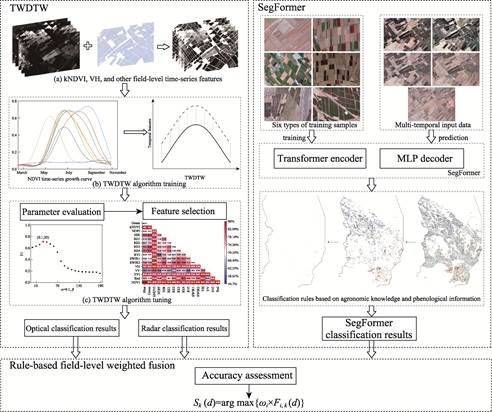
Figure 1 Schematic
framework of the MSTPI model
images were used
to automatically extract farmland plot boundaries in the CLCFormer model to
form a plot-level spatial unit base. Then the Sentinel-2 multi-temporal image
is combined with crop phenology features to construct a multi-temporal
phenology knowledge classification framework, label the samples, and use the
SegFormer model to generate preliminary crop classification results. The
optical and radar remote sensing data are then integrated to construct an
optical-radar temporal feature database, and the TWDTW algorithm is applied to
optimize the temporal weight parameters to find the optimal feature combination
with kNDVI and VH. Then the multi-temporal RGB imagery, radar time series and
optical time series are fused to generate classification results by SegFormer
and TWDTW dual branching, respectively, and finally crop classification mapping
is completed based on the rule-driven weighted fusion method at the plot level
to complete the extraction of planting structure for crop classification of
consecutive years from 2020 to 2024.
(1) Farmland plot information extraction
Long, et al.[16] proposed
the cross-learning network CLCFormer, which effectively integrates the
advantages of Convolutional Neural Network (CNN) and Transformer to realize the
effective fusion of spatial detail features of the image with the long-range
contextual features. This dataset utilizes the model to extract parcel data and
carry out classification with parcel-scale mean features. The parcel samples
are manually labeled based on Sentinel-2 true-color images, combined with data
enhancement and the introduction of samples from Denmark, the Netherlands, and
Korla, Xinjiang, to improve the model generalization ability. The extraction
process adopts a county-by-county strategy, using the previous corrected
samples to continuously optimize the extraction accuracy.
The preliminary extraction results are
post-processed by morphological processing, image quality optimization
(denoising and hole filling), boundary smoothing of the Douglas-Pooke algorithm
and manual refinement, etc., and ultimately obtain complete and clear-bordered
farmland parcel data within the scope of Changji Prefecture.
(2) Multi-temporal primary
classification and sample construction
Using agricultural
knowledge and crop phenology information, 5 Sentinel-2 images from June to
October 2022 were selected to construct 6 typical color training sample sets,
which are: class A (gray and white), class B (yellow and brown), class C (dark
green), class D (green), class E (light green), and class F (red). The
classification weights corresponding to each color category are obtained by
training 6 sets of SegFormer sub-models. The time-series sample set of 396
plots (8 crop categories + bare ground) was constructed with Hutubi County as a
typical district in 2022, and the growth curve extract weather characteristics
were fitted by the GAM (Generalized Additive Model). Finally, cross validation
was performed with the results of field survey in 2024. samples from other
regions in 2020–2023 were obtained through stratified sampling.
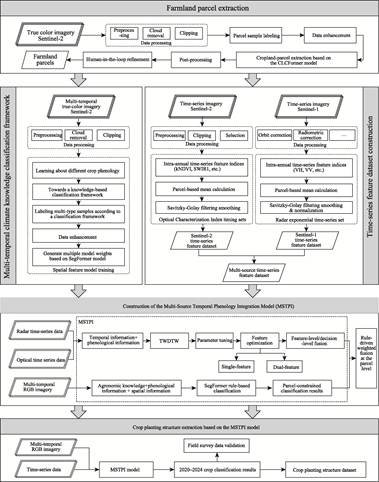
Figure 2 Flowchart
of the dataset development
(3) Dual-branch synergistic classification
and rule-driven weighted fusion at the plot level
Crop classification was performed in the
SegFormer branch and the TWDTW branch using the constructed samples described
above.
In the SegFormer branch a classification
scheme is developed based on the typical climatic characteristics of different
crops by using the 6 categories of color training samples divided earlier,
specifying the required time phases and corresponding weight settings.
Subsequently, for a specific crop, the images of the corresponding month are
selected according to the scheme, and the weights of the specified categories
are applied to perform binary classification, so as to obtain multi-temporal
crop-background binary classification results, and the classification accuracy
is further improved by screening the stable features through the superposition
of multi-temporal phases.
In the TWDTW branch, the 2 feature
combinations of VH and kNDVI are selected as the classification features, and
the similarity between the plots and the standard growth curves is calculated
by using the TWDTW algorithm based on the temporal feature dataset constructed
above to realize crop classification.
Finally, the results of the above 2
branches are subjected to rule-driven plot-level weighted fusion based on the
specific process of calculating the F1 scores of the outputs of SegFormer and
TWDTW on each crop category in terms of plots, and then assigning weights for
fusion on this basis.
(4) Accuracy validation
By combining the 2024 fieldwork data for
accuracy evaluation, this dataset uses Overall Accuracy (OA) and F1 scores as
the core indexes to comprehensively measure the model's classification effect
and generalization ability in complex agricultural regions.
4 Data Results and Validation
4.1 Dataset Composition
The
dataset includes crop planting structure data for Changji Prefecture, Xinjiang
spanning from 2020 to 2024, including annual crop spatial distribution data
with a spatial resolution of 10 m in raster format, archived as .tif and .txt
files.
4.2 Data Results Analysis
The crop cultivation structure of Xinjiang Changji
Prefecture in 2020–2024 was extracted, primarily the 8 types of crops with the
largest cultivation area, which were cotton, wheat, maize, tomato, beet, edible
seed watermelon, pepper, and seed gourd, as well as the 2 types of cultivated
land, namely other cultivated land and bare land. Its crop distribution map is
shown in Figure 3. The regional characteristics of crop spatial distribution in
Changji Prefecture are clearly evident, with wheat and corn dominating in the
east, cotton dominating in the west, and cash crops interspersed in the
south-central part of the state, which is overall consistent with the planting
layout of “western cotton, eastern grain, and central gourds and vegetable”[17].
Among the various crops accounted for as shown in Figure 4, it can be
seen that cotton, wheat and maize are the main crops in Changji Prefecture, of
which cotton has the largest planted area, wheat and maize are the second
largest, and there is not much difference between the two planted areas. The
remaining five crops are planted on a smaller area. Among these five cash
crops, edible seed watermelon has the largest
acreage, tomato and pepper have similar acreage due to crop rotation
requirements, and beet has the smallest acreage.
Table 3 shows the statistics of crop
cultivation area in Xinjiang Changji Prefecture from 2020 to 2024. Among them,
the overall trend of the planted area of wheat and maize is decreasing, with
the area of wheat decreasing from 1,241.32 km2 in 2020 to 827.36 km2
in 2024; and the area of maize decreasing from 1,233.90 km2 in 2020
to 713.27 km2 in 2024. The area planted with cash crops such as
tomato, beet, edible seed watermelon and pepper fluctuates considerably, of
which tomato and edible seed watermelon declines
after a significant increase in 2022; beet planting is small and fluctuates in
a limited way; and the area planted with pepper reaches a high in 2021 and then
declines gradually. The planted
Figure 3 Distribution maps
of crops in Changi Prefecture (2020–2024)
|
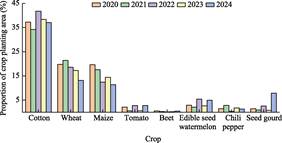
Figure 4 Statistics of the proportion of
planting area for major crops in Changi Prefecture (2020–2024)
|
area
of seed gourd increases significantly to 495.32 km2 in 2024, which
is significantly higher than the previous level.
4.3 Data Validation
For accuracy validation, this dataset employs field survey
data collected by authors in Changji Prefecture in July 2024 (Table 4), with
sample distribution conforming to the proportions of cultivated areas for each
crop in the extraction results (cotton being the most abundant, followed by
wheat and maize). The spatial distribution of field survey sites is shown in
Figure 5. A total of 2,821 sampling points were established along predetermined
routes during the field survey, covering the entire territory of Changji
Prefecture. These data were primarily used to validate the reliability of the
MSTPI model classification results and the 2024 crop classification outcomes.
The results demonstrate that the MSTPI model achieved relatively stable
classification performance across all areas of Changji Prefecture, with an
average overall accuracy (OA) of 86.24% and an average F1 score of 85.10%.
Table 3 Statistical table on the area planted
with major crops in Changji Prefecture Unit: km2
|
Crops
|
2020
|
2021
|
2022
|
2023
|
2024
|
|
Cotton
|
2,336.72
|
2,148.97
|
2,622.02
|
2,408.07
|
2,325.74
|
|
Wheat
|
1,241.32
|
1,346.13
|
1,164.78
|
1,083.93
|
827.36
|
|
Maize
|
1,233.90
|
1,103.18
|
781.54
|
907.62
|
713.27
|
|
Tomato
|
133.48
|
37.78
|
175.88
|
36.59
|
172.83
|
|
Beet
|
32.61
|
17.88
|
9.52
|
12.97
|
28.53
|
|
Edible seed watermelon
|
180.95
|
133.10
|
341.11
|
164.88
|
311.01
|
|
Chili pepper
|
89.93
|
177.22
|
25.85
|
111.82
|
84.26
|
|
Seed gourd
|
90.95
|
57.45
|
161.42
|
52.21
|
495.32
|
Table 4 Distribution of field
validation samples in Changji Prefecture (2024)
|
|
Cotton
|
Wheat
|
Edible
seed watermelon
|
Maize
|
Tomato
|
Seed
gourd
|
Chili pepper
|
Beet
|
Other
|
Bare
ground
|
|
Number
|
869
|
460
|
125
|
670
|
173
|
195
|
33
|
38
|
202
|
56
|
In addition, this
dataset’s accuracy was validated through comparison with publicly available
remote sensing data products, specifically through consistency assessment using
publicly released remote sensing classification products for cotton, maize, and
winter wheat in the Xinjiang region.
The cotton data
were derived from the 10-m resolution classification results (2020– 2021)
released by Kang, et al.[18], the maize data were selected
from the Xinjiang subset of Peng, et al.[19] 30-m resolution
for maize in China, and the winter wheat data were selected from Yang, et al.[20]
10-m resolution data products. The maize and wheat data were obtained through
the National Ecological Science Data Center, with the maize data spanning
2020–2023[21] and the winter wheat data covering 2020–2024[22].
The results showed that the consistency of cotton classification was more than
83% during 2020–2021 in all cases; the average consistency of maize
classification was 75.81% during 2020–2023, with the highest value (81.17%)
reached in 2022; and the consistency of winter wheat classification remained stable at 90% during 2020–2024. The consistency of
winter wheat classification between 2020 and 2024 stably stays above 90%. This
indicates that the accuracy of this dataset is good.
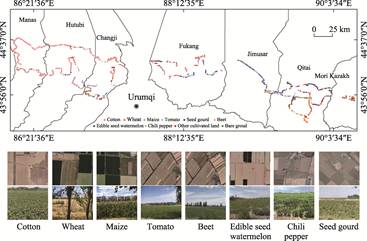
Figure 5 Distribution map of the field
survey sites in Changji Prefecture (2024)
5 Discussion and Conclusion
Annual large-scale, multi-crop planting structure data play
a crucial role in regional agricultural development, optimal allocation of
water resources, and regulation of “non- grain” cropland use. However, planting
structure data for the Xinjiang region remains limited, particularly annual
large-scale multi-crop data on planting structure. Based on multi-source
time-series Sentinel-1/2 remote sensing imagery and parcel-scale cropland
extraction, this study proposes the MSTPI crop classification model that integrates
spatial- temporal and phenological features, achieving the extraction of
parcel-level crop planting structure for Changji Prefecture, Xinjiang from 2020
to 2024 and analyzing its characteristics.
The
dataset features a spatial resolution of 10 m and a temporal resolution of 1
year, providing comprehensive coverage of Changji Prefecture, Xinjiang. It
provides crucial support for water resource control and allocation, planting
structure optimization, and desertification prevention in Changji Prefecture,
Xinjiang, while also offering scientific evidence for assessing sustainable
development goals and ecological conservation.
Although
this dataset provides relatively comprehensive data support, several challenges
were encountered during its construction: (1) Imbalanced category distribution
in sample collection, with particular difficulty in obtaining samples for minor
crops such as beet; (2) Constraints imposed by the 10-m spatial resolution,
uncertainty exists in the delineation of fragmented parcel boundaries; (3) Temporal
discontinuity issues in optical remote sensing data due to cloud cover affect
the completeness of data during critical growth stages; (4) Limitations in the
spatial-temporal coverage of samples make it difficult to comprehensively
reflect crop phenological variations under different conditions; (5) Labeling
consistency in collaborative multi-person annotation requires improvement,
particularly for crops with similar phenological characteristics.
Author Contributions
Wang, X. Q. designed the algorithms of dataset. Yu,
L. X., Zhang, H. Y., Liu, H. W. collected and processed the remote sensing data
and field survey data. Zhang, H. Y. designed the models and algorithms. Yu, L.
X. contributed to the data validation and wrote the data paper.
Conflicts of Interest
The authors declare no conflicts of interest.
References
[1]
Sun, B. X., Yang, J. J., Fu, R. X., et al.
Progress in remote sensing identification of crop planting structure [J]. Science and Technology Innovation and Application, 2023, 13(15): 76‒79.
[2]
Tang, H. J., Wu, W.
B., Yang, P., et al. Progress in remote sensing monitoring of crop spatial pattern [J]. Chinese Agricultural Science, 2010,
43(14): 2879‒2888.
[3]
Guo, J., Bai, J. Y., Ye, Y. K.,
et al. Multi-source and multi-temporal remote sensing dataset of cash
crop cropping structure in Yangling Agricultural Demonstration Area [J]. China
Science Data (Chinese-English Network Edition), 2023, 8(2):334‒343.
[4]
Zhang, D. Y., Wu, T. J., Luo, J. C., et
al. Spatio-temporal cooperative remote sensing
mapping of agricultural cropping structure [J]. Journal of Remote Sensing,
2024, 28(8): 2014‒2029.
[5]
Zhao, X. N., Wang, J. C., Ding,
Y. L., et al. High-resolution (10 m) dataset of multi-crop planting
structure on the Loess Plateau during 2018–2022 [J]. Scientific Data,
2025, 12: 123. DOI: 10.1038/s41597-025-05529-0.
[6]
You,
N. S., Dong, J. W., Huang, J. X., et al. The 10-m crop type maps in
Northeast China during 2017–2019 [J]. Scientific
Data, 2021, 8: 41. DOI: 10.1038/s41597-021-00827-9.
[7]
Orynbaikyzy, A., Gessner, U.,
Conrad, C. Crop type classification using a combination of optical and radar
remote sensing data: a review [J]. International Journal of Remote Sensing,
2019, 40(17): 6553‒6595.
[8]
Woźniak, E., Rybicki, M.,
Kofman, W., et al. Multi-temporal phenological indices derived from time
series Sentinel-1 images to country-wide crop classification [J]. International
Journal of Applied Earth Observation and Geoinformation, 2022, 107: 102683.
[9]
Maus, V., Câmara, G., Cartaxo,
R., et al. A time-weighted dynamic time warping method for land-use and
land-cover mapping [J]. IEEE Journal of Selected Topics in Applied Earth
Observations and Remote Sensing, 2016, 9(8): 3729‒3739.
[10]
Wang, L. M., Jin, G. W., Xiong, X., et al. Remote sensing mapping method for winter wheat in arable land in
finely fragmented agricultural areas [J]. Journal of Agricultural
Engineering, 2022, 38(22): 190‒198.
[11]
Chen, Y. Q., Wang, X. X.
Farmland extraction from UAV remote sensing images based on improved SegFormer model
[J]. Journal of the Indian Society of Remote Sensing, 2024: 1‒13.
[12]
Zhang, H. Y., Lin, X. Y., Long,
J., et al. SegFormer-based cotton planting areas extraction from high-resolution
remote sensing images [C]//2023 11th International Conference on
Agro-Geoinformatics (Agro-Geoinformatics). IEEE, 2023: 1‒6.
[13]
Yu,
L. X., Wang, X. Q., Zhang, H. Y., et al. A plot-level cropping structure
dataset based on Sentinel images and phenology information in Changji
Prefecture, Xinjiang Uygur Autonomous Region of China (2020–2024) [J/DB/OL]. Digital
Journal of Global Change Data Repository, 2025. https://doi.org/10.3974/geodb.2025.10.01.V1.
[14]
GCdataPR Editorial Office.
GCdataPR data sharing policy [OL]. https://doi.org/10.3974/dp.policy.2014.05
(Updated 2017).
[15]
Sakoe, H., Chiba, S. Dynamic
programming algorithm optimization for spoken word recognition [J]. IEEE
transactions on acoustics, speech, and signal processing, 1978,
26(1): 43‒49.
[16] Long, J., Li, M. M., Wang, X. Q. Integrating spatial details with
long-range contexts for semantic segmentation of very high-resolution
remote-sensing images [J]. IEEE Geoscience and Remote Sensing Letters,
2023, 20: 1‒5.
[17]
Agriculture and Rural Affairs
Bureau of Changji Hui Autonomous Prefecture. Official Reply to the CPPCC
Proposal No. 64 (Economic Development Category) of Changji Hui Autonomous
Prefecture [EB/OL]. (2024-05-09) [2025-10-06].
https://www.cj.gov.cn/p126/zxta/20240509/246810.html.
[18] Kang, X. Y., Huang, C. P., Chen, J. M., et al. The 10-m cotton maps in Xinjiang, China
during 2018–2021 [J]. Scientific Data, 2023,
10(1): 688. DOI: 10.1038/s41597-023-02597-5.
[19] Peng, Q. Y., Shen, R. Q., Li, X. Q., et al. A twenty-year
dataset of high-resolution maize distribution in China [J]. Scientific Data,
2023, 10(1): 658. DOI: 10.1038/s41597-023-02461-6.
[20] Yang, G. X., Li, X. R., Liu, P. Z., et al. Automated
in-season mapping of winter wheat in China with training data generation and
model transfer [J]. ISPRS Journal of Photogrammetry and Remote Sensing,
2023, 202: 422‒438.
[21]
Peng, Q. Y., Shen, R. Q., Liu,
Y. J., et al. A dataset of maize phenology in China from 2001 to 2020
[DS/ OL]. National Ecological Science Data Center, 2024. DOI:
10.12199/nesdc.ecodb.rs.2023.012.
[22]
Cheng, T., Yang, G. X. Winter
wheat identification dataset at 10-m spatial resolution in China, 2018‒2024
[DS/OL]. National Ecological Science Data Center, 2024. DOI:
10.12199/nesdc.ecodb.rs.2023.016.