Dataset Development of Population Exposure to Extreme
Heatwaves in China (2000, 2010, 2020)
NONG Kaisen1, 2
WANG Minghao1, 2
HUANG Yaobang1, 2 SUN
Wenhao3
CHU Mingruo3*
1. College of Urban and
Environmental Sciences, Peking University, Beijing 100871, China;
2. Center for Urban Future
Research, Peking University, Beijing 100871, China;
3. Institute of Geographic Sciences and Natural Resources
Research, Chinese Academy of Sciences, Beijing 100101, China
Abstract: To address the
spatial scale mismatch between meteorological raster products and socioeconomic
data aggregated by administrative units, this study integrates MERRA-2
reanalysis data with multi-source census data to develop the Dataset of
population exposure to extreme heatwaves in China (2000, 2010, 2020). Using
daily maximum temperature data from 1990 to 2022 as the climatological
baseline, the dataset identifies heatwave events based on a criterion combining
both relative and absolute thresholds, and separately calculates 3 indicators:
heatwave frequency, heatwave duration, and cumulative heat intensity. To
enhance the robustness of the decadal representation, national censuses data of
2000, 2010, and 2020 are used total population constraints, while
high-resolution population raster data from WorldPop are incorporated to
represent spatial population distributions. Through population weighting and
regional statistical aggregation, gridded heatwave indicators are mapped onto
367 administrative units across mainland China. In addition, a 5-year moving
average window is applied to derive total population exposure indicators for
the three representative years. Accuracy assessments demonstrate a very high
level of consistency (R2>0.97)
between the MERRA-2 data and observations from more than 2,400 meteorological
stations nationwide. Furthermore, cross-validation across 35 major cities shows that the Root Mean Square Error
(RMSE) of population exposure to heatwave frequency generated by this dataset,
compared with in situ station measurements, is only 0.89 occurrences.
This result confirms the reliability of the dataset after administrative aggregation
and temporal reconstruction. The dataset is archived in .xlsx and .shp formats
and consisting of 9 data files with a total size of 27.1 MB (17.8 MB
compressed).
Keywords: severe heatwave; population exposure; MERRA-2; climate
risk
DOI: https://doi.org/10.3974/geodp.2026.02.07
Dataset Availability Statement:
The dataset
supporting this paper was published and is accessible through the Digital Journal of
Global Change Data Repository at: https://doi.org/10.3974/geodb.2025.12.08.V1.
1 Introduction
Against
the macro backdrop of intensifying global climate change, the frequency,
intensity, and duration of extreme heat events have shown a significant
increasing trend, making them one of the primary natural hazards threatening
human health and constraining sustainable socioeconomic development[1].
In particular, during China’s rapid urbanization process, the high
concentration of populations in urban agglomerations and the rapid expansion of
impervious surfaces have significantly intensified the urban heat island
effect. The combined impacts of climate warming and accelerated urbanization
have exposed China’s urban systems to unprecedented risks of heatwave exposure[2,3].
Although
multiple high-temperature datasets based on satellite remote sensing retrievals
or meteorological station interpolations have been released by the academic
community, existing data products still face several challenges when applied to
climate risk management and socioeconomic impact assessments. Previous datasets
have primarily focused on characterizing temperature intensity at the physical
level, often neglecting the quantification of exposure that is closely linked
to population distribution. As a result, it remains difficult to accurately
assess the actual impacts of extreme heat on human-social systems[4].
Meanwhile, significant data format barriers and scale mismatches exist between
the high-resolution raster formats commonly used for meteorological data and
the vector-based administrative units relied upon for disaster early warning,
medical resource allocation, and socioeconomic statistics (e.g., GDP, mortality
rates). This spatial incompatibility not only requires complex regional
statistical analyses and spatial aggregation in interdisciplinary
research—thereby raising the technical threshold for data processing and
increasing the likelihood of calculation
errors—but also fails to directly support the administrative division-based
decision- making needs of government agencies. Furthermore, large-scale climate
drivers such as the El Niño-Southern Oscillation (ENSO) can introduce
substantial interannual variability[5]. As a result, data from a
single year often contain considerable random perturbations, making it
difficult to robustly reflect long-term decadal trends in climate evolution[6].
Addressing these
critical research gaps, this study integrates multi-source meteorological
monitoring data and long-term census data to develop the Dataset of population exposure
to extreme heatwaves in China (2000, 2010, 2020), using 367 administrative
units in the mainland of China (including direct-administered municipalities,
prefecture-level cities, prefectures, and province-administered counties) as
the fundamental spatial units of analysis. The dataset establishes a rigorous
data production framework through dual optimization in both spatial and
temporal dimensions. In the spatial dimension, an administrative unit-based
approach is adopted to map continuous meteorological raster variables onto
prefecture-level administrative polygons. This approach bridges the gap
between natural science data and social science statistics, enabling the
seamless integration of meteorological variables with various statistical
yearbooks through unified administrative codes (City IDs). In the temporal
dimension, to filter out interannual climate variability and more accurately
capture long-term trends, the study moves beyond the traditional single-year
snapshot method. Instead, a 5-year moving average window (1998–2002, 2008–2012,
and 2018–2022, respectively) is applied to generate representative values for 3
key temporal nodes: 2000, 2010, and 2020.
Based on the
methodologies described above, this dataset systematically incorporates both
hazard factors and their corresponding population exposure risk indicators
across 3 dimensions: Heatwave Frequency (HWF), Heatwave Duration (HWD), and
Cumulative Heatwave (HeatCum). By providing a vectorized dataset characterized
by clearly defined administrative units, robust temporal representation, and
comprehensive multidimensional indicators, this study aims to offer
scientifically grounded, accessible, and highly usable fundamental data to
support regional climate adaptation planning, the formulation of urban disaster
risk reduction strategies, and the optimization of public health policies.
2 Metadata of the Dataset
The
metadata for the Dataset of population exposure to extreme heatwaves in China
(2000, 2010, 2020)[7]
are summarized in Table 1. The metadata include
the full dataset name, short name, authors, reference years, temporal
resolution, data format, data size, file composition, data publisher, and data
sharing policy.
Table 1 Metadata summary of the Dataset of population exposure to extreme
heatwaves in China (2000, 2010, 2020)
|
Items
|
Description
|
|
Dataset full name
|
Dataset of population exposure to extreme
heatwaves in China (2000, 2010, 2020)
|
|
Dataset short name
|
EHW_PE_China_2000-2020
|
|
Authors
|
Nong, K. S., College of Urban and
Environmental Sciences, Peking University, ksnong25@ stu.pku.edu.cn
Wang, M. H., College of Urban and
Environmental Sciences, Peking University, minghaowang25@stu.pku.edu.cn
Huang, Y. B., College of Urban and
Environmental Sciences, Peking University, hyb2570953383@stu.pku.edu.cn
Sun, W. H., Institute of Geographic
Sciences and Natural Resources Research, Chinese Academy of Sciences, sunwenhao2518@igsnrr.ac.cn
Chu, M. R., Institute of Geographic
Sciences and Natural Resources Research, Chinese Academy of Sciences, chumingruo0227@igsnrr.ac.cn
|
|
Geographical region
|
367 municipal-level units in the mainland of
China (excluding Hong Kong, Macau, and Taiwan due to data unavailability)
|
|
Year
|
2000/2010/2020
|
|
Temporal resolution
|
Year
|
|
Data format
|
.xlsx, .shp
|
|
|
|
Data size
|
27.1 MB
|
|
|
|
Data files
|
Population exposure to heatwave frequency,
population exposure to heatwave duration, and population exposure to
cumulative heat, among other related indicators, at three key time points
(2000, 2010, and 2020).
|
|
Computing environment
|
Python
|
|
Data publisher
|
Global Change
Research Data Publishing & Repository, http://www.geodoi.ac.cn
|
|
Address
|
No. 11A, Datun Road, Chaoyang District,
Beijing 100101, China
|
|
Data sharing policy
|
(1) Data are openly available and
can be free downloaded via the Internet; (2) End users are encouraged to use Data
subject to citation; (3) Users, who are by definition also value-added
service providers, are welcome to redistribute Data subject to
written permission from the GCdataPR Editorial Office and the issuance of a Data
redistribution license; and (4) If Data are used to compile new
datasets, the “ten percent principal” should be followed such that Data
records utilized should not surpass 10% of the new dataset contents, while
sources should be clearly noted in suitable places in the new dataset[8]
|
|
Communication and
searchable system
|
DOI, CSTR, Crossref, DCI, CSCD, CNKI,
SciEngine, WDS, GEOSS, PubScholar, CKRSC
|
3 Methods
3.1 Data Sources
The
meteorological data used to construct this dataset are derived from the MERRA-2
(Modern-Era Retrospective analysis for Research and Applications, Version 2)
reanalysis dataset released by the National Aeronautics and Space
Administration (NASA), from this dataset, the daily maximum temperature (Tmax)
variable for the period 1990–2022 is extracted.
Owing to its strong spatiotemporal continuity, MERRA-2 effectively compensates
for the spatial coverage limitations of ground-based meteorological
observations[9]. To ensure the reliability and applicability of the
reanalysis data within China, this study incorporates concurrent observational
records from more than 2,400 national-level meteorological stations operated by
the China Meteorological Administration
as ground-truth data.
The population
data processing adopts a strategy that integrates gridded population data with
census statistics. The spatial distribution baseline is derived from the 100-m
resolution population grids of the WorldPop dataset,
which characterize population spatial agglomeration patterns using a random
forest algorithm[10]. To ensure the reliability and authority of the
population baseline, the total population counts are strictly calibrated using
county-level statistics from the 2000 (5th), 2010 (6th), and 2020 (7th)
National Population Censuses
published by the National Bureau of Statistics of China. The spatial basemap is
based on the 2020 standard national
prefecture-level administrative boundary vector dataset,
which encompasses 367 administrative units across the mainland of China. All
spatial data are projected into the Albers Equal-Area Conic coordinate system
to ensure the accuracy of geometric calculations.
3.2 Algorithm
(1)
Definition and identification of heatwave events and metrics
Heatwave events
are identified using a method that combines both relative and absolute
temperature thresholds[11]. In this study, heatwave days and
heatwave events are detected at the grid scale based on daily maximum
temperature (Tmax). To ensure comparability across different
climate zones and to capture seasonal variations, relative thresholds are
constructed by calendar day using the baseline period of 1990–2022. For each
grid cell i and calendar day d, a 15-day moving window [d−7,d+7] is applied to pool multi-year Tmax samples within
the baseline period. The 90th percentile of this sample set, denoted as P90i,d is then calculated as the relative threshold for that specific
calendar day. Subsequently, within the target year series, a day t is
classified as a candidate heatwave day when the following conditions are
satisfied: Tmax (i,t)>P90i,d(t)
and Tmax (i,t)>32 ℃[12], and the day falls within the warm-season months (May to September
in the Northern Hemisphere). A heatwave event is defined as a sequence of at
least 3 consecutive candidate heatwave day[13], only days belonging
to an identified heatwave event are included in the heatwave statistics. Isolated
high-temperature occurrences with a duration of fewer than 3 days are excluded
from both event and duration calculations[14].
Based on the
definitions, this study calculates heatwave characteristic metrics at the grid
scale across 3 dimensions: 1) Annual Heatwave Frequency (HWF), defined as the
total number of heatwave events occurring within a given year. 2) Annual
Heatwave Duration (HWD), defined as the total number of days associated with
all heatwave events within a year. 3) Annual Cumulative Heat (HeatCum), defined
as the accumulated temperature exceedance above the relative threshold during
heatwave days. The calculation of cumulative heat is expressed as follows:
 (1)
(1)
Where HWdays(i,t) denotes the set of all dates belonging to heatwave events for grid
cell i in
year
y, and t represents a specific day within this set (t ∈ HWdays(i,t)).  represents the
daily maximum temperature for grid cell
represents the
daily maximum temperature for grid cell  on day
  , and
, and  denotes the
90th-percentile threshold corresponding to the calendar day
denotes the
90th-percentile threshold corresponding to the calendar day  .
.
(2) Calculation
of population-weighted heatwave characteristics
To address the
scale mismatch between meteorological grids and administrative units, regional
zonal statistics and population-weighting algorithms are employed to perform
spatial aggregation and mapping[3]. By aggregating the gridded
heatwave metrics to the prefecture-level administrative scale and using the
WorldPop gridded population as weights, the population-weighted heatwave
indicator for prefecture-level city c in year y is calculated as
follows:
 (2)
(2)
Where  denotes the total
population (in 104 persons) of all grid cells within prefecture-level city c in
year y;
denotes the total
population (in 104 persons) of all grid cells within prefecture-level city c in
year y;  represents the
population (in 104 persons) of grid cell i within that prefecture-level city; and
HWi,y∈{HWFi,y,
HWDi,y,
represents the
population (in 104 persons) of grid cell i within that prefecture-level city; and
HWi,y∈{HWFi,y,
HWDi,y,
HeatCumi,y},
represents the specific heatwave metric for each grid cell, corresponding to
annual heatwave frequency, total heatwave duration (in days), and cumulative
heat exposure, respectively. The resulting HWc,y
characterizes the population weighted average level of heatwave frequency,
duration, and cumulative heat exposure experienced by resident within
administrative unit c.
(3) Calculation
of population heatwave exposure for typical years
To reduce
interannual variability caused by large-scale climate drivers such as ENSO and
to more robustly capture decadal climate trends, this study moves beyond the
conventional single-year snapshot method and instead applied a 5-year moving
average window for temporal reconstruction[5]. Specifically, the
years 2000 (1998–2002), 2010 (2008–2012), and 2020 (2018–2022) are selected as
central reference points. For each window period, the arithmetic mean of the
three heatwaves metrics described above is calculated to generate baseline
heatwave indicators representing the typical climate characteristics of the
corresponding decades.
 (3)
(3)
Where
T denotes the selected reference years, namely 2000, 2010, and 2020. The
smoothed heatwave indicator for the typical year  is then
multiplied by the census population
is then
multiplied by the census population  of each
administrative unit to derive the population heatwave exposure indicators:
of each
administrative unit to derive the population heatwave exposure indicators:

 (4)
(4)

Where
 ,
,  and
and  represent
population exposure to heatwave frequency (million person-events), population
exposure to heatwave duration (million person-days), and population exposure to
cumulative heat load (million person-℃), respectively. The overall technical
workflow for the dataset construction is illustrated in Figure 1.
represent
population exposure to heatwave frequency (million person-events), population
exposure to heatwave duration (million person-days), and population exposure to
cumulative heat load (million person-℃), respectively. The overall technical
workflow for the dataset construction is illustrated in Figure 1.
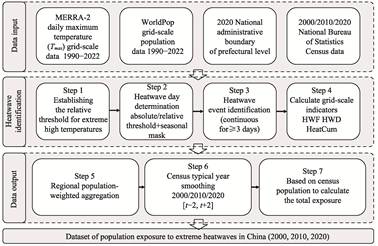
Figure 1 Flowchart
of the dataset development
4 Data Results and Validation
4.1 Dataset Composition
This
dataset comprises 3 main components: (1) a list of 367 prefecture-level administrative
units; (2) statistical tables reporting population exposure to heatwave
frequency, heatwave duration, and cumulative heat load for the three typical
years of 2000, 2010, and 2020 (units: million person-events, million
person-days, and million person-℃, respectively); and (3) spatial distribution
data of the above exposure indicators at the prefecture-level city scale in
vector format. The dataset is archived in .xlsx and .shp formats. The
abbreviations used in the attribute table of the vector dataset are defined in
Table 2.
4.2 Data Products
Based
on the statistical analyses for the three reference years (2000, 2010, and
2020), population exposure to heatwaves across prefecture-level administrative
units in China has exhibited a non-linear and fluctuating upward trend over the
past two decades. This trend is characterized by a relatively moderate increase
during the early period followed by a sharp rise in recent years. All exposure
indicators reached their historical peaks in 2020 (Figure 2).
Regarding
population exposure to heatwave frequency, the average exposure across
prefecture-level administrative units nationwide was approximately 15.6 million
person- events in 2000. In 2010, this metric experienced a slight decline, with
the mean dropping to 14.8 million person-events. However, by 2020, population
exposure to heatwave frequency increased substantially to 25.2 million
person-events, representing an increase of approximately 70% compared with
2010. The distribution pattern shown in the box plots further reveals a marked
increase in data dispersion in 2020, indicating a widening disparity in the
impacts of heatwave frequency across different cities.
Population exposure to heatwave duration
and cumulative heat load exhibited an even more pronounced upward trend. Taking
HWD as an example, the average exposures levels in 2000 and 2010 were
approximately 63.5 million person-days and 55.2 million person- days,
respectively, whereas the mean value of this indicator exceeded 110 million
person- days in 2020. An even stronger increase is observed for cumulative heat
load (HeatCum). The average population exposure to cumulative heat reached
162.8 million person-℃ in
Table 2 Abbreviations in the vector data attribute table for the Dataset of population
exposure to extreme heatwaves in China
|
Abbreviation
|
Index meaning
|
|
PV_ID
|
Province_ID
|
|
PV_Name
|
Province_Name
|
|
PV_Type
|
Province_Type
|
|
E_PV_Name
|
English_Province_Name
|
|
PV_T_E_N
|
Province_Type_English_Name
|
|
Cities_ID
|
Cities_ID
|
|
City_Name
|
City_Name
|
|
E_C_name
|
English_city_name
|
|
PEHWF_2000
|
Population_Exposure_to_Heatwave_Frequency_2000
|
|
PEHWD_2000
|
Population_Exposure_to_Heatwave_Duration_2000
|
|
PECH_2000
|
Population_Exposure_to_Cumulative_Heat_2000
|
|
PEHWF_2010
|
Population_Exposure_to_Heatwave_Frequency_2010
|
|
PEHWD_2010
|
Population_Exposure_to_Heatwave_Duration_2010
|
|
PECH_2010
|
Population_Exposure_to_Cumulative_Heat_2010
|
|
PEHWF_2020
|
Population_Exposure_to_Heatwave_Frequency_2020
|
|
PEHWD_2020
|
Population_Exposure_to_Heatwave_Duration_2020
|
|
PECH_2020
|
Population_Exposure_to_Cumulative_Heat_2020
|
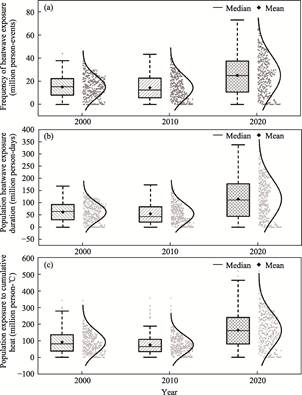
Figure 2
Temporal evolution characteristics of the population heatwave exposure
risk in China
2020,
far exceeding the corresponding levels in 2000 (92.5 million person-℃)
and 2010 (73.6 million person-℃). These results indicate that the heatwave
risks faced by China’s urban population in recent years are manifested not only
in a higher frequency of heatwave events but also in longer durations and
substantially intensified heat exposure.
Population heatwave exposure risk in China
exhibits a clear spatial differentiation pattern, characterized by higher
levels in the southeast and lower levels in the northwest. Over time, high-risk
areas have evolved from a relatively widespread spatial distribution to a more
concentrated pattern within major urban agglomerations (Figure 3). In 2000,
areas with high heatwave exposure were primarily concentrated in the
Huang-Huai-Hai Plain (including Beijing-Tianjin-Hebei, Henan, and Shandong) and
the Middle and Lower Reaches of the Yangtze River. Notably, North China showed
consistently high exposure levels across all three dimensions of population
heatwave exposure, whereas the Yangtze River Basin exhibited particularly high
risks in terms of heatwave duration (HWD) and cumulative heat
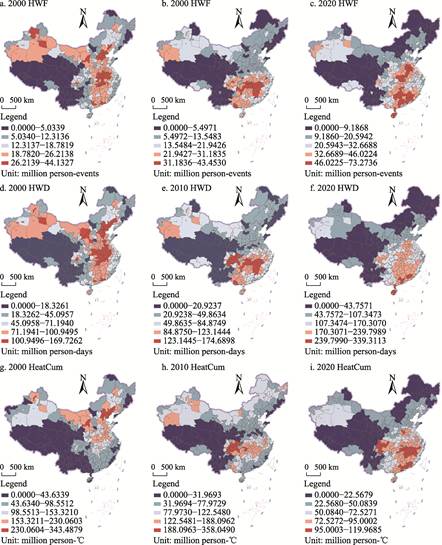
Figure 3 Maps of
the spatiotemporal evolution characteristics of the risk of population heatwave
exposure in China
(HeatCum).
During this period, high-risk areas were largely contiguous across East China,
forming a broad and continuous spatial distribution.
In 2010, heatwave
exposure risk across most parts of China experienced a temporary moderation.
The spatial extent of high-exposure risk areas in much of North and East China
contracted significantly. Moderate levels of exposure risks were retained only
in certain southern coastal cities and in the Chengdu-Chongqing (Chengyu)
region, a pattern that corresponds with the numerical decline observed in the
box plots for this period. By 2020, the center of heatwave exposure risk had
shifted markedly southward and intensified. The Middle and Lower Yangtze Plain,
the Jiangnan Hilly Region, and the coastal areas of South China emerged as the
most severely affected regions. In most prefecture-level cities within
provinces such as Guangdong, Guangxi, Hunan, Jiangxi, and Fujian, population
exposure to heatwave duration (HWD) generally exceeded 100 million person-days
(Figure 3), while the HeatCum indicator also reached extreme values. Due to the
combined effects of high population density and increasingly intense heatwaves,
the Middle Reaches of the Yangtze River Urban Agglomeration, the Pearl River
Delta, and the Chengdu-Chongqing Urban Agglomeration emerged as the primary
hotspots of population exposure risk. In contrast, although the North China
Plain still exhibited some exposure risk in 2020, its relative intensity had
become significantly weaker than that observed in Southern China.
In summary, from
2000 to 2020, after experiencing a brief trough around 2010, population
exposure to heatwaves in China increased sharply by 2020. Moreover, the center
of exposure risk showed a clear tendency to shift toward the densely populated,
hot and humid southern regions and major urban agglomerations. These patterns
highlight the combined driving effects of climate change and population
concentration on heatwave n exposure risk.
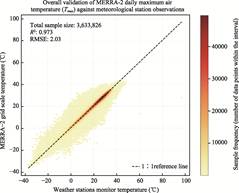
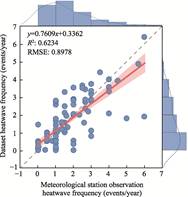
4.3 Data Validation
The
data quality assessment consists of 2 stages: source data validation and result
validation. First, a comparison based on
3.63 million sample points shows that the MERRA-2 reanalysis data
exhibits exceptionally high consistency with temperatures observations from
ground-based meteorological stations across China (R2>0.97,
RMSE=2.03 ℃). These results provide a reliable physical basis for the
subsequent calculations (Figure 4).
To evaluate the
accuracy of the administrative unit-level dataset, this study selected in situ
observational data from 35 key cities across China for cross-validation. The
results indicate that, despite the spatial smoothing effect associated with the
“point-to-area” aggregation process, which resulted in a coefficient of
determination (R2)
of 0.62 for the annual Heatwave Frequency (HWF), the Root Mean Square Error
(RMSE) is only 0.89 occurrences (Figure 5). These findings demonstrate that,
even after undergoing spatiotemporal reconstruction and administrative
aggregation, the dataset maintains a high level of numerical accuracy, enabling
it to reliably characterize the regional evolutionary patterns of heatwave
activity. Furthermore, the spatiotemporal patterns of population heatwave
exposure risk revealed by this dataset are highly consistent with the findings
of previous studies conducted by Tian[15], Wang[16], and
Shen[17].
5 Discussion and Conclusion
The
core value of the Dataset of population exposure to extreme heatwaves in China
(2000, 2010, 2020) developed in this study lies in provision of a standardized
data production framework for mapping natural physical fields onto
socioeconomic units.
Regarding its construction logic, this dataset effectively addresses
the long-standing issue
|
|
|
|
Figure 4 Precision
assessment of MERRA-2 reanalysis data for daily maximum temperature compared
to ground meteorological station measured data
|
Figure 5 Precision
verification of the frequency of heatwave exposure in the dataset and the
measured frequency of heatwave exposure at ground meteorological stations
|
of
dual spatiotemporal scale mismatch in climate change research. In the temporal
dimension, traditional single-year data are highly susceptible to random
perturbations caused by large-scale climate drivers such as ENSO or monsoon
systems, which may introduce uncertainty into analytical conclusions. The
5-year moving window smoothing strategy adopted in this study functions
essentially as a low-pass filtering process. While preserving decadal-scale
climate signals, it effectively filters out interannual variability and random
noise, thereby providing a more robust baseline for long-term trend analysis.
In the spatial dimension, this study aggregates continuous raster-based
meteorological data into discrete prefecture-level administrative units and
introduces high-resolution population weights. This approach not only reduces
the assessment bias associated with relying solely on physical meteorological
indicators but also shifts the analytical perspective from hazard intensity to
actual population exposure risk. Furthermore, this dataset fills an important
gap in multidimensional heatwave risk data at the meso- and macro-scales.
Unlike conventional datasets that provide only a single temperature metric,
this dataset includes process-oriented indicators such as heatwave frequency,
duration, and cumulative heat load. Such multidimensional characterization is
crucial for understanding the compound hazard mechanisms of heatwaves. For
example, increasing heatwave frequency challenges the responsiveness of urban
emergency management systems, while prolonged heatwave duration is closely
associated with excess mortality among residents and increased pressure on
urban energy supply systems. As foundational data integrating both physical and
human geographic attributes, this dataset aims to reduce data barriers between
natural and social sciences. It provides valuable support for public health and
epidemiological research, climate-resilient urban planning, and vulnerability
assessments of socioeconomic systems. Nevertheless, the current dataset still
has several limitations. First, the prefecture-level spatial scale may masks
substantial intra-regional heterogeneity. Second, the use of a single
temperature indicator does not account for humid heat effects. Third, the dataset
focuses solely on historical periods. Future research will therefore focus on
downscaling the spatial resolution to the county level, incorporating composite
indicators such as apparent temperature, and extending the dataset to include
projections under future climate scenarios.
Author Contributions
Nong, K. S. performed the overall
design of the dataset development. Nong, K. S. and Chu, M. R. designed the
models and algorithms of the dataset. Nong, K. S. and Wang, M. H. contributed
to the data collection and processing. Nong, K. S. and Huang, Y. B. conducted
the data validation. Nong, K. S. wrote the data paper as the lead author. Wang, M. H., Huang, Y.
B., and Sun, W. H. made supplementary contributions, and Chu, M. R. conducted a
comprehensive review of the paper.
Conflicts of Interest
The authors declare no conflicts of interest.
References
[1]
Jay, O.,
Capon, A., Berry, P., et al. Reducing the health effects of hot weather
and heat extremes: from personal cooling strategies to green cities [J]. The
Lancet, 2021, 398(10301): 709–724.
[2]
Gao, S.
J., Chen, Y. H., Chen, D. L., et al. Urbanization-induced warming
amplifies population exposure to compound heatwaves but narrows exposure
inequality between global North and South cities [J]. npj Climate and
Atmospheric Science, 2024, 7(1): 154.
[3]
Stalhandske,
Z., Ruiter, M. C. D., Chambers, J., et al. Global assessment of
population exposure to multiple climate-related hazards from 2003 to 2021: a
retrospective analysis [J]. The Lancet Planetary Health, 2025, 9(8): 11.
[4]
Yin, J.
B., Gentine, P., Slater, L., et al. Future socio-ecosystem productivity
threatened by compound drought-heatwave events [J]. Nature Sustainability,
2023, 6(3): 259–272.
[5]
Wang,
J., Li, M. C., Liu, Y. J., et al. Large-scale climatic drivers for
warm-season compound drought and heatwave frequency over North China [J]. Atmospheric
Research, 2023, 288: 106727.
[6]
Liu,
J. H., Chen, J., Yin, J. B., et al. Time of emergence of
record-shattering compound heatwave-extreme precipitation events and their
socio-economic exposures [J]. Geophysical Research Letters, 2025,
52(16): e2025GL116884.
[7]
Nong,
K. S., Wang, M. H., Huang, Y. B., et al. Dataset of population exposure
to extreme heatwaves in China (2000, 2010, 2020) [J/DB/OL]. Digital Journal
of Global Change Data Repository, 2025.
https://doi.org/10.3974/geodb.2025.12.08.V1.
[8]
GCdataPR
Editorial Office. GCdataPR data sharing policy [OL].
https://doi.org/10.3974/dp.policy.2014.05 (Updated 2017).
[9]
Urraca,
R., Cappucci, F., Lanconelli, C., et al. Assessing discrepancies in
global aerosol trends from satellites, models and reanalyses [J]. Remote
Sensing of Environment, 2025, 328: 114827.
[10] Martin, G. K., Rojas-Rueda, D., Fong, K. C.,
et al. A health impact assessment of progress towards urban nature
targets in the 96 C40 cities [J]. The Lancet Planetary Health, 2025,
9(4): e284–e293.
[11] Xie, W. X., Zhou, B. T., You, Q. L., et
al. Observed changes in heat waves with different severities in China
during 1961–2015 [J]. Theoretical and Applied Climatology, 2020, 141(3):
1529–1540.
[12] Yin, C., Yang, Y. P., Chen, X. N., et al.
Changes in global heat waves and its socioeconomic exposure in a warmer future [J].
Climate Risk Management, 2022, 38: 100459.
[13] Cai, F. Y., Liu, C. H., Gerten, D., et
al. Sketching the spatial disparities in heatwave trends by changing
atmospheric teleconnections in the Northern Hemisphere [J]. Nature
Communications, 2024, 15(1): 8012.
[14] Li, X. F., Zhao, L., Wang, S., et al.
Unstable permafrost regions experience more severe heatwaves in a warming
climate [J]. npj Climate and Atmospheric Science, 2025, 8(1): 147.
[15] Tian, P., Zhang, F. Q., Yan, Y. Y., et
al. Spatial inequalities in global population exposure to extreme heats and
heatwaves [J]. Applied Geography, 2025, 174: 103474.
[16] Wang, C. C., Ren, Z. B., Guo, Y. J., et
al. Assessing urban population exposure risk to extreme heat: patterns,
trends, and implications for climate resilience in China (2000–2020) [J]. Sustainable
Cities and Society, 2024, 103: 105260.
[17] Shen, H. J., You, Q. L., Wang, P. L., et
al. Analysis on heat waves variation features in China during 1961–2014 [J].
Journal of the Meteorological Sciences, 2018, 38(1): 28–36.