Spatial Dataset Development of
Overweight and Obesity among Middle-Aged and Elderly Adults in China (2011,
2015)
WANG Peihan1,
2 DUAN Jiazhen3 LI Kexin1* WANG Zhenbo1
1.
Institute of Geographic Sciences and Natural Resources Research, Chinese
Academy of Sciences, Beijing 100101, China;
2. University of Chinese Academy of Sciences,
Beijing 100101, China;
3. School of Business, Beijing Information Science
and Technology University, Beijing 102206, China
Abstract: Body Mass Index (BMI) and Waist-to-Height Ratio (WHtR)
are crucial parameters for assessing human body weight status and overall
health. Drawing on survey data for height, weight, and waist circumference from
the China health and retirement longitudinal study (CHARLS) conducted in 2011
and 2015, this study develops a spatial distribution dataset of BMI and WHtR
among middle-aged and elderly Chinese populations for those years in 124 prefecture-level cities. The dataset includes regional average values
for both BMI and WHtR, alongside the prevalence rates of overweight and
obesity. The dataset is archived in .shp and .xlsx formats, and consists of 9
data files with data size of 32.9 MB (compressed into one single file with 21.4
MB). This dataset
supported the first author’s doctoral thesis in Science.
Keywords: middle-aged and
elderly people; Body Mass Index; Waist-to-Height Ratio; spatial distribution; doctoral thesis in Science
DOI: https://doi.org/10.3974/geodp.2026.02.03
Dataset Availability Statement:
The dataset
supporting this paper was published and is accessible through the Digital Journal of
Global Change Data Repository at:
https://doi.org/10.3974/geodb.2025.12.04.V1.
1 Introduction
Body Mass Index (BMI) is a
universally recognized standard for assessing general obesity and health status[1].
Since 1995, the World Health Organization (WHO) has recommended BMI cut-off
points of 25 kg/m2 and 30 kg/m2 as diagnostic criteria
for overweight and obesity in adults, respectively. However, these criteria
were primarily derived from populations in Western countries and are not
universally applicable. In 2013, China issued the Standard for adult physical
fitness assessment, which defined the normal BMI range for healthy Chinese
adults as 18.5 kg/m2≤BMI<24.0 kg/m2. Under this
standard, a BMI below 18.5 kg/m2 indicates underweight, a BMI
between 24.0 kg/m2 and 27.9 kg/m2 indicates overweight,
and a BMI of 28.0 kg/m2 or above indicates obesity. Concurrently,
the Waist-to-Height Ratio (WHtR) serves as a robust universal indicator of
central obesity. The rapid surge in overweight and obesity prevalence has
emerged as a major threat to global public health[2], a crisis
particularly pronounced in developing nations[3]. According to
relevant studies, China, as the world’s largest developing country, has become
the nation with the largest number of overweight and obese individuals globally[4].
Projections suggest that by 2030, 790 million Chinese adults will be classified
as overweight or obese—accounting for approximately 65.3% of the total adult
population. Correspondingly, medical costs attributable to these conditions are
expected to reach 418 billion CNY, representing about 22% of total annual
medical expenditures[4]. Furthermore, China is undergoing the most
rapid population aging process worldwide. According to the United Nations
projections, the proportion of China’s population aged 60 and older will grow
at an annual rate of 2.35% between 2015 and 2055, vastly outpacing the global
average of 1.43% for the same period[5]. Because aging inherently
elevates the risk of numerous diseases, the convergence of an aging population
with high rates of overweight and obesity will inevitably pose severe
challenges to China’s public health infrastructure.
Existing research on overweight
and obesity among middle-aged and elderly demographics predominantly
concentrates on macro-level public health policies, often overlooking the nuanced weight
status of populations across different regions. Studies that neglect these
spatial disparities risk drawing erroneous conclusions. To more accurately
capture the weight status of middle-aged and elderly individuals across various
urban regions in China, this study calculated the BMI and WHtR for these
populations using data from the CHARLS conducted in 2011 and 2015. Ultimately,
this work aims to provide robust empirical data support for future scientific
inquiries and the development of targeted public health policies.
2 Metadata of the Dataset
The metadata of the Spatial
dataset of overweight and obesity among middle-aged and elderly adults in China
(2011, 2015)[6], including the dataset name, authors, geographic region,
year of the dataset, temporal resolution, data format, data size, data files,
data publisher, are summarized in Table 1.
3 Methods
3.1 Data Sources
Raw data were sourced from
the China health and retirement longitudinal study (CHARLS), a high-quality
micro-level dataset comprising data on middle-aged and elderly Chinese
households and individuals aged 45 and older. CHARLS was specifically designed
to investigate the dynamics of population aging in China and to foster interdisciplinary
research on the subject[8]. The national baseline survey for CHARLS
was conducted in 2011, encompassing approximately 17,000 respondents.
Measurement protocols for height, weight, and waist
circumference are meticulously documented in the CHARLS physical examination
questionnaires for both 2011 and 2015. Height
was measured using a stadiometer, with results recorded in centimeters (cm)
under the variable “qi002”. Weight was assessed using a standard weighing
scale, with results logged in kilograms (kg) under the variable “ql002”. Waist
circumference was measured using a flexible measuring tape and documented in
centimeters (cm) under the variable “qm002”.
Table 1 Metadata summary
of the
Spatial dataset of overweight
and obesity among middle-aged and elderly adults in China (2011, 2015)
|
Item
|
Description
|
|
Dataset Name
|
Spatial dataset
of overweight and obesity among middle-aged and elderly adults in China
(2011, 2015)
|
|
Dataset Short Name
|
Overweight&ObesityChina2011&2015
|
|
Authors
|
Wang, P. H.,
Institute of Geographic Sciences and Natural Resources Research, Chinese
Academy of Sciences, wangpeihan24@mails.ucas.ac.cn
Duan, J. Z.,
University of Chinese Academy of Sciences, djz0715@bistu.edu.cn
Li, K. X., Institute
of Geographic Sciences and Natural Resources Research, Chinese Academy of
Sciences, likx@igsnrr.ac.cn
Wang, Z. B.,
Institute of Geographic Sciences and Natural Resources Research, Chinese
Academy of Sciences, wangzb@igsnrr.ac.cn
|
|
Geographical area
|
124 prefecture-level
cities, prefectures and autonomous prefectures in China
|
|
Year
|
2011,2015
|
|
Temporal resolution
|
Year
|
|
Data format
|
.shp, .xlsx
|
|
Data size
|
32.9 MB
|
|
Data files
|
The average values of
BMI, average values of WHtR, as well as the prevalence of overweight and
obesity in 124 prefecture-level cities in 2011 and 2015; Statistical data on
BMI, WHtR, and the prevalence of overweight and obesity among middle-aged and
elderly people in 124 prefecture-level cities in China, etc.
|
|
Foundation
|
National Natural
Science Foundation of China (42407621)
|
|
Data Publisher
|
Global Change
Research Data Publishing & Repository, http://www.geodoi.ac.cn
|
|
Address
|
No. 11A, Datun Road,
Chaoyang District, Beijing 100101, China
|
|
Data sharing policy
|
(1) Data
are openly available and can be free downloaded via the Internet; (2) End
users are encouraged to use Data
subject to citation; (3) Users, who are by definition also value-added
service providers, are welcome to redistribute Data subject to written permission from the GCdataPR Editorial
Office and the issuance of a Data
redistribution license; and (4) If Data
are used to compile new datasets, the “ten percent principal” should be
followed such that Data records
utilized should not surpass 10% of the new dataset contents, while sources
should be clearly noted in suitable places in the new dataset[7]
|
|
Communication and searchable system
|
DOI, CSTR, Crossref, DCI,
CSCD, CNKI, SciEngine, WDS, GEOSS, PubScholar, CKRSC
|
3.2 Data Preprocessing
Errors and missing values are inevitable artifacts of data collection
and compilation. The presence of missing or anomalous values in height, weight,
and waist circumference survey
data can significantly skew
subsequent analyses; therefore, the raw variables were preprocessed to filter
out anomalies. First, all missing values were excluded. Subsequently, the
interquartile range (IQR) method was employed to identify and exclude outliers.
The IQR is calculated as the difference between the third quartile (Q3) and the
first quartile (Q1), expressed by the following Equation:
IQR=Q3–Q1 (1)
Data points falling below Q1–1.5IQR or above
Q3+1.5IQR were classified as abnormal values and systematically removed.
3.3 Algorithm
3.3.1 Body Mass Index (BMI) Calculation
Individual
BMI was calculated using STATA software (Version 14) via the following Equation:
BMI=w/h2 (2)
Where BMI is measured
in kg/m2, w is body weight in
kilograms (kg), and h is height in meters (m). In accordance with the Chinese
guidelines for the clinical management of obesity (2024 Edition)[9] and
pertinent directives from the National Health Commission of China, the weight
status of Chinese adults is categorized as follows: BMI <18.5 kg/m2
indicates underweight, 18.5≤ BMI <24.0 kg/m2 indicates normal
weight, 24.0≤BMI<28.0 kg/m2 indicates overweight, and BMI ≥28.0
kg/m2 indicates obesity.
3.3.2 Waist-to-Height Ratio (WHtR)
Calculation
Individual WHtR was similarly computed using STATA
software (Version 14) using the Equation:
WHtR=y/h
(3)
Where WHtR represents the
Waist-to-Height Ratio, y is waist circumference (cm), and h is
height (cm).
3.3.3 Spatial Data
Computing
The CHARLS dataset assigns a unique
identification number (ID) to each respondent and a unique community identifier
(communityID) for their affiliated community or administrative village.
Additionally, a “PSU.dta” file provides the geographic mapping between these
community identifiers and their corresponding cities.
Leveraging this mapping relationship,
respondents were geolocated to their respective prefecture-level cities or
autonomous prefectures. Subsequently, the average BMI, average WHtR, and the
prevalence rates of overweight and obesity were computed for each jurisdiction.
The average BMI and WHtR were calculated as the arithmetic means of the
respondents’ metrics within each corresponding city. The prevalence of
overweight and obesity was determined by dividing the number of overweight or
obese individuals in a given city by the total number of respondents with valid
BMI data in that same area. Finally, spatial mapping was conducted using ArcGIS
Pro (Version 3.0).
The technical roadmap for dataset development
is shown in Figure 1.
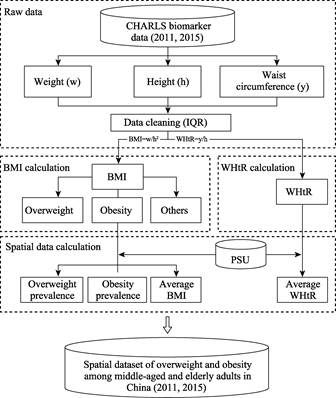
Figure 1 Flowchart of the
dataset development
4 Data Results
4.1 Dataset
Composition
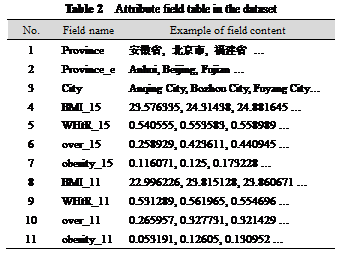 This dataset comprises BMI and WHtR data for middle-aged and elderly
populations across 124 prefecture-level cities and autonomous prefectures in
China. It is formatted as spatial polygon data within a “.shp” file, with the
specific attribute fields detailed in Table 2.
This dataset comprises BMI and WHtR data for middle-aged and elderly
populations across 124 prefecture-level cities and autonomous prefectures in
China. It is formatted as spatial polygon data within a “.shp” file, with the
specific attribute fields detailed in Table 2.
Specifically, “BMI_11” and “BMI_15” denote
the average urban BMI values for middle-aged and elderly people in 2011 and
2015, respectively; “WHtR_11” and “WHtR_15” indicate the average urban WHtR
values for the same demographic in those years. The fields “over_11” and
“over_15” represent the urban prevalence of overweight individuals in 2011 and
2015, while “obesity_11” and “obesity_15” denote the urban prevalence of
obesity for those corresponding years.
4.2 Data Results Analysis
The raw CHARLS data utilized
for this dataset originally contained 17,710 samples for 2011 and 21,113
samples for 2015. Following the exclusion of missing data and the filtering of
outliers, a final cohort of 13,488 samples for 2011 and 15,989 samples for 2015
was retained for computational analysis. These validated samples span 124
prefecture-level cities and autonomous prefectures across China.
Statistical analyses were performed on the BMI and WHtR
data of middle-aged and elderly populations in China based on the results, as
presented in Table 3. As shown in the table, the global Moran’s I
values exhibited a significant increasing trend from 2011 to 2015, indicating
that the spatial distribution of overweight and obesity in urban areas showed a
gradual tendency of clustering, with regional disparities widening over time.
Among these indicators, the mean values of urban BMI and WHtR showed negligible
differences, whereas the median prevalence rates of overweight and obesity
increased. Specifically, the prevalence of overweight rose markedly from 0.29
to 0.34, while the prevalence of obesity increased slightly from 0.10 to 0.11.
These findings suggest that overweight among middle-aged and elderly
individuals in China has become increasingly severe, whereas the prevalence of
obesity has remained relatively stable.
Calculations of the differences in
the prevalence rates of overweight and obesity between 2011 and 2015 (Figure 2)
reveal the following findings. In terms of overweight prevalence (Figure 2a),
compared with 2011, most cities recorded an increase in overweight prevalence
among middle-aged and elderly residents in 2015, with Xuzhou City, Jiangsu
Province showing the largest increase of approximately 34.1%. A small number of
cities exhibited a decline in overweight prevalence, among which Dezhou City,
Shandong Province registered the most pronounced decrease of about 19.7%. Regarding
obesity prevalence (Figure 2b), the majority of cities also displayed an upward
trend, with the Garzê Tibetan Autonomous Prefecture in Sichuan Province
recording the highest increase of roughly 22.6%. Several cities experienced a
notable reduction in obesity prevalence, with Liaocheng City, Shandong Province
showing the greatest decline of around 42.3%.
Table 3 Statistical analysis of prefectural-level
BMI and WHtR data of middle-aged and elderly people in China
|
Name
|
Year
|
Minimum value
|
Maximum value
|
Average value
|
Standard deviation
|
Median
|
Moran’I
|
P value
|
|
Average BMI
|
2011
|
20.25
|
27.42
|
23.45
|
1.20
|
23.43
|
0.213515
|
<0.01
|
|
2015
|
20.57
|
26.16
|
23.79
|
1.06
|
23.80
|
0.241040
|
<0.01
|
|
Mean WHtR
|
2011
|
0.48
|
0.61
|
0.54
|
0.02
|
0.54
|
0.056649
|
<0.01
|
|
2015
|
0.51
|
0.60
|
0.55
|
0.02
|
0.55
|
0.100135
|
<0.01
|
|
Prevalence of overweight
|
2011
|
0.00
|
0.60
|
0.30
|
0.09
|
0.29
|
0.106580
|
<0.01
|
|
2015
|
0.06
|
0.57
|
0.34
|
0.08
|
0.34
|
0.194017
|
<0.01
|
|
Prevalence of obesity
|
2011
|
0.00
|
0.54
|
0.11
|
0.08
|
0.10
|
0.135871
|
<0.01
|
|
2015
|
0.01
|
0.29
|
0.12
|
0.06
|
0.11
|
0.213515
|
<0.01
|
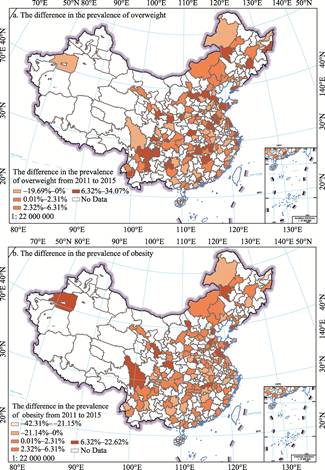
Figure 2 Distribution maps of prevalence
differences in overweight and obesity among middle-aged and elderly people in
China (2011–2015)
Overall, the general
trends of overweight and obesity prevalence among middle-aged and elderly
populations in China were consistent between 2011 and 2015. However,
inconsistent trends between overweight and obesity prevalence were observed in
individual cities. For instance, cities such as Beijing, Cangzhou, and Luoyang
showed an increase in overweight prevalence but a decrease in obesity
prevalence during this period. In contrast, regions including Aksu, Lanzhou,
and Garzê exhibited the opposite pattern: a decline in overweight prevalence
accompanied by a rise in obesity prevalence.
5 Conclusion
An elevated BMI significantly
heightens the risk of numerous chronic diseases, influencing the public health
and overall quality of life. Understanding the spatial distribution patterns of
BMI and WHtR is essential for mapping epidemiological development trends. Such
spatial insights offer critical guidance for advancing clinical treatments for
overweight and obesity among middle-aged and older populations, as well as for
formulating targeted mitigation policies.
Leveraging publicly available
survey data, this study calculated and spatially analyzed mean BMI, mean WHtR,
and the prevalence of overweight and obesity among middle-aged and elderly
demographics across various Chinese regions. This effort culminated in the
construction of a comprehensive spatial distribution dataset. Although the
dataset does not encompass every municipality in the nation, it successfully
captures the broader spatial paradigms of weight status among China’s aging
population. Given the logistical and financial barriers to conducting
comprehensive national census surveys on clinical obesity, this dataset
effectively bridges the current spatial data gap, providing a robust empirical foundation
for future epidemiological and geographical research on overweight and obesity. This dataset supported the first author’s doctoral thesis in Science.
Author Contributions
Wang, P. H. was responsible
for data processing and manuscript drafting. Duan, J. Z. assisted in data
processing and undertook Chinese-English proofreading. Li, K. X. was in charge
of research topic selection and provided methodological guidance. Wang, Z. B.
provided overall academic supervision and project guidance.
Conflicts of Interest
The authors declare no conflicts of
interest.
References
[1]
WHO. Obesity: preventing and managing the
global epidemic. Report of a WHO consultation [R]. World Health Organization
technical report series, 2000, 894.
[2]
Ng, M., Fleming, T., Robinson,
M., et al. Global, regional, and national prevalence of overweight and
obesity in children and adults during 1980–2013: a systematic analysis for the
Global Burden of Disease Study 2013 [J]. The Lancet, 2014, 384(9945):
766–781.
[3]
Popkin, B. M., Adair, L. S.,
Ng, S. W. Global nutrition transition and the pandemic of obesity in developing
countries [J]. Nutrition Reviews, 2012, 70(1): 3–21.
[4]
Wang, Y. F., Zhao, L., Gao, L.
W., et al. Health policy and public health implications of obesity in
China [J]. The Lancet Diabetes & Endocrinology, 2021, 9(7):
446–461.
[5]
Cai,
F. Supply-and demand-side impacts of aging on China’s economic growth [J]. Economic
Perspectives,
2021(1): 27–34.
[6]
Wang, P. H., Duan, J. Z., Li,
K. X., et al. Spatial dataset of overweight and obesity among middle-aged
and elderly adults in China (2011, 2015) [J/DB/OL]. Digital Journal of
Global Change Data Repository, 2025.
https://doi.org/10.3974/geodb.2025.12.04.V1.
[7]
GCdataPR Editorial Office.
GCdataPR data sharing policy [OL]. https://doi.org/10.3974/dp.policy.2014.05
(Updated 2017).
[8]
Zhao, Y. H., Hu, Y. S., Smith,
J. P., et al. Cohort profile: the China health and retirement
longitudinal study (CHARLS) [J]. International Journal of Epidemiology,
2014, 43(1): 61–68.
[9]
Department of Medical
Administration, National Health Commission of P. R. China. Chinese guidelines
for the clinical management of obesity (2024 Edition) [J]. Medical Journal
of Peking Union Medical College Hospital, 2024, 16(1): 90–108.