YING Chao1,2 LIU Yongchao1,2 TIAN Peng3 ZHONG Jie1 LI Jialin1,2*
1.
School of Geography and Remote sensing, Ningbo University, Ningbo 315211, China;
2.
East China Sea Research Institute, Ningbo University, Ningbo 315211, China;
3.
College of Life and Environmental Sciences, Wenzhou University, Wenzhou 325035,
China
Abstract:
The coastal zone is among the most ecologically fragile regions, where global
change and human activities interact most intensively. Constructing a long-term
ecological resilience dataset is of great significance for regional risk
identification, resilience assessment, and ecological governance. Focusing on
the continental coastal zone of the East China Sea (ECS), this study integrates
remote sensing imagery from MODIS and TM/ETM+, basic geographic data, and
socioeconomic statistics to develop an ecological resilience assessment
indicator system under a framework combining ecological processes (risk-resistance-adaptation-recovery)
and ecological background conditions (scale-density-morphology). A combined
subjective-objective weighting approach was employed by integrating the fuzzy
analytic hierarchy process (FAHP) and the CRITIC method, and the final
integrated weights were determined based on the Lagrange extremum condition.
Using the composite index method, an ecological resilience dataset and
corresponding subsystem datasets for the continental coastal zone of the ECS
from 2000 to 2022 were generated. The results show that ecological resilience
exhibited a fluctuating but overall increasing trend during the study period,
reached a relatively low level in 2005, and improved continuously after 2010.
Spatially, the distribution pattern remained generally stable, with lower
values in the northeastern part and higher values in the southwestern part of
the study area. The dataset includes spatial distribution data of the
ecological resilience index at 5-year intervals from 2000 to 2022, data for 7
subsystems including scale, density, morphology, risk, resistance, adaptation,
and recovery, as well as zonal statistics for the ecological resilience index
and each subsystem. The spatial data have a resolution of 100 m and are archived
in .tif and .xlsx formats. The dataset comprises 241 files, with an original
volume of 14.2 GB and a compressed size of 902 MB. This dataset supported the
completion of the first author’s Master of Science thesis.
Keywords: ecological
resilience; multi-source data fusion; combination weighting; continental
coastal zone of the East China Sea region; Master of Science thesis
DOI: https://doi.org/10.3974/geodp.2026.02.04
Dataset Availability Statement:
The dataset supporting this paper was published and is
accessible through the Digital Journal of Global Change Data Repository
at: https://doi.org/10.3974/geodb.2026.02.09.V1.
1 Introduction
The coastal zone is a complex
and dynamic transitional region where land extends seaward[1]. Owing
to its advantageous geographic location and abundant resources, it has become a
strategic hub and a key area for territorial spatial development and land-sea
integration[2]. Against the backdrop of global climate change and
sea-level rise, the combined effects of continued population agglomeration and
high-intensity development have accelerated the degradation of ecosystem
structure[3], ecosystem service value[4], and landscape
quality[5]. These changes have progressively weakened ecosystem
carrying capacity and self-purification capacity, increased natural and social
hazard-inducing factors, and intensified risk exposure[6], thereby
creating an urgent need to support risk governance and integrated management
through the concept of ecological resilience. Constructing a long-term, highly
comparable, and traceable ecological resilience dataset for coastal zones can
not only provide basic data for identifying regional ecological security
patterns and improving territorial spatial governance, but also offer
quantitative support for adaptation and disaster reduction under global change
scenarios.
The concept of resilience originated in engineering,
where it referred to the ability of a system to return to its original state
after disturbance. It was subsequently expanded to ecology and human-environment
regional systems research[7]. From an ecological perspective,
resilience emphasizes the ability of a system to maintain structural and
functional stability under disturbance while transitioning toward a new stable
state. From an evolutionary perspective, it highlights the capacity of a system
to adapt, learn, and renew itself in response to uncertain disturbances[8].
Ecological resilience can therefore be understood as the integrated capacity of
an ecosystem to resist external shocks, maintain or restore its structure and
functions, and sustain self-organization and self-renewal. Existing studies on
ecological resilience mainly rely on conceptual framework construction,
composite indicator evaluation, and multi-model coupling analysis[9].
However, in the coastal-zone contexts, such studies still exhibit several
limitations, including an overemphasis on single hazard types or individual
processes, fragmentation among indicator dimensions, and insufficient
integration of baseline conditions with process-based resilience capacities[10].
Therefore, it is necessary to develop a comprehensive assessment within a
unified framework that simultaneously considers resilience processes and
resilience foundations, so as to improve the integrity and interpretability of
ecological resilience data.
The continental coastal zone of the ECS is a frontier
region of China’s marine economic development[11]. However, rapid
development has also been accompanied by intensive exploitation of land and
coastlines, continuously reshaping land-use patterns and landscape configurations
while aggravating resource and environmental risks[12]. At the same
time, the region’s pronounced natural geographic differences and clear
gradients in topography, climate, and human activities make it a representative
area for characterizing the spatiotemporal heterogeneity of ecological
resilience. Therefore, based on a framework of risk-resistance-adaptation-recovery-scale-density-morphology,
this study integrates multi- source data, including socioeconomic statistics
and natural ecological raster data, and applies a combined weighting method and
weighted summation to generate a spatial distribution dataset of ecological
resilience for the continental coastal zone of the ECS. The resulting dataset
provides data support for ecological security assessment, integrated
management, and the formulation of resilience enhancement strategies in coastal
zones.
2 Metadata of the Dataset
The metadata for the Dataset
of ecological resilience index of the continental coastal of the East China Sea
(2000–2022)[13], including its title, authors, geographic region,
year of the dataset, temporal resolution, spatial resolution, dataset files,
data publication and sharing platform, and data sharing policy, etc., is
summarized in Table 1.
Table 1 Metadata summary of Dataset of
ecological resilience index of the continental coastal of the East China Sea
(2000–2022)
|
Items
|
Description
|
|
Dataset full name
|
Dataset of ecological resilience index of the continental coastal of
the East China Sea (2000–2022)
|
|
Dataset short name
|
EcoRes_CoastalEastChinaSea_2000–2022
|
|
Authors
|
Ying,
C., School of Geography and Remote sensing, Ningbo University, 2211420028@nbu.edu.cn
Liu, Y. C., School of Geography and Remote sensing, Ningbo University,
liuyongchao@nbu.edu.cn
Tian, P., College of Life and Environmental Sciences, Wenzhou University, tianpeng@nbu.edu.cn
Zhong, J., School of Geography and Remote sensing, Ningbo University, 2211420033@nbu.edu.cn
Li, J. L., School of Geography and Remote sensing, Ningbo University, lijialin@nbu.edu.cn
|
|
Geographical region
|
Continental coastal of the East China Sea
|
|
Year
|
2000–2022
|
|
Temporal resolution
|
5/2 year
|
|
Spatial resolution
|
100 m×100 m
|
|
Data format
|
.tif, .xlsx
|
|
Data size
|
902 MB (compressed)
|
|
Data
files
|
Spatial
distribution of the ecological resilience index; data for 7 assessment subsystems,
including scale, density, morphology, risk, resistance, adaptation, and
recovery; regional statistical data of the ecological resilience index and
statistical data for each subsystem
|
|
Foundation
|
National Natural Science Foundation of China (42276234)
|
|
Data publisher
|
Global Change Research Data Publishing & Repository, http://www.geodoi.ac.cn
|
|
Address
|
No. 11A, Datun Road, Chaoyang District, Beijing 100101, China
|
|
Data
sharing policy
|
(1) Data are openly available and
can be free downloaded via the Internet; (2) End users are encouraged to use Data
subject to citation; (3) Users, who are by definition also value-added
service providers, are welcome to redistribute Data subject to
written permission from the GCdataPR Editorial Office and the issuance of a Data
redistribution license; and (4) If Data are used to compile new
datasets, the “ten percent principal” should be followed such that Data
records utilized should not surpass 10% of the new dataset contents, while
sources should be clearly noted in suitable places in the new dataset[14]
|
|
Communication
and
searchable system
|
DOI,
CSTR, Crossref, DCI, CSCD, CNKI, SciEngine, WDS, GEOSS, PubScholar, CKRSC
|
3 Methods
3.1 Study area
The
continental coastal zone of the ECS is located between 23°36′N and 31°30′N and
between 116°53′E and 122°08′E, covering an area of approximately 5.85×10⁴
km2. It extends from the boundary between Shanghai and Jiangsu in
the north to the boundary between Fujian and Guangdong in the south. Owing to
its strategic location linking east and west as well as north and south, the
study area includes 45 coastal counties within 14 coastal prefecture-level
cities in Shanghai, Zhejiang, and Fujian. The region is characterized by a long
and highly indented coastline, numerous bays, diverse coastal types, and many
large ports, and exhibits a regional pattern of intensive marine industrial
distribution and high-intensity development and utilization[11]. In
terms of physical geography, the area displays marked north-south contrasts: the
northern part is dominated by plains with well-developed muddy coasts, whereas
the southern part is dominated by low mountains and hills with bedrock coasts.
The region is rich in natural resources, with an average tidal range generally
of about 4–5 m, which is even more pronounced in coastal and bay areas[12].
Considering the large number of islands in the ECS and the absence of
multi-source data for many island areas, this study excludes islands from the
spatial extent and retains only the continental coastal zone to ensure data
integrity and spatiotemporal consistency.
3.2 Data Sources
The
data used in this study include remote sensing imagery from MODIS, Landsat 5
TM, Landsat 7 ETM+, and Landsat 8 OLI/TIRS, as well as raster datasets derived
from these images, such as NDVI and NPP; vector data including maps, roads, and
rivers; and socioeconomic statistics obtained from provincial and municipal
statistical yearbooks and statistical bulletins. The specific data sources are
summarized in Table 2.
3.3 Algorithm
3.3.1 Construction of the Ecological Resilience Assessment
Framework and Indicator System
Resilience assessment should
consider not only the capacities demonstrated throughout the resilience
process, but also the baseline conditions of resilience, indicating that
resilience needs to be evaluated jointly from the perspectives of both process
and baseline conditions (Table 3). The resilience process focuses on sources of
pressure and system response capacities. Risk refers to factors that disturb
and stress coastal ecosystems, reflecting the likelihood and severity of internal
and external disturbances and stresses faced by the coastal zone. Resistance
refers to the ability of coastal ecosystems to withstand the impacts of
disturbances by virtue of their inherent attributes and indirectly reflects the
extent to which coastal ecosystems are affected by them. Adaptation refers to
the capacity of coastal ecosystems to respond to risk disturbances through
passive adjustment and short-term updating when effective resistance cannot be
achieved, thereby maintaining the stability of ecosystem structure and functions.
Recovery refers to the capacity of ecosystems to recover, renew, and
self-organize after experiencing risk disturbances. As the carrier and
foundation of ecological resilience, the resilience baseline reflects the
status of system elements in terms of quantity, structure, quality, and spatial
configuration, and is influenced by ecosystem scale, density, and morphology.
3.3.2
Weight
Determination and Composite Index Calculation
To eliminate differences in
measurement units among indicators, all indicators were first normalized using
the min-max method. A combined subjective-objective weighting approach was then
adopted, in which the subjective weights were derived using the fuzzy analytic
hierarchy process (FAHP), and the objective weights were obtained using the
CRITIC (Criteria Importance Through Intercriteria Correlation) method. Based on
the principle of Lagrange extremum conditions, the weighting coefficients  were solved to determine the final combined weights[15].
Ecological resilience was then calculated by weighted summation using the
composite index method. The Equations are as follows:
were solved to determine the final combined weights[15].
Ecological resilience was then calculated by weighted summation using the
composite index method. The Equations are as follows:
 (1)
(1)
 (2)
(2)
Where is the subjective weight,
  is the objective weight,
  is the combined weight,
  denotes ecological resilience,and
  represents the normalized value of the j-th indicator.
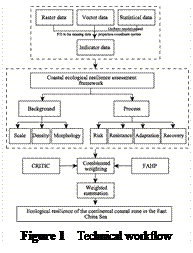
3.4 Technical Workflow
This study
integrated multi-source data, including remote sensing raster data, vector
data, and socioeconomic statistics. For missing values occurring over multiple
periods along administrative boundaries, kriging interpolation was applied for
gap filling, and the interpolated results were mosaicked with the original data
to produce a complete time series. To ensure
the comparability and integrability of multi-source data, all datasets were
uniformly
Table
2 Data Source and related information
|
Data type
|
Data name
|
Data sources
|
Resolution
|
|
Vector data
|
Administr-ative
divisions
|
Administrative
division of prefecture-
level cities and county-level
administrative regions in China
|
National
Geospatial Information Center
|
/
|
|
Coastline
|
Interpretation of
the continental
coastline of the East Sea
|
Remote sensing
visual interpretation
|
/
|
|
Geological
disasters
|
Dataset of the
distribution of
geological disaster sites in China
|
Chinese Academy of
Sciences Center for Resources and Environmental Sciences and Data Management,
2020
|
/
|
|
Typhoon
|
Typhoon IBTrACS dataset
|
National Centers for Environmental Information
Gahtan, J., et al., 2024
|
/
|
|
Raster data
|
Climate
|
Spatial
distribution data of annual
precipitation in China
|
National Earth
System Science Data
Center, Peng, 2025
|
1,000 m
|
|
Dataset of China
monthly evaporation
and transpiration
|
National Earth
System Science Data
Center, Peng, 2025
|
1,000 m
|
|
Dataset of the
monthly average
temperature in China
|
National Earth
System Science Data
Center, Peng, 2025
|
1,000 m
|
|
Vegetation
|
Dataset of root
depth of Chinese plants
|
Scientific Data
Yan, et al.,
2020
|
1,000 m
|
|
Dataset of China
Monthly NDVI
|
National Earth
System Science Data
Center, Xu, 2025
|
1,000 m
|
|
Dataset of net
primary productivity
of vegetation in China
|
National Earth
System Science Data
Center
|
500 m
|
|
Dataset of China
vegetation coverage
|
National
Qinghai-Xizang Plateau Science Data Center, Gao, et al. 2022
|
250 m
|
|
Land use
|
Dataset for remote
sensing monitoring
of land use in China
|
Chinese Academy of
Sciences Center for Resources and Environmental Sciences and Data Management,
Xu, et al. 2025
|
30 m
|
|
Elevation
|
NASA DEM
|
NASA, 2022
|
30 m
|
|
Remote sensing
image
|
Remote sensing
image dataset of the
continental coastal zone in the
East China Sea
|
USGS, 2025
|
30 m
|
|
Soil
|
World Soil
Database 2.0 (HWSD 2.0)
|
FAO & IIASA, 2023
|
1:106
|
|
Social economy
|
Dataset of the
spatial distribution of
China’s population in kilometer grids
|
Oak Ridge National
Laboratory of the U.S. Department of Energy, 2024
|
1,000 m
|
|
Annual dataset of
China’s nighttime
lights
|
Chinese Academy of
Sciences Center for Resources and Environmental Sciences and Data Management,
Xu, 2022
|
500 m
|
|
Statistical data
|
Social economy
|
GDP, healthcare,
infrastructure and
other social and economic data
|
Provincial and
Municipal Statistical
Yearbook
|
/
|
 converted to the
WGS_1984_Albers projected coordinate system, while raster data were resampled
to 100 m and aligned at the pixel level. Based on the seven-dimensional framework of risk-resistance- adaptation-recovery-scale-density-morphology,
previous studies, the actual conditions
of the continental coastal zone of the ECS, and data availability, an
ecological resilience assessment indicator system was constructed. A combined
weighting method integrating the fuzzy analytic hierarchy process (FAHP) and
the CRITIC method was adopted, and the final weights were determined according
to the principle of Lagrange conditional extrema. The ecological resilience
index and its associated data products were then generated through weighted
integration using the composite index method (Figure 1).
converted to the
WGS_1984_Albers projected coordinate system, while raster data were resampled
to 100 m and aligned at the pixel level. Based on the seven-dimensional framework of risk-resistance- adaptation-recovery-scale-density-morphology,
previous studies, the actual conditions
of the continental coastal zone of the ECS, and data availability, an
ecological resilience assessment indicator system was constructed. A combined
weighting method integrating the fuzzy analytic hierarchy process (FAHP) and
the CRITIC method was adopted, and the final weights were determined according
to the principle of Lagrange conditional extrema. The ecological resilience
index and its associated data products were then generated through weighted
integration using the composite index method (Figure 1).
Table 3 Ecological resilience assessment
indicator system
|
Criterion layer
|
Indicator layer
|
Indicators
|
Meaning
|
|
Process
|
Risk
|
Land use intensity
|
X1(–)
|
Land pressure
|
|
Coastalline
artificialization index
|
X2(–)
|
Coastaline development pressure
|
|
Landscape
ecological risk index
|
X3(–)
|
Ecological security level
|
|
Population density
(persons/km2)
|
X4(–)
|
Population pressure
|
|
PM2.5
concentration (μg/m3)
|
X5(–)
|
Air pollution threat
|
|
Industrial wastewater discharge per unit of GDP
(tons per 10,000 CNY)
|
X6(–)
|
Water pollution threat
|
|
Electricity
consumption per unit of GDP
(kWh/10,000 CNY)
|
X7(–)
|
Energy utilization level
|
|
Typhoon hazard
level
|
X8(–)
|
Typhoon threat level
|
|
Geological
disaster susceptibility
|
X9(–)
|
Geological disaster threat level
|
|
Resistance
|
Water conservation
capacity (mm)
|
X10(+)
|
Water conservation capacity
|
|
Nutrient transport
ratio
|
X11(+)
|
Water purification capacity
|
|
Soil retention
quantity (t/(km2·a))
|
X12(+)
|
Soil retention capacity
|
|
Habitat quality
|
X13(+)
|
Environmental quality level
|
|
Carbon
sequestration capacity (tc/km2)
|
X14(+)
|
Carbon storage capacity
|
|
NPP
|
X15(+)
|
Strength of ecosystem functions
|
|
Biodiversity index
|
X16(+)
|
Biodiversity level
|
|
Adaptation
|
Landscape
adaptability
|
X17(+)
|
Landscape adaptation level
|
|
Landscape
heterogeneity
|
X18(+)
|
Variation in landscape space level
|
|
Landscape
connectivity
|
X19(+)
|
Landscape connectivity degree
|
|
Landscape
stability
|
X20(+)
|
Landscape stability degree
|
|
Atmospheric
aerosol concentration
|
X21(–)
|
Situation of air pollution control
|
|
Concentration rate
of sewage treatment (%)
|
X22(+)
|
Situation of water environment governance
|
|
Recovery
|
Ecosystem service
value (CNY/km2)
|
X23(+)
|
Potential ecological restoration
|
|
Ecological
resilience index
|
X24(+)
|
Ecological self-regulation capacity
|
|
Proportion of environmental protection investment in GDP (%)
|
X25(+)
|
Government regulation level
|
|
Trend of
vegetation coverage change (%)
|
X26(+)
|
Trend of ecological vitality recovery
|
|
Trend of humidity
change (%)
|
X27(+)
|
Trend of water ecosystem restoration
|
|
Trend of nighttime light intensity changes (%)
|
X28(–)
|
Trend of socio-economic disruptions
|
|
Per capita expenditure on science and education (CNY)
|
X29(+)
|
Scientific education level
|
|
Background
|
Scale
|
Scale resilience
index
|
X30(+)
|
Appropriateness of urban size
|
|
Density
|
Ecological
supply-demand level
|
X31(+)
|
Supporting capacity of ecosystem resources and environment
|
|
Morphology
|
Average distance
index
|
X32(+)
|
Rationality of ecological space layout
|
4 Data Results and Validation
4.1
Dataset Composition
The
dataset is archived in .tif and .xlsx formats and includes the following data
at 5-year intervals from 2000 to 2022: (1) the spatial distribution of the
ecological resilience index; (2) data for 7 assessment subsystems, including
scale, density, morphology, risk, resistance, adaptation, and recovery; and (3)
regional statistical data for the ecological resilience index and statistical
data for each subsystem. Among these, the spatial data have a resolution of 100
m.
4.2 Data
Results Analysis
The spatial pattern of
ecological resilience in the continental coastal zone of the ECS remained
generally stable from 2000 to 2022 (Figure 2), exhibiting a persistent gradient
characterized by lower values in the northeast and higher values in the
southwest. High-value areas were distributed contiguously across southern
Zhejiang, northern Fujian, and parts of southern Fujian, whereas low-value
areas remained concentrated in Shanghai and the core development belt extending
from northern Zhejiang to central Fujian. This indicates that the dominant
spatial differentiation pattern did not undergo a fundamental reversal during
the study period. Meanwhile, the spatial clustering pattern showed a weakening
trend, with the overall extent of hotspot and coldspot patches shrinking and
non-significant areas expanding, suggesting a certain degree of regional
convergence. The spatial center of gravity also shifted slightly southwestward,
further indicating that the overall distributional direction remained stable
while the internal structure underwent gradual adjustment.
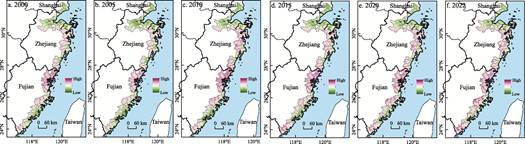
Figure 2 Maps of the spatial pattern evolution of ecological
resilience in the continental coastal zone of the East China Sea, 2000–2022
The driving mechanisms can be
explained by the combined effects of natural background conditions, development
pressure, and governance responses. Southern Zhejiang and northern/southern
Fujian have relatively high proportions of hilly and mountainous terrain,
greater shares of ecological land, and stronger ecosystem service provision
capacity, which provide a solid baseline support for ecological resilience. In
contrast, Shanghai and northern Zhejiang are marked by highly concentrated
populations and industries, while shoreline artificialization and land
development intensity have long remained at high levels, continuously
compressing ecological space and weakening ecosystem structure and functions,
thereby giving the low-value belt a strong path-dependent character. After
2005, strengthened ecological governance, improved green infrastructure, and
pollution control measures helped to alleviate risk pressures and enhance
system adaptability, gradually blurring the boundaries between high- and
low-value areas and promoting regional convergence. However, the rigid
constraints imposed by high-intensity development meant that the overall
evolution still manifested as local optimization under a broadly stable spatial
pattern.
A comparison across the three administrative scales of
province, prefecture-level city, and county reveals that ecological resilience
in the continental coastal zone of the ECS exhibits strong temporal consistency
and a typical scale effect in space (Figure 3). At the provincial scale, Fujian
and Zhejiang remained above the regional average, whereas Shanghai persistently
exhibited relatively low level. A widespread temporary decline occurred in
2005, followed by an overall recovery and continued upward trend after 2010.
This synchronous fluctuation reflects the combined influence of shared
macro-development stages and governance rhythms on regional systems. At the
prefecture-level city scale, the internal differences masked by provincial
averages become more apparent. Cities in southern Zhejiang, northern Fujian,
and parts of southern Fujian generally exhibited higher ecological resilience,
whereas lower values were observed in the northern core urban agglomerations
and some cities in central Fujian, thus maintaining the stable gradient pattern
of lower values in the northeast and higher values in the southwest across the
study area.
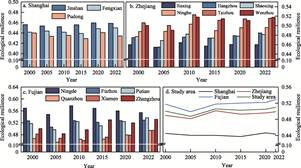
Figure 3 Temporal evolution of ecological resilience
in the continental coastal zone of the East China Sea, 2000–2022
Heterogeneity is most pronounced at the county scale.
Even within the same provincial governance framework, different functional
zones still show persistent differentiation due to variations in development
intensity and ecological spatial structure. The driving mechanisms can be
summarized as the combined effects of natural background conditions,
development pressure, and governance response. Hilly and mountainous areas
generally have higher proportions of ecological land and stronger ecosystem
service provision capacity, thereby forming a more favorable resilience
foundation. By contrast, areas with highly concentrated population and industry
are more likely to remain locked into low-values under the long-term
constraints of shoreline artificialization and high-intensity land development.
Meanwhile, urban expansion weakens baseline elements such as scale and
morphology and reduces system resistance, making resilience improvement more
structurally constrained. After 2005, strengthened ecological governance, improved
green infrastructure, and pollution control measures helped to alleviate risk
pressure and enhance system adaptability to some extent, leading to resilience
recovery in most administrative units. However, external shocks and shifts in
development orientation still generated periodic disturbances in the recovery
process, allowing differentiation across scales to persist despite the overall
upward trend.
From 2000 to 2022, the ecological resilience subsystems
in the continental coastal zone of the ECS exhibited an evolutionary pattern
characterized by a weakening resilience baseline but a fluctuating recovery in
resilience processes (Figure 4). In terms of the resilience baseline, both
scale and morphology declined continuously, indicating that ongoing
urbanization and the outward expansion of construction land progressively
compressed ecological space, reduced the supporting extent of ecological
infrastructure, and led to the deterioration of spatial patterns. Meanwhile,
density increased markedly after 2005, largely because strengthened ecological
governance and a shift toward more intensive and green development improved the
relationship between ecological supply and demand to some extent. However, this
positive effect was insufficient to offset the negative impacts associated with
declines in scale and morphology, and the baseline level therefore continued to
show a gradual downward trend.
With respect to ecological processes, risk first
declined and then increased. Specifically, during 2000–2005, it decreased under
the influence of intensified development disturbance and aggravated landscape
fragmentation, whereas after 2005 it rebounded as improvements in green
infrastructure and pollution measures helped alleviate risk pressure. Resistance
showed an overall decline, indicating that ecosystem structure, ecosystem
functions, and ecosystem service provision capacity were continuously weakened
under long-term high-intensity development. Adaptation increased significantly,
mainly because enhanced policy intervention and management responses improved
the system’s adaptive capacity. Recovery increased before 2015 but declined
thereafter. The earlier increase was associated with ecological restoration
promoted by environmental investment and technological progress, whereas the
subsequent decline was related to the post-pandemic shift in governance
priorities toward economic recovery, together with construction expansion that
weakened the ecosystem’s self-regulation capacity. Overall, the stage-specific
improvement in process performance was driven by alleviated risk pressure and
enhanced adaptation, whereas the continued weakening of the resilience baseline
and resistance imposed long-term constraints on overall ecological resilience.
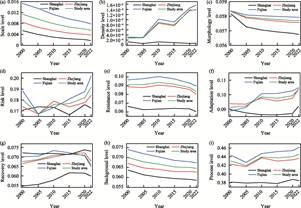
Figure 4 Temporal evolution of ecological
resilience subsystems in the continental coastal zone of the East China Sea,
2000–2022
5 Discussion and Conclusions
This study integrates
multi-source remote sensing raster data and socioeconomic statistics to
construct an ecological resilience indicator system based on the ecological
baseline-process framework and generates data products of ecological resilience
and its subsystems for 2000–2022 through a combined subjective-objective
weighting scheme and composite index integration. The results show that
ecological resilience in the continental coastal zone of the ECS exhibited
stage-specific fluctuations but an overall upward trend, reaching a low point
in 2005 and improving steadily after 2010. Spatially, it maintained a gradient
pattern characterized by lower values in the northeast and higher values in the
southwest. High-value areas were mainly distributed in southern Zhejiang,
northern Fujian, and parts of southern Fujian, whereas low-value areas were
concentrated in Shanghai and the core development belt extending from northern
Zhejiang to central Fujian. Provincial averages tend to smooth internal differences,
while prefecture-level city and county scales are better able to reveal
resilience differentiation resulting from variations in functional zoning and
development intensity. The ecological resilience subsystems also showed
divergent developmental trends: scale declined continuously, density fluctuated
upward, morphology decreased progressively, risk decreased first and then
increased, resistance fluctuated downward, adaptation fluctuated upward, and
recovery increased first and then declined. Overall, the stage-specific rise in
process performance was driven by alleviated risk pressure and enhanced
adaptation, whereas the continued weakening of the baseline and resistance
imposed long-term constraints on integrated ecological resilience.
This dataset provides basic data support for
identifying ecological security patterns in coastal zones, territorial spatial
governance zoning, diagnosing resilience shortcomings, and conducting
cross-scale comparative studies. It can also be coupled with thematic datasets
on disaster processes, ecological restoration, and carbon sink assessment for
scenario simulation and policy effectiveness evaluation. However, constrained
by data availability and organization, the
dataset characterizes long-term changes at multi-year intervals and is
therefore less capable of capturing rapid disturbances and recovery following
extreme events. In addition, the spatialization of some socioeconomic
indicators may introduce scale-related errors, and there remains room for improvement
in representing key coastal risks such as storm surges, sea-level rise, and
compound flooding. Future work will incorporate higher-temporal-frequency
remote sensing and process-based data to improve the representation of compound
risks and recovery processes, while also conducting uncertainty quantification
and iterative version updates to enhance the interpretability and
transferability of the dataset. This dataset supported the completion of the first
author’s Master of Science thesis.
Author Contributions
Ying, C. agreed with and adopted Li, J. L.’s overall design scheme for the
dataset development, collected and processed the data, and designed the models
and algorithms. Zhong, J. performed data validation. Liu, Y. C. and Tian, P.
provided guidance and revisions on the overall framework of the dataset. Ying,
C. completed the first draft of the data paper, and all authors jointly revised
the paper.
Conflicts
of Interest
The authors
declare no conflicts of interest.
References
[1]
Guan,
Q. C., Zhou, X., Liu, L. M., et al. Evolution characteristics and
catastrophe mechanisms of ecosystem resilience in the Yellow River Delta from
1990 to 2023 [J]. Acta Ecologica Sinica, 2026, 46(2): 721–741.
[2]
Lotze,
K. H., Lenihan, S. H., Bourque, J. B., et al. Depletion, degradation,
and recovery potential of estuaries and coastal seas [J]. Science, 2006,
312(5781):1806–1809.
[3]
Meng,
H. X., Wang, C. C., Ye, S. F. Spatial resilience of coastal zones from
landscape pattern perspective: connotation, characteristics, key elements, and
pathways for enhancement [J]. Bulletin of Chinese Academy of Sciences,
2025, 40(12): 2124–2137.
[4]
Zhong,
J. Q., Gao, M. F., Zhao, Y. Q., et al. Spatial variation of the cultural
ecosystem services pattern and influencing factors in the coastal areas: evidence
from Ramsar Sites in China [J]. Acta Geographica Sinica, 2024, 79(1): 76–96.
[5]
Wang,
P. J., Song, Y. J., Zhang, J. H., et al. Research on factors affecting
ecosystem health in Beijing-Tianjin-Hebei region and its multi-scenario
simulation based on different spatial scales [J]. Acta Ecologica Sinica,
2025, 45(18): 8986–8999.
[6]
Chen,
C. Y., Jia, X., Zhao, Y. H., et al. Ecological zoning of Hexi Corridor,
Northwest China with coupled ecosystem service value and ecological risk
assessment [J]. The journal of applied ecology, 2026, 37(1): 213–222.
[7]
Ying,
C., Li, J. L., Liu, Y. C., et al. Spatio-temporal relationship and
influencing factors between ecological resilience of coastal zone and land use
intensity: a case study of Xieqian Port, Ningbo [J]. Acta Ecologica Sinica,
2026, 46(2): 753–770.
[8]
Zhang,
H. T., Li, J. L., Liu, Y. C. Spatiotemporal evolution of the resilience of the
coastal complex ecosystem in the East China Sea from 2001 to 2020 [J]. Marine
Science Bulletin, 2024, 43(1): 127–139.
[9]
Ma, C.
W., Wen, C. X. A review of research on coastal resilience in adapting to
climate change—based on bibliometric analysis [J]. Acta Ecologica Sinica,
2024, 44(5): 2173–2186.
[10] Ge, M., Xu, J. J., Xu, Y. M., et al.
Mechanisms of multi-factor matching on coastal human-nature system resilience
from perspective of land-sea coordination: a case study of Bohai Rim Region [J].
Resources Science, 2025, 47(9): 1958–1975.
[11]
Li, J.
L., Tian, P., Shao, S. Y., et al. East China Sea coastline dataset
(1990–2015) [J]. Journal of Global Change Data & Discovery,
2019, 3(3): 252–258. DOI: 10.3974/geodp.2019.03.05.
[12] Ying, C., Li, J. L., Liu, Y. C., et al.
The spatiotemporal evolution and influencing factors of resilience of
county-level cities in the East China Sea coastal zone based on “background-operation-efficiency” [J]. Acta
Geographica Sinica, 2024, 79(2): 462–483.
[13]
Ying,
C., Liu, Y. C., Tian, P., et al. Dataset of ecological resilience of the
continental coast of theEast China Sea
(2000–2022) [J]. Digital Journal of Global Change Data Repository, 2026.
https://doi.org/10.3974/geodb.2026.02.09.V1.
[14] GCdataPR Editorial Office. GCdataPR data
sharing policy [OL]. https://doi.org/10.3974/dp.policy.2014.05
(Updated 2017).
[15] Sun, Q., Hu, Z. H., Zhang, J., et al.
Evaluation of ecological service benefits of the plain reservoirs along the
Eastern Route of the South-to-North Water Transfers Project: a case study of
Datun Reservoir [J]. South-to-North Water Transfers and Water
Science & Technology, 2023, 21(6): 1213–1222.