Modeling
Dataset Development of Qinghai-Xizang Plateau Soil Moisture (2015–2100)
Song, Q.1 Liu, Y. X. Y.2* Xu, H. Z.3 Zhang,
H. F.4 Zhu, G. L.4
Fu, X. P.4
1. Beijing Forestry University, Beijing
100101, China;
2. Institute
of Geographic Sciences and Natural Resources Research, Chinese Academy of
Sciences, Beijing 100101, China;
3. The Second Geological Brigade of the Xizang
Autonomous Region Bureau of Geology and Mineral Exploration
and Development, Lhasa 850000, China;
4. Monitoring Center for Ecological Environment of Xizang
Autonomous Region, Lhasa 850000, China
Abstract: Qinghai-Xizang Plateau plays a
crucial role in regional water cycles and ecosystem functioning through its
surface soil moisture dynamics. This study developed a surface soil moisture
dataset for the Qinghai-Xizang Plateau covering the period from 2015 to 2100
with a spatial resolution of 0.1°×0.1°. First, in situ measurements from
the MAQU, NAQU, and NGARI networks were used to evaluate the accuracy of 21
CMIP6 soil moisture datasets, along with SMAP and ERA5-Land products, using
bias, correlation coefficient (R), root mean square error (RMSE), and
unbiased RMSE (ubRMSE). Meanwhile, the Enhanced Triple Collocation (ETC) method
was employed to obtain random error standard deviation (RESD) and correlation
coefficient (CC), based on which 4 Earth system models were selected for data
fusion. Second, SMAP and ERA5-Land datasets were fused using differential
weighting guided by the ETC evaluation results, and the optimal fusion result
was identified. Finally, a Random Forest algorithm was used to integrate
multiple sources of explanatory variables for monthly model training, and the
model’s prediction accuracy was validated against in situ observations.
The resulting dataset includes: (1) monthly soil moisture data under 4 Shared
Socioeconomic Pathways (SSP1-2.6, SSP2-4.5, SSP3-7.0, and SSP5-8.5) from 2015
to 2100 at 0.1° spatial resolution; (2) monthly in situ measurements (0–0.1
m depth) from the MAQU, NAQU, and NGARI networks. The dataset is archived in .mdd, .tif, .shp, and .csv formats, consisting of 4,838
data files with data size of 0.99 GB (compressed into 1 file with data size of
315 MB). Results indicate that compared to the original CMIP6 model outputs,
the fused product exhibits significantly higher accuracy and lower error,
enhancing the characterization of soil moisture dynamics over the
Qinghai-Xizang Plateau.
Keywords: Qinghai-Xizang Plateau; surface
soil moisture; future multi-scenario; random forest; fusion
DOI: https://doi.org/10.3974/geodp.2025.04.03
Dataset Availability Statement:
The dataset supporting this paper
was published and is accessible through the Digital Journal of Global Change Data Repository
at: https://doi.org/10.3974/geodb.2025.10.05.V1.
1 Introduction
Soil
moisture (SM) is a pivotal variable in the terrestrial hydrological cycle and
land-atmosphere energy exchange, extensively influencing ecosystem functioning,
water resource distribution, agricultural productivity, and climate feedback processes[1,2]. On the Qinghai-Xizang
Plateau—a geologically complex and ecologically fragile region often referred
to as the “Water Tower of Asia”—the spatiotemporal dynamics of soil moisture
not only regulate surface evapotranspiration and permafrost processes but also directly
affect regional ecological security and climate change responses[3,4].
Although multiple
data sources are available, including remote sensing retrievals, reanalysis
datasets, and model simulations, each single source is often limited by
inconsistent spatial-temporal coverage, error biases, and lack of physical coherence[5–7]. For instance, the Soil
Moisture Active Passive (SMAP) satellite provides high spatial resolution soil
moisture products[8], but suffer
from short temporal coverage and spatial gaps. In contrast, the ERA5-Land
dataset from the European Centre for Medium-Range Weather Forecasts (ECMWF)[9] offers long-term reanalysis data
but exhibits spatial heterogeneity in accuracy. Meanwhile, the Coupled Model
Intercomparison Project Phase 6 (CMIP6)[10]
supplies multi-model, multi-scenario projections of future climate conditions,
forming an important basis for long-term soil moisture trend analysis. However,
significant discrepancies exist in simulation performance across different
CMIP6 models, necessitating a rigorous model selection and fusion process.
In recent years,
multi-source data fusion has emerged as an effective strategy for improving the
accuracy and spatial consistency of soil moisture predictions. Among available
approaches, the Enhanced Triple Collocation (ETC) method enables robust quantification
of random errors between datasets[11],
while machine learning algorithms such as Random Forest (RF) offer strong
nonlinear modeling capacity and scalability, proving effective in soil moisture
retrieval and prediction tasks[12].
Furthermore, the
Qinghai-Xizang Plateau is particularly sensitive to climate change. Variations
in soil moisture directly impact alpine grasslands, permafrost layers, and
regional ecological patterns[13].
Hence, access to high-accuracy, long-term soil moisture data that also account
for future climate scenarios is essential for advancing regional climate
simulations.
To address this
need, this study focuses on the Qinghai-Xizang Plateau and develops a fused
soil moisture dataset by integrating remote sensing data, reanalysis products,
and multi-model CMIP6 soil moisture simulation data. Using in situ
station observations and the ETC method for accuracy assessment, and training
monthly Random Forest models under multiple Shared Socioeconomic Pathway (SSP)
scenarios. The final product is a 0.1° spatial resolution surface soil moisture
dataset spanning 2015 to 2100, intended to serve as a reliable data foundation
for research on climate change, water resources management, and ecosystem
dynamics on the Qinghai-Xizang Plateau.
2 Metadata of the Dataset
The
metadata of Qinghai-Xizang Plateau soil moisture modeling dataset (2015–2100)[14] is summarized in Table 1. It
includes the dataset full name, short name, authors, year of the dataset,
temporal resolution, spatial resolution, data format, data size, data files,
data publisher, and data sharing policy, etc.
Table
1 Metadata summary of the Qinghai-Xizang Plateau soil moisture
modeling dataset (2015–2100)
|
Items
|
Description
|
|
Dataset full name
|
Qinghai-Xizang Plateau soil moisture
modeling dataset (2015–2100)
|
|
Dataset short
name
|
QZP_RF_SoilMoisture_2015-2100
|
|
Authors
|
Song, Q., Beijing
Forestry University, songqianxb@bjfu.edu.cn
|
|
|
Liu, Y. X. Y.,
Institute of Geographic Sciences and Natural Resources Research, Chinese
Academy of Sciences, lyxy@lreis.ac.cn
|
|
|
Xu, H. Z., The
Second Geological Brigade of the Tibet Autonomous Region Bureau of Geology
and Mineral Exploration and Development, 452449161@qq.com
|
|
|
Zhang, H. F.,
Monitoring Center for Ecological Environment of Tibet Autonomous Region,
zhf0891@163.com
|
|
|
Zhu, G. L.,
Monitoring Center for Ecological Environment of Tibet Autonomous Region,
17789906283@163.com
|
|
|
Fu, X. P.,
Monitoring Center for Ecological Environment of Tibet Autonomous Region,
359946719@qq.com
|
|
Geographical
region
|
Qinghai-Xizang
Plateau (approximately 26°N–40°N, 73°E–105°E)
|
|
Year
|
2015–2100
|
|
Temporal resolution
|
Month
|
|
Spatial resolution
|
0.1°×0.1°
|
|
Data format
|
.mdd, .tif, .shp, .csv
|
|
|
|
Data size
|
315 MB (compressed)
|
|
|
|
Data files
|
(1) Monthly surface soil moisture spatial
distribution data from 2015 to 2100 under 4 SSP scenarios: SSP1-2.6,
SSP2-4.5, SSP3-7.0, and SSP5-8.5, with a spatial resolution of 0.1°; (2)
Monthly in situ soil moisture observations (0–0.1 m depth) from 3
networks: MAQU, NAQU, and NGARI
|
|
Foundation
|
National Natural
Science Foundation of China (42571539)
|
|
Data publisher
|
Global Change Research Data Publishing & Repository,
http://www.geodoi.ac.cn
|
|
Address
|
No. 11A, Datun
Road, Chaoyang District, Beijing 100101, China
|
|
Data sharing
policy
|
(1) Data are openly available and can be
free downloaded via the Internet; (2) End users are encouraged to use Data subject to citation; (3) Users,
who are by definition also value-added service providers, are welcome to
redistribute Data subject to written permission from the GCdataPR Editorial
Office and the issuance of a Data
redistribution license; and (4) If Data
are used to compile new datasets, the “ten percent principal” should be
followed such that Data records
utilized should not surpass 10% of the new dataset contents, while sources
should be clearly noted in suitable places in the new dataset[15]
|
|
Communication and searchable system
|
DOI, CSTR,
Crossref, DCI, CSCD, CNKI, SciEngine, WDS, GEOSS, PubScholar, CKRSC
|
3 Methods
3.1 Data Sources
(1)
CMIP6 simulation data
This study
employed surface (0–10 cm) soil moisture data from 21 Earth system models
provided by the CMIP6[16], covering the period from 2015 to 2100 and
4 Shared Socioeconomic Pathways (SSPs): SSP1-2.6 (sustainability pathway),
SSP2-4.5 (middle-of- the-road pathway), SSP3-7.0 (regional rivalry pathway),
and SSP5-8.5 (fossil-fueled development pathway). The participating models and
their originating institutions include: ACCESS-CM2 (Bureau of Meteorology,
Australia), BCC-CSM2-MR (China Meteorological Administration, China),
CAMS-CSM1-0 (Chinese Academy of Sciences, China), CanESM5-CanOE (Environment
and Climate Change Canada, Canada), CESM2 (National Center for Atmospheric Research, USA), CMCC-CM2-SR5
(Euro-Mediterranean Center on Climate Change, Italy), CNRM-CM6-1,
CNRM-CM6-1-HR, CNRM-ESM2-1 (Météo- France, France), EC-Earth3-Veg-LR (EC-Earth
Consortium, Europe), GFDL-ESM4 (Geophysical Fluid Dynamics Laboratory,
USA), IPSL-CM6A-LR (Institute Pierre-Simon Laplace, France), KACE-1-0-G (Korea
Institute of Atmospheric Prediction Systems, South Korea), MIROC6, MIROC-ES2L
(University of Tokyo and Meteorological Agency, Japan), MPI-ESM1-2-LR (Max
Planck Institute for Meteorology, Germany), MRI-ESM2-0 (Meteorological Research
Institute, Japan), NorESM2-LM, NorESM2-MM (Norwegian Climate Centre, Norway),
TaiESM1 (Academia Sinica, China), UKESM1-0-LL (Met Office Hadley Centre, UK).
(2) Remote sensing
and reanalysis data
The Level-3 Soil
Moisture Passive Enhanced product[17]
from the Soil Moisture Active Passive (SMAP) satellite mission was used,
covering the period from March 2015 to April 2025, with a spatial resolution of
approximately 0.25°. A-track and D-track data were merged to generate daily and
monthly soil moisture time series.
The ERA5-Land
reanalysis dataset[18] from the
European Centre for Medium-Range Weather Forecasts (ECMWF) provides monthly
volumetric soil water content in layer 1 (0–7 cm depth), covering January 2015
to April 2025, at a spatial resolution of 0.1°.
(3) In situ
data
In situ soil moisture observations were obtained from 3 networks (MAQU,
NAQU, and NGARI) within the International Soil Moisture Network (ISMN)[19] on the Qinghai-Xizang Plateau
region. The original data are archived in .stm format and contain hourly
records.
First, hourly
records were aggregated daily: if a depth had more than 6 valid hourly records
in a day, the daily average was calculated; if multiple depths within 0–0.1 m
were available, their daily averages were further combined into a single soil
moisture value for that day; otherwise, the value was treated as missing.
Subsequently, daily series were aggregated to monthly values: if a month had at
least 6 valid observation days, the monthly average was calculated; otherwise,
it was considered missing. The resulting monthly in situ soil moisture
data were archived in .csv format.
(4) Auxiliary
variables
Soil property
data were sourced from the Harmonized World Soil Database version 2.0
(HWSD v2.0)[20], including soil
bulk density, clay, silt, sand, and gravel content.
Topographic
factors were elevation data from the Shuttle Radar Topography Mission (SRTM)[21]. Slope, aspect, and
pixel coordinates (latitude and longitude) were calculated based on this
dataset.
Climate factors
were selected from the Global Climate Data Set Version 2.1 (WorldClim Version 2.1)[22], which provides monthly
average values of climate variables such as minimum temperature, average
temperature, maximum temperature, precipitation, solar radiation, wind speed,
and water vapor pressure (1970–2000).
All data were
uniformly resampled to a spatial resolution of 0.1°, with monthly temporal
resolution, and converted into GeoTIFF format, facilitating subsequent modeling
and prediction.
3.2 Technological Route
Figure
1 illustrates the overall workflow of this study, comprising the following 6 steps:
(1) Standardization
of raster data: all dynamic and static variables (including soil moisture,
climate factors, terrain factors, etc.) were uniformly converted to GeoTIFF
format, with spatial resolution resampled to 0.1° and temporal resolution
unified to a monthly scale.
(2) Multi-source
soil moisture data accuracy evaluation: using monthly in situ measurements
as the “true value”, the accuracy of soil moisture data from 21 CMIP6 models,
SMAP, and ERA5-Land was evaluated by calculating metrics including bias,
correlation coefficient (R), root mean square error (RMSE), and unbiased
root mean square error (ubRMSE).
(3) ETC error
quantification analysis: the ETC method was applied to perform unsupervised
error analysis on SMAP, ERA5-Land, and CMIP6 model data, generating correlation
coefficients (CC) and random error standard deviations (RESD) to assist in
model selection and fusion.
(4) Fusion and
selection of target variable: based on the ETC assessment results, SMAP and
ERA5-Land data were fused using a differentiated weighting method. In situ
observations were used to assess the performance of different fusion schemes,
and the optimal fusion result was selected as the target variable.
(5) Random
Forest modeling and prediction: using the optimal SMAP-ERA5 fusion results as
the prediction target (y), and CMIP6 multi-model data, ETC indicators,
climate factors, soil factors, and terrain factors as input variables (x),
a total of 48 monthly Random Forest models were constructed across 4 SSP
scenarios. These models produced a 0.1° resolution, monthly soil moisture
dataset for the Qinghai-Xizang Plateau from 2015 to 2100.
(6) Result validation: the model
prediction results were re-evaluated against in situ measurements using
bias, R, RMSE, and ubRMSE to assess the reliability and accuracy of
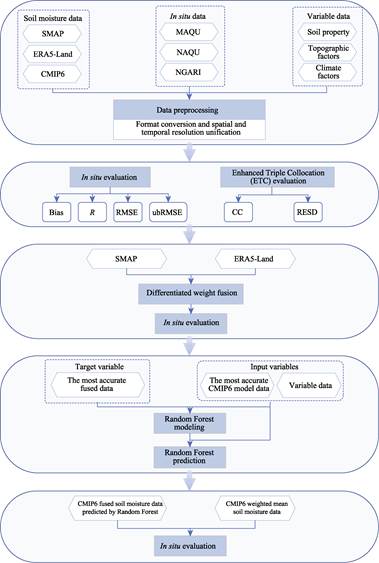
Figure 1 Flowchart of the dataset
development
the
fusion-based prediction models.
As shown in
Figure 2 and Table 2, 4 Earth system models—BCC-CSM2-MR, EC- Earth3-Veg-LR,
MPI-ESM1-2-LR, and TaiESM1—were selected for subsequent modeling based on their
overall performance. Selection criteria included higher R and lower RMSE
from in situ validation, as well as higher CC and lower RESD derived
from ETC analysis.
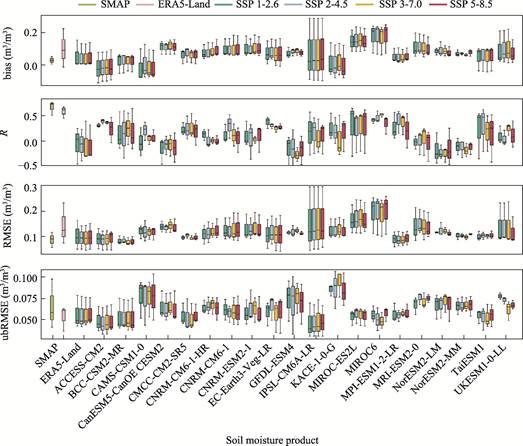
Figure 2 Validation
results of various soil moisture products against in situ observations
Table 2 Mean ETC evaluation
results for each soil moisture product
|
Soil moisture product
|
RESD (m3/m3)
|
CC
|
Soil moisture product
|
RESD (m3/m3)
|
CC
|
|
SMAP
|
0.06
|
0.60
|
ERA5-Land
|
0.04
|
0.53
|
|
ACCESS-CM2
|
0.02
|
0.21
|
IPSL-CM6A-LR
|
0.02
|
0.21
|
|
BCC-CSM2-MR
|
0.02
|
0.31
|
KACE-1-0-G
|
0.07
|
0.36
|
|
CAMS-CSM1-0
|
0.03
|
0.38
|
MIROC-ES2L
|
0.03
|
0.40
|
|
CanESM5-CanOE
|
0.06
|
0.23
|
MIROC6
|
0.03
|
0.33
|
|
CESM2
|
0.03
|
0.22
|
MPI-ESM1-2-LR
|
0.03
|
0.38
|
|
CMCC-CM2-SR5
|
0.03
|
0.29
|
MRI-ESM2-0
|
0.04
|
0.20
|
|
CNRM-CM6-1-HR
|
0.03
|
0.21
|
NorESM2-LM
|
0.03
|
0.27
|
|
CNRM-CM6-1
|
0.03
|
0.22
|
NorESM2-MM
|
0.03
|
0.21
|
|
CNRM-ESM2-1
|
0.03
|
0.20
|
TaiESM1
|
0.03
|
0.34
|
|
EC-Earth3-Veg-LR
|
0.04
|
0.35
|
UKESM1-0-LL
|
0.05
|
0.13
|
|
GFDL-ESM4
|
0.04
|
0.27
|
|
|
|
Based on the ETC
evaluation, SMAP and ERA5-Land data were weighted and fused according to
different weights. Validation against in situ observations indicated
that a weighting ratio of 7:3 (SMAP:ERA5-Land) yielded
higher correlation and lower error. This fused dataset was ultimately selected
as the target variable for the Random Forest modeling.
4 Data Results and Validation
4.1 Dataset Composition
The
dataset consists of the following components: (1) Surface soil moisture data
for the Qinghai-Xizang Plateau based on 4 SSPs (SSP1-2.6, SSP2-4.5, SSP3-7.0,
and SSP5-8.5) from the CMIP6 simulations. The data span from January 2015 to
December 2100, with a monthly temporal resolution and a spatial resolution of
0.1°. The unit of measurement is m3/m3, with values
ranging from 0 to 1. Files are named in the format SSP***_yyyy-mm.tif; (2) In
situ observational data from 3 monitoring networks: MAQU, NAQU, and NGARI.
The dataset is archived in .mdd, .tif, .shp, and .csv
formats, comprising a total of 4,838 files with an uncompressed size of
approximately 0.99 GB (compressed into 1 file with data size of 315 MB).
4.2 Data Products
Figure 3 illustrates the
spatial distribution of surface soil moisture under the 4 SSPs (SSP1-2.6,
SSP2-4.5, SSP3-7.0, and SSP5-8.5), as predicted by the multi-source data fusion
and Random Forest modeling approach. 4 representative months—January, April,
July, and October of 2050—were selected to reflect typical conditions for
winter, spring, summer, and autumn, respectively. The results demonstrate that
the fused CMIP6 soil moisture data exhibit spatial and temporal patterns that
closely align with the seasonal climatic rhythms of the Qinghai-Xizang Plateau.
This indicates the model’s capability to capture the seasonal variability and
spatial heterogeneity of soil moisture across the region, reflecting strong
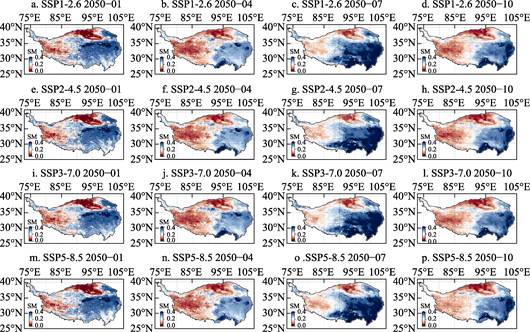
Figure 3 Distribution maps of soil moisture fusion data under four SSPs in Qinghai-Xizang Plateau
(2050)
ecological
and hydrological sensitivity. To ensure the scientific integrity and practical
applicability of the modeled outputs, water body mask data were incorporated
during the fusion and modeling processes to exclude rivers, lakes, glaciers,
and other non-terrestrial surface areas.
4.3 Data Validation
This
study used in situ data as a reference for accuracy evaluation,
assessing the CMIP6 soil moisture fusion data generated through multi-source
fusion and Random Forest methods. The fusion results were compared with the
weighted average of 21 original CMIP6 soil moisture datasets. As shown in Table
3, the fusion data outperformed the simple weighted average in all metrics,
particularly in terms of the R value, demonstrating a stronger fitting
capability. This indicates that the constructed fusion data more accurately
reflects the spatiotemporal variation of actual surface soil moisture,
effectively enhancing the data reliability and applicability. The results
further validate the significant advantage of multi-source data fusion combined
with Random Forest modeling in improving the accuracy of soil moisture
simulation.
Table 3 Accuracy evaluation of CMIP6 soil
moisture fusion data predicted by multi-source integration and Random Forest
methods
|
Soil
moisture monitoring network
|
Evaluation indicators
|
Fused data
|
Weighted average data
|
|
SSP
1-2.6
|
SSP
2-4.5
|
SSP
3-7.0
|
SSP
5-8.5
|
SSP
1-2.6
|
SSP
2–4.5
|
SSP
3-7.0
|
SSP
5-8.5
|
|
MAQU
|
Bias (m3/m3)
|
0.07
|
0.07
|
0.07
|
0.07
|
0.02
|
0.02
|
0.02
|
0.02
|
|
R
|
0.56
|
0.59
|
0.61
|
0.58
|
0.10
|
0.10
|
0.07
|
0.09
|
|
RMSE (m3/m3)
|
0.10
|
0.10
|
0.10
|
0.10
|
0.11
|
0.11
|
0.11
|
0.11
|
|
ubRMSE (m3/m3)
|
0.06
|
0.06
|
0.06
|
0.06
|
0.07
|
0.07
|
0.07
|
0.07
|
|
NAQU
|
Bias (m3/m3)
|
0.16
|
0.16
|
0.16
|
0.16
|
0.07
|
0.08
|
0.08
|
0.08
|
|
R
|
0.46
|
0.44
|
0.49
|
0.43
|
0.22
|
0.26
|
0.24
|
0.22
|
|
RMSE (m3/m3)
|
0.17
|
0.17
|
0.17
|
0.17
|
0.11
|
0.12
|
0.11
|
0.11
|
|
ubRMSE (m3/m3)
|
0.06
|
0.06
|
0.06
|
0.06
|
0.06
|
0.06
|
0.06
|
0.06
|
|
NGARI
|
Bias (m3/m3)
|
0.00
|
0.01
|
0.01
|
0.01
|
0.13
|
0.13
|
0.13
|
0.13
|
|
R
|
0.67
|
0.66
|
0.64
|
0.67
|
0.02
|
0.05
|
0.00
|
–0.06
|
|
RMSE (m3/m3)
|
0.05
|
0.05
|
0.05
|
0.05
|
0.15
|
0.15
|
0.15
|
0.14
|
|
ubRMSE (m3/m3)
|
0.03
|
0.03
|
0.03
|
0.03
|
0.05
|
0.06
|
0.05
|
0.05
|
5 Discussion and Conclusion
Soil
moisture, as an important mediator of land-atmosphere interactions, plays a
crucial role in regional climate, water resource allocation, and ecosystem
stability. Faced with the dual challenges of increasingly severe climate change
and the vulnerability of high-altitude ecosystems, obtaining long-term,
multi-scenario, and regional high-resolution surface soil moisture information
has become an urgent requirement for hydrological and environmental research.
Focusing on the Qinghai-Xizang Plateau, this study selected the 4 best-performing
CMIP6 Earth system models based on in situ observations and ETC
evaluation. Combined with the ETC-derived metrics, SMAP and ERA5-Land products
were fused with differentiated weights to construct the target variable for
Random Forest modeling. With the assistance of multi-source static and dynamic
variables such as climate, topography, and soil properties, monthly Random
Forest models were trained, resulting in a surface soil moisture dataset with a
spatial resolution of 0.1°, covering the period 2015–2100 under 4 future
scenarios. Validation against in situ data indicates that the fused
dataset significantly outperforms simple weighted averages in terms of
correlation and error metrics, demonstrating strong robustness and
reliability.
This dataset not
only provides data support for future studies on the hydrological cycle and
ecological evolution of the Qinghai-Xizang Plateau, but can also be applied to
multiple research fields such as ecosystem response, permafrost change
monitoring, and high-altitude ecological vulnerability assessment.
Additionally, it offers a replicable methodological framework and practical
example for multi-scenario, multi-source data-driven geoscience modeling in
similar regions.
Author Contributions
Song, Q. processed and
analyzed the data and wrote the data paper; Liu, Y. X. Y. designed the overall
development of the dataset; Xu, H. Z., Zhang, H. F., Zhu, G. L., and Fu, X. P.
collected and organized the data.
Conflicts of Interest
The
authors declare no conflicts of interest.
References
[1]
Wang, Y. J., Yu, D. Y., Zhou,
Z. Y. Review of research progress and modeling of hydrological processes in the
cold regions of the Qinghai-Xizang Plateau [J]. Glaciers and Frozen Soil,
2024, 46(4): 1312–1328.
[2]
Seneviratne, S. I., Corti, T.,
Davin, E. L., et al. Investigating soil moisture-climate interactions in
a changing climate: a review [J]. Earth-Science Reviews, 2010:
99(3–4): 125–161.
[3]
Cui, J. J., Xin, Z. B., Huang,
Y. Z. The spatiotemporal variations in freeze-thaw erosion in 2003–2020 on the
Qinghai-Tibet Plateau [J]. Acta Ecologica Sinica, 2023, 43(11):
4515–4526.
[4]
Yang, K., Wu, H., Qin, J., et
al. Recent climate changes over the Tibetan Plateau and their impacts on
energy and water cycle: a review [J]. Global and Planetary Change, 2014,
112(1): 79–91.
[5]
Li, Z. J., Chen, J. P., Liu, Y.
M., et al. Advances in remote sensing inversion of soil moisture [J]. Journal
of Beijing Normal University (Natural Science Edition), 2020, 56(3):
474–481.
[6]
Tan, X. D., Pang, Z, G., Jiang,
W., et al. Advances and trends in microwave inversion methods for soil
moisture [J]. Journal of Earth Information Sciences, 2021, 23(10):
1728–1742.
[7]
Dorigo, W., Wagner, W., Albergel, C., et al. ESA CCI soil moisture
for improved Earth system understanding: state-of-the art and future
directions [J]. Remote Sensing of Environment, 2017, 203: 185–215.
[8]
Entekhabi, D., Njoku, E. G., O’Neill,
P. E., et al. The Soil Moisture Active Passive (SMAP) mission [J]. Proceedings
of the IEEE, 2010, 98(5): 704–716.
[9]
Muñoz-Sabater, J., Dutra, E.,
Agustí-Panareda,
A., et al. ERA5-Land: a state-of-the-art global reanalysis dataset for
land applications [J]. Earth System Science Data, 2021, 13(9):
4349–4383.
[10]
Eyring, V., Bony, S., Meehl, G.
A., et al. Overview of the Coupled Model Intercomparison Project Phase 6
(CMIP6) experimental design and organization [J]. Geoscientific Model
Development, 2016, 9(5): 1937–1958.
[11]
McColl, K. A., Vogelzang, J.,
Konings, A. G., et al. Extended triple collocation: estimating errors
and correlation coefficients with respect to an unknown target [J]. Geophysical
Research Letters, 2014, 41(17): 6229–6236.
[12]
Fu, P. F., Yang, X. J., Jiang,
B., et al. Construction and application of a high-resolution soil
moisture simulation model integrating multi-source data [J]. Transactions of
the Chinese Society of Agricultural Engineering, 2025, 41(5): 96–106.
[13]
Fan, K. K., Zhang, Q., Shi, P.
J., et al. Evaluation of remote sensing and reanalysis soil moisture
products on the Tibetan Plateau [J]. Acta Geographica Sinica, 2018,
73(9): 1778–1791.
[14]
Song, Q., Liu, Y. X. Y., Xu, H.
Z., et al. Qinghai-Xizang Plateau soil moisture modeling dataset (2015–2100)
[J/DB/OL]. Digital Journal of Global Change Data Repository, 2025.
https://doi.org/10.3974/geodb.2025. 10.05.V1.
[15]
GCdataPR Editorial Office.
GCdataPR data sharing policy [OL]. https://doi.org/10.3974/dp.policy.2014.05
(Updated 2017).
[16]
World
Climate Research Programme. Coupled Model Intercomparison Project Phase 6
(CMIP6) soil moisture data [J/DB/OL]. Earth System Grid Federation,
2016. https://esgf-node.llnl.gov/projects/cmip6/.
[17]
O’Neill,
P. E., Chan, S., Njoku, E. G., et al. SMAP enhanced L3 radiometer global
daily 9 km EASE-grid soil moisture, version 4 [J/DB/OL]. NASA National Snow
and Ice Data Center Distributed Active Archive Center, 2020.
https://doi.org/10.5067/NJ34TQ2LFE90.
[18]
Muñoz
Sabater, J. ERA5-Land hourly data from 1950 to present [J/DB/OL]. Copernicus
Climate Change Service (C3S) Climate Data Store (CDS),
2019. https://doi.org/10.24381/cds.e2161bac.
[19]
Dorigo,
W., Wagner, W., Albergel, C., et al. International Soil Moisture
Network (ISMN) [J/DB/OL]. TU Wien/ESA, 2021.
https://ismn.earth/en/.
[20]
Food
and Agriculture Organization of the United Nations (FAO), International
Institute for Applied Systems Analysis (IIASA)/ISRIC-World Soil Information, Institute
of Soil Science-Chinese Academy of Sciences (ISSCAS), Joint Research Centre of
the European Commission (JRC). Harmonized World Soil Database (HWSD) version
2.0 [DB/OL]. FAO, 2021.
https://www.fao.org/soils-portal/data-hub/soil-maps-and- databases/harmonized-world-soil-database-v12/en/.
[21]
Farr, T. G., Rosen, P. A.,
Caro, E., et al. NASA Shuttle Radar Topography Mission Global 1 arc
second data [J/DB/OL]. NASA EOSDIS Land Processes DAAC, 2013.
https://doi.org/10.5067/MEaSUREs/SRTM/ SRTMGL1.003.
[22]
Fick, S. E., Hijmans, R. J.
WorldClim Version 2.1: global climate and weather data for 1970–2000 [J/DB/OL].
WorldClim, 2017. https://www.worldclim.org/data/worldclim21.html.