Dataset of Multi-satellite Synchronous and
Collaborative Observation in Zhangye (2013)
Li, G. Q.1 Zhang, H.1 Xie, J. B.1* Yuan, F. Y.1 Li, H. W.1,4 Qian, J. M.2
Wan, W.3 Ma, G. B.1
1. Institute of Remote Sensing and Digital Earth, Chinese Academy of Sciences, Beijing 100094, China;
2. National Satellite Meteorological Centre, China Meteorological Administration, Beijing 100081, China;
3. China Centre for Resources Satellite Data and Application, Beijing 100094, China;
4. Central South University, Changsha 410083, China
Abstract: With more and more Earth Observation (EO) satellites on-orbit operation, it is especially important to conduct the experiment of multi-satellite synchronous and collaborative observation with ground synchronous measurement. And it is quite valuable for the research on the radiation normalization of multi-source EO data, validation of satellite products, inversion and scaling, su-pported by precise satellite sensors planning and control technology. In June 2013, we conducted a multi-satellite synchronous and collaborative observation with synchronous ground in-situ experiment in suburbs of Zhangye city. The terrain Features in this area are diverse (Including urban areas, mountains, deserts, forests and crop fields), which can meet the requirements of the synchronous experiment. Satellites sensors and ground instruments are used to perform synchronous and collaborative observation. Synchronous EO data and ground in-situ data are obtained inclu-ding 10 satellites, 22 sensors and 3 types of ground observation instruments. In this paper, the synchronous observation dataset in Zhangye is introduced in detail including the measurement aim and method, data processing procedures and results, and data available range.
Keywords: Satellites synchronous and collaborative observation; Multi-satellite radiometric normalization; Joint satellite-ground observation; Zhangye experimental area
1 Introduction
Remote sensing (RS) data obtained from Earth Observation (EO) satellites has been widely used in many fields. As the quantity and category of Earth observation satellites increases, the spatial coverage is getting more broad, the temporal extent is more consistent and the spectral and spatial resolution is higher[1]. In recent years, with the development of technology and economy, the amount of satellites on orbit increases gradually and satellite performance continues to improve. Because the needs of EO applications are more diverse and complex, single or single-type satellite is difficult to complete the continuous observation of moving or periodical changing targets. It can meet the requirements to harness satellite sensor planning algorithm to schedule multiple, multi-orbit satellites. Coordinating multiple satellites with different trans-pass time and different types of sensors can get EO data for interested ground targets. Then these EO image data is transmitted to the ground control center to meet different application requirements after analysis, interpretation and processing. S. Burrow Bridge[2] studied the ground monitoring and control issues of multiple satellites, and carried out a detailed argument of ground control optimized and reasonable distribution of resources. Al. Globus[3] established a Earth observation scheduling model by considering the priority problems of ground observation targets and constraints of sensor observations,. He Renjie[4–5] put satellite time windows constraints in the planning and scheduling by taking satellite mission planning as a multiple machines scheduling problem. Bai Baocun[6–8] established a synthesis task programming model by analysis the multi-task synthesis in multi-satellite observation.
In the experiment, EO data is acquired by multiple satellites and the ground instruments is used to do synchronous observation in the same region. Based on the synchronous and
collaborative observation data with measured atmospheric data on the same day, atmosphe-
ric correction for high precision observation images can be carried out. Variations of calibration coefficient and performance can be detected by synchronous measurements of surface spectral sensors. For multi-satellite radiation normalization, data accuracy of radiation normalization can be detected according to synchronous data. Thus normalized standard data products can be produced and a reliable guarantee for later quantitative application can be provided. Specified information of the synchronous and collaborative observation dataset and the basic theory and demonstration of data reliability for data development are introduced in the paper.
The dataset of the multi-satellite synchronous observation experiment[9] in Zhangye district was acquired by the joint efforts of several satellite data centers and research units.
2 Metadata of Dataset
The detailed metadata information of the multi-satellite synchronous and collaborative observation in Zhangye district (2013), including dataset name, short name, authors, geographical area, spatial resolution, data published time, data sharing platform, contents of data sets, publisher and editor in charge, etc., are listed in Table 1.
3 Methods
The dataset of multi-satellite synchronous and collaborative observation in Zhangye region (2013) is acquired under the strict constraints of ground-satellite synchronization. The main contents of the dataset includes: ground measured spectral data, measured atmospheric data, diffuse-to-global ratio measurement data, and satellite EO data as well.
Table 1 Summary of ZYCOLDATA-2013 metadata
|
Items
|
Description
|
|
Dataset full name
|
Dataset of multi-satellite synchronous collaborative observation in Zhangye district (2013)
|
|
Dataset short name
|
ZYCOLDATA-2013
|
|
Authors
|
Li, G. Q. L-5718-2016, Institute of Remote Sensing and Digital Earth, Chinese Academy of Sciences, Ligq@radi.ac.cn
Zhang, H. L-5733-2016, Institute of Remote Sensing and Digital Earth, Chinese Academy of Sciences, haozhang@ceode.ac.cn
Xie, J. B. L-6473-2016, Institute of Remote Sensing and Digital Earth, Chinese Academy of Sciences, jbxie@ceode.ac.cn
Yuan, F. Y. L-7263-2016, Institute of Remote Sensing and Digital Earth, Chinese Academy of Sciences, fyyuan@ceode.ac.cn
Li, H.W. L-5922-2016, Central South University, haiwei6583@163.com
Qian, J. M. D-6692-2017, National Satellite Meteorological Centre, qianjm@cma.gov.cn
Wan, W. D-4616-2017, Chinese Centre for Resources Satellite Data and Application, wanwei829@163.com
Ma, G. B. L-6180-2016, Institute of Remote Sensing and Digital Earth, Chinese Academy of Sciences, gbma@ceode.ac.cn
|
|
Geographical region
|
38°22¢34²N-39°02¢34² N, 99°59¢57²E-100°51¢42² E
Study area located nearby Zhangye city, Gansu Province and most of the landscape is alluvial plain
|
|
Time
|
2013
|
|
Temporal resolution
|
daily
|
|
|
|
Spatial resolution
|
15 m-1,000 m
|
|
|
|
Data format
|
.hdf, .tif, xls, .kmz, .zip
|
Number of files
|
30
|
|
Data Size
|
18.5 GB
|
|
|
|
Data files
|
The dataset consists of 4 parts: Earth Observation data, ground measured spectral data, measured Diffuse-to-global ratio data, atmospheric observation data.
1. 201306-microtopsII.xls, this is the atmospheric observation data??data size is 248 KB
2. 20130612Reflection.rar, this is the ground measured spectral data ,data size is 7.43 MB
3. 201306-MZB processing results.xls, this is the measured Diffuse-to-global ratio data, data size is 403 KB
4. Earth Observation data by 10 satellites collaborative observation, data size is about 18.5 GB and data filenames are shown in Table 2
|
|
Foundations
|
Ministry of Science and Technology of P. R. China (2013AA12A300); Beijing Government (501-01-2012-800004-15); Chinese Academy of Sciences (131C11KYSB20160061)
|
|
Data Publisher
|
Global Change Research Data Publishing & Repository, http://www.geodoi.ac.cn/
|
|
Address
|
Address: No.11A, Datun Road, Chaoyang District, Beijing 100101, China
|
|
Data sharing policy
|
The term of the Data from the Global Change Research Data Publishing and Repository is the definition of metadata, dataset (data product), and data paper (published through Journal of Global Change Data & Discovery). The Data sharing policy includes: (1) the Data is openly available and can be easily to be downloaded through internet for all; (2) end users are encouraged to use the Data subject to citation; (3) users, who are value added provider services, are welcome to redistribute the Data subject to written permission from the GCdataPR Editorial Office for the Data redistribution license; (4) for database or new dataset developers who use the Data to compile new dataset, the “ten per cent principal” should be followed, that is, the picked records from the Data should not surpass 10% of the new dataset, and the data records source should be clearly noticed in the suitable place in the new dataset[10]
|
3.1 Synchronous Observation Planning
Multi-satellite synchronous and collaborative observation is one of the multi-satellite coordinating and planning modes. There are three commonly used synchronous modes: (1) Several satellites take images in the same place at the same time; (2) Several satellites take images at different locations at the same time; (3) Several satellites take images at the same place at different time. In this project we use the first synchronous mode. Seven cruising observation satellites and three task-oriented observation satellites are used in the synchronous observation. In order to determine the exact time of simultaneous observation, task-oriented observation satellites are requested to make observation planning.
According to the on-orbit simulation of three task-oriented observation satellites on June 1, 2013, it is possible to do synchronous observation for several satellites at the study area in Zhangye city, Gansu province, China. Considering the result of satellite on-orbit simulation and ground measurement requirements, this study area has ideal conditions. So this synchronous observation experiment is designed and done (Figure 1).
3.2 Satellites Synchronous Observation Data
After the process of synchronous observation planning and satellite observation tasks submission, 10 satellites with 22 sensors were used to obtain EO image data for the study area between 11:00 to 12:00 on June 13, 2013.
|
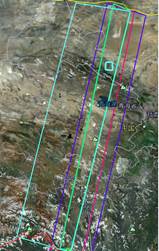
Figure 1 Multi-satellite Synchronous planning example (Light blue line: SPOT5 observation extent; dark blue line: THEOS observation extent; pink line: SJ9 observation extent; green line: the overlay extent of three satellites)
|
Table 2 Metadata of multi-satellite synchronous observation dataset in Zhangye
|
No.
|
Satellite
|
Sensor
|
Product level
|
Name of data file
|
Entry
|
Data volume
|
|
1
|
TERRA
|
MODIS
|
02\03
|
TERRA_*.hdf
|
4
|
1.77 GB
|
|
2
|
AQUA
|
MODIS
|
02\03
|
AQUA_*.hdf
|
4
|
2.08 GB
|
|
3
|
FY2D
|
VISSR
|
|
FY2D_*.hdf
|
4
|
834 MB
|
|
4
|
FY2E
|
VISSR
|
|
FY2E_*.hdf
|
4
|
834 MB
|
|
5
|
FY2F
|
VISSR
|
|
FY2F_*.hdf
|
4
|
834 MB
|
|
6
|
FY3A
|
MERSI
|
L1
|
FY3A_MERSI*.hdf
|
15
|
4.58 GB
|
|
|
MWHSX
|
L1
|
FY3A_MWHSX*.hdf
|
8
|
114 MB
|
|
|
TOUXX
|
L1
|
FY3A_TOUXX*.hdf
|
9
|
16.7 MB
|
|
|
VIRRX
|
L1
|
FY3A_VIRRX*.hdf
|
10
|
711 MB
|
|
7
|
FY3B
|
ERBMX
|
L2
|
FY3B_ERBMX*.hdf
|
14
|
199 MB
|
|
|
ERMXX
|
L1
|
FY3B_ERBMXX*.hdf
|
8
|
67.3 MB
|
|
|
IRASX
|
L1
|
FY3B_IRASX*.hdf
|
8
|
103 MB
|
|
|
MERSI
|
L1
|
FY3B_MERSI*.hdf
|
12
|
4.21 GB
|
|
|
MWHSX
|
L1
|
FY3B_MWHSX*.hdf
|
9
|
128 MB
|
|
|
MWRIA
|
L1
|
FY3B_MWRIA*.hdf
|
1
|
26.7 MB
|
|
|
MWRI
|
L1
|
FY3B_MWRID*.hdf
|
4
|
107 MB
|
|
|
MWTSX
|
L1
|
FY3B_MWTSX*.hdf
|
13
|
5.77 MB
|
|
|
TOUXX
|
L1
|
FY3B_TOUXX*.hdf
|
9
|
17.4 MB
|
|
|
VIRRX
|
L1
|
FY3B_VIRRX*.hdf
|
6
|
426 MB
|
|
8
|
HJ1B
|
CCD2
|
L2
|
HJ1B-CCD2*.tar.gz
|
2
|
1.72 GB
|
|
9
|
SPOT5
|
HRG2
|
1A
|
SPOT5.rar
|
2
|
694 MB
|
|
10
|
THEOS
|
MS&PAN
|
1A
|
*-TH201300074*.rar
|
3
|
1.11 GB
|
3.3 Ground Measured Spectral Data
For remote sensing research, it needs suitable spectrometers for field application in order to study the reflectance spectrum of visible and near-infrared for a variety of different objects in the field under natural conditions. We used ASD Fileldspec Pro FR (referred to as ASD FR) full spectrum portable optical spectrum analyzer, which was made in American ASD (Analytical Spectral Devices) company. The spectral range of the spectrometer is between 350-2,500 nm, including: VNIR (350-1,020 nm), SWIR1 (1,020-1,800 nm) and SWIR2 (1,800-2,500 nm) (Table 3).
Table 3 Main technique parameters of ASD FR spectrometer
|
Technique parameters
|
Indexes
|
|
Degree of linearity
|
±1%
|
|
Wavelength accuracy
|
±1 nm@700 nm
|
|
Wavelength repeatability
|
As a result of 0.3 nm at calibration temperature ± 10 °C range
|
|
Spectral resolution
|
3 nm@700 nm, 10 nm@1,400 nm and 2,100 nm
|
|
Sample interval
|
1.4 nm, and 2 nm in the range of 350-1,000 nm and 1,000-2,500 nm correspondingly
|
|
Scanning time
|
Fixed scanning time is 0.1 second; Max average spectrum reaches to 31,800 times
|
|
Equivalent noise radiation
|
UV/VNIR(ultraviolet to near infrared)1.4×10⁻⁹ W/(cm2·nm·sr)@700 nm
NIR(near infrared) 2.4×10⁻⁹ W/(cm2·nm·sr)@1,400 nm
NIR(near infrared) 8.8×10⁻⁹ W/(cm2·nm·sr)@2,100 nm
|
Notes: @700 nm signifies700 nm, the rest remaining the same.
ASD FR continuous spectrometer has two measuring modes: Raw data measurement modes and reflectance/reference sheet measurement mode.
In the raw data measurement mode, the spectrum measurement, display and store is mainly the raw digital signal. Under the reflectance/reference sheet measurement mode, the measurement, display and storage is automatically normalized to the spectrum on the latest measuring reference signals, and its value is the relative reflectance factor[11]. In this experiment the measurement mode, “reference board-ground-reference board”, was used. The surface albedo (ρg) could be calculated:
 (1)
(1)
Where, Vg(λ) is the measured spectral curves of DN values for sampling the landmark point.
3.4 Ground Measured Atmospheric Data
The ground atmospheric data was measured by using Microtops sun photometer made in United States Solar Light Company, which is one of handheld spectrophotometers used by many researchers around the world. The Microtops is a handheld 5-channel sun photometer. According to different purposes, users can choose the channel wavelength when purchase (such as observations of ozone and water vapor observation, select 300, 305.5, 312.5, 940, 1,020 nm). Each is equipped with a narrowband filter and as a 2.5° field angle. By choosing a different wavelength, AOD, total amount of direct solar radiation, ozone and water vapor can be measured.
Assume that the aerosol particle size distributions satisfy Runge (Junge) distribution, according to formula (2), and Angstrom coefficient α atmospheric turbidity coefficient β was calculated by using aerosol optical depth over any two-channel (ταλ), based on which deduced the aerosol optical thickness at 550 nm wavelength.
 (2)
(2)
3.5 Diffuse-to-global Ratio Measurement Data
The portable spectrometer for measuring diffuse-to-global ratio in experiment area is made by American SVC Company, which is a widely used spectrometer. The SVC spectrometer has three commonly used models, GER1500, GER3700 and HR-1024. Its specific parameters are shown in Table 4.
Table 4 Key technique parameters of HR-1024 spectrometer
|
Basic specifications
|
Indexes
|
|
Spectral measurement range
|
350-2,500 nm
|
|
The channel number
|
1,024 tunnel
|
|
Instrument weight
|
3.1 kg
|
|
Spectral resolution
|
≤3.2 nm (350-1,050 nm)
≤8.5 nm (1,000-1,900 nm)
≤6.5 nm (1,900-2,500 nm)
|
|
Scanning time
|
Minimum 1 ms
|
|
Field angle
|
14° and 4° standard can choose prepositional 25° optical fiber field lens
|
|
Size of instrument
|
220 mm×290 mm×80 mm
|
|
Data format
|
16 bits
|
|
Wavelength repeatability
|
±1 nm
|
|
Dark current
|
Automatic or manual
|
|
Power
|
12V VDC battery
|
|
Mode of operation
|
Portable, back or tripod fixing
|
|
The work environment
|
Temperature -10-40°C, humidity 10%-90% RH
|
The instrument used to measure the diffuse-to-global ratio is shown in Figure 2. The diffuse radiation is measured when the tripod ball shade light above the black hole. Otherwise, the global radiation is measured. The diffuse-to-global ratio is directly calculated by the value of the blocking ratio of total solar radiation and diffuse solar radiation, as follows:
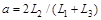 (3)
(3)
Where, L2 is the value of blocking diffuse reflection; L1 and L3 is the value of twice nearest global radiation without blocking.
4 Dataset Compositions, Quality Control and Validation
The dataset of multi-satellite synchronous and collaborative observation in Zhangye region (2013) includes 4 parts: Satellite datasets, ground spectral datasets, diffuse-to-global ratio data sets, atmospheric datasets.
1) Surface albedo.zip is the ground synchronous spectral data. Its data size is 8.02 MB. The wavelength-dependent surface measured reflectivity curves are shown as Figure 3.
|
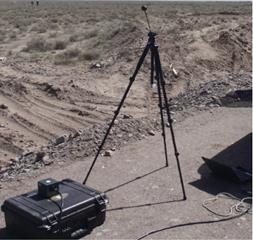
Figure 2 Measuring instrument of diffuse-to-global ratio
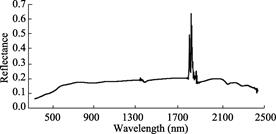
Figure 3 Ground measured spectrum

Figure 4 AOT in 550 nm wavelength

Figure 5 The measured Diffuse-to-global ratio data
|
2) Atmospheric data.zip is the measured atmospheric data. Its quantity is 248 KB. AOT at 550nm wavelength varying over time is shown in Figure 4. The vertical line in the figure represents the transit time.
3) Diffuse-to-global ratio.zip is the measured diffuse-to-global data. Its data size is 403 KB. The wavelength-depen-
dent diffuse-to-global curves are shown as Figure 5.
4) The satellite EO data consists of 10 satellites, which original data size is 18.5 GB. The EO data products are
received, processing, and provided by
satellite data centers.
5 Discussion and Conclusion
5.1 Multi-satellite Synchronous Observation Data
The experiment of multi-satellite synchronous and collaborative observation harnessed multi-satellite and multi- sensor to observe the same study area. Before the experiment, a scientific satellite observation planning program was used to generate the executable observation plan. Multi-source Earth Observation data can be used for cross-calibration, cross-validation between different satellites, as well as verification of multi-satellite collaborative remote sensing retrieval products. It is quite difficult to perform the 10 satellites synchronous observation because the related satellites covers the major observational scale (15- 1,000 m) and different observation spec- trum (high spectrum, multispectral and panchromatic). And the dataset has potential scientific value for research on multi-satellite synchronous observation and multi-satellite data fusion.
5.2 Ground Measured Spectral Data
The measured sites of ground spectral data are mainly located in the calibration regions, where the landscapes are plain, features uniform, and broaden vision. The measured spectral data can be combined with atmospheric data to calibrate the sensor and monitor sensor performance change. The cross calibration with multi-satellite, surface measurements of spectral data is required to calculate the spectral matching factor data. It can realize cross calibration among multi-satellite by using multi-satellite synchronous ground spectrum data. After atmospheric correction of the image, it can also be used to validate ground measured spectral data, in order to improve and perfect the correct results.
5.3 Atmosphere Data
The atmospheric data measuring stations are located mainly near the calibration sites. The main measurement data are as follows: AOT, moisture content and atmospheric pressure, etc. The atmospheric data is an indispensable input item for radiative transfer model, whose precise, to a certain extent, ensure the authenticity of the results. The atmospheric data are the entries for sensor’s calibration as well as atmospheric correction. For using satellite image data to aerosol and water vapor retrieval, the measured atmospheric data can also verify the retrieval results.
5.4 Diffuse-to-global Ratio Data
The measuring site of diffuse-to-global ratio data is near the open region of the calibration site. The aim is to primarily reduce errors assumed in radiative transfer models. Comparing with the aerosol type assumptions, using the field measurements of diffuse-to-global ratio data is closer to the actual radiative transfer conditions. Combing the measured diffuse-to-global ratio data with radioactive transfer models, the irradiance method can be used for high precision sensor’s calibration. In addition, based on variation field measurement curves of measured diffuse-to-global ratio along with time, the variation of atmospheric conditions can be acquired. When the curve of diffuse-to-global ratio vary dramatically, it signifies the variation of atmospheric conditions is huge. At this point, it needs to be analyzed according to specific purposes of research, to ensure that research results are true and reliable.
Author Contributions
Authors from RADI/CAS designed the multi-satellite synchronous and collaborative observation experiment, scheduled the satellite networking plan, and performed the in-situ survey. The author from CMA provided the FY series satellite image. The author from CRESDA provided the HJ satellite images.
Acknowledgements
The research and development of multi-satellite synchronous and collaborative observation dataset in Zhangye (2013) was funded by National 863 Key Research Project (2013AA12A300), department of Beijing Spacecraft System Design Project (501- 01-2012-800004-15), and the great support of Cold and Arid Regions Environmental and Engineering Research Institute (CAREERI) of the Chinese Academy of Sciences (CAS). Great thanks to all of them.
References
[1] Pang, Z. H. High and low orbit earth observation satellite mission planning method for cooperative research [D]. Harbin: Harbin Institute of Technology, 2013.
[2] Bridge, S. B. Optimal allocation of satellite networks resource [D]. Virginia: Virginia Polytechnic Institute and State University, 1999.
[3] Harrison, S. A., Price, M. E. Task scheduling for satellite based imagery [C]. Proceedings of the Eighteenth Workshop of the UK Planning and Scheduling Special Interest Group. University of Salford, UK, 1999, 64-78.
[4] He, R. J. Research on scheduling imaging reconnaissance satellite [D]. Changsha: National University of Defense Technology, 2004.
[5] He, R. J., Gao, P., Bai, B. C., et al. Models, algorithms and applications to the mission planning system of imaging satellites [J]. System Engineering-Theory & Practice, 2011, 3(31): 411-422.
[6] Bai, B. C. Imaging satellites scheduling model and optimization algorithm with task merging [D]. Changsha: National University of Defense Technology, 2008.
[7] Bai, B. C., Chen, Y. W., He, R. J., et al. Scheduling satellites observation and task merging based on decomposition optimization algorithm [J]. Acta automatica sinica, 2009, 35(5): 596-604.
[8] Bai, B. C., Xu, Y. F., He, R. J., et al. Maximum coverage model and algorithm for satellite scheduling observation with task merging [J]. Journal of Systems Engineering, 2010, 25(005): 651-658.
[9] Li, G. Q., Zhang, H., Xie, J. B., et al. Dataset of Multi-satellite Synchronous Collaborative Observation in Zhangye District [DB/OL]. Global Change Research Data Publishing & Repository, 2014. DOI: 10.3974/geodb.2014.02.15.V1.
[10] GCdataPR Editorial Office. GCdataPR Data Sharing Policy [OL]. DOI: 10.3974/dp.policy.2014.05 (Updated 2017).
[11] Fu, Q. Y., Wang, Z. M., Min, X. J., et al. Multivariate analysis for image of CBERS-1 and data mining of forest vegetation based on GIS [J]. Journal of Geo-information Science, 2005, 7(1): 53-58.