Dataset of Total Suspended Solids in the Jiaozhou Bay Retrieved
from Landsat Images (1984–2020)
Huang, J.1 Zhang, X.1 Zhao, Y. F.2*
1. College of Geodesy and Geomatics, Shandong University of
Science and Technology, Qingdao 266590, China;
2. Jiaozhou Bay Marine Ecosystem Research Station, Chinese
Academy of Sciences, Qingdao 266071, China
Abstract: The total
suspended solids (TSS) concentration (mg/L) is an important water environment
parameter in coastal waters. The dataset of total suspended solids in the
Jiaozhou Bay (1984–2020) was retrieved from the Landsat TM/ETM /OLI images between
1984 and 2020 with a quantitative retrieval model. In total, 23 pairs of remote
sensing reflectance and TSS concentration data were used for model development
with the Leave-One-Out Cross-Validation method. Judged by R² and RMSE, the model with the best performance was selected for
TSS retrieval. The dataset includes: (1) the geographic boundary data of
Jiaozhou Bay in 1984 and 2020; (2) 318 images of TSS concentration with spatial
resolution of 30 m. The dataset was archived in .shp and .tif data formats and
consisted of 341 data files with a data size of 236 MB (compressed into one
single file of 232 MB). This dataset provided data support for watercolor
remote sensing research, water quality evaluation, and water environmental
protection.
Keywords: Jiaozhou Bay; Landsat; total
suspended solids; quantitative
retrieval; long-term monitoring
DOI: https://doi.org/10.3974/geodp.2022.03.14
CSTR: https://cstr.escience.org.cn/CSTR:20146.14.2022.03.14
Dataset Availability Statement:
The dataset
supporting this paper was published and is accessible through the Digital Journal of
Global Change Data Repository at: https://doi.org/10.3974/geodb.2022.02.09.V1
or https://cstr.escience.org.cn/CSTR:20146.11.2022.02.09.V1.
1 Introduction
Jiaozhou
Bay (JZB) is a semi-closed bay with an approximate trumpet shape, and its exit
faces east. It is located in the middle of the Yellow Sea in China, close to
the southern coast of Shandong Peninsula (Figure 1). JZB covers an area of 370
km2, with narrow entrances, deep waterways, low turbidity, weak
tides, and low waves. As a natural port in Qingdao, it promotes the development
of Qingdao??s transportation industry[1]. The mouth of the bay is
bounded by the southern end of the Tuandao and the northern end of Xuejiadao
and is about 2.5 km wide. The width of the central part of JZB is about 27.8 km
from east to west, and the maximum length from north to south is about 33.3 km.
The coastline is about 163 km long, and the tidal flat area is about 125 km².
However, like most bays bordering urbanized areas, JZB coastal areas are also
undergoing major changes to resolve the conflict between land demand and
supply. A previous study showed that the area of JZB had decreased by 36.6%
compared to that in 1935, and the length of the coastline was shortened by
30.4%[2].
|
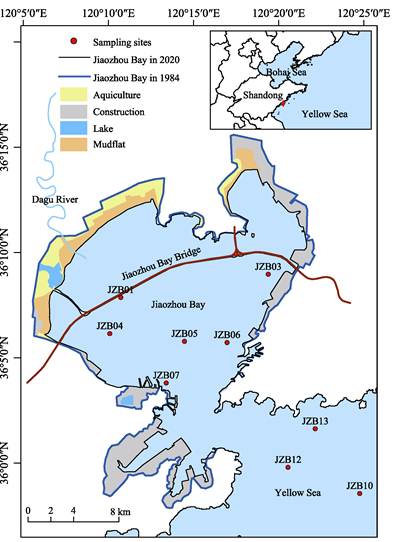
Figure 1 Location of Jiaozhou Bay
|
As one of the
important parameters in coastal water environment, total suspended solids (TSS)
is fundamental to many physical and chemical processes in the waters. On the
one hand, the TSS concentration as a common water quality parameter plays an
important role in indicating the pollution degree and estimating the soil
erosion. On the other hand, TSS reduces the light energy entering the water
body, restricting the growth of aquatic plants and the primary productivity of
plankton[3].
In recent years,
with the development of industry and growth in the standard of living, water
resources such as oceans, rivers, and lakes have been contaminated. Monitoring
of the TSS concentration has become an important part of water environmental
improvement. The traditional method of TSS monitoring heavily relies on
laboratory measurement of field sampling[4], which is time-consuming
and labor-intensive. Especially for some hard-to-reach places, the number of
field sampling sites are limited, and periodic and comprehensive measurement is
difficult to achieve. Remote sensing has the advantages of saving time,
economy, and repeat observation. It can realize real-time, macroscopic, and
dynamic water environment monitoring for large bodies of water[5].
Although the
variation of TSS in JZB and surrounding waters has always been a concern to
scientists and managers, long-term TSS monitoring results in JZB are still
lacking. Therefore, in this paper, a quantitative retrieval model of TSS
concentration was established based on field-measured data and Landsat data.
Then, the JZB TSS dataset from 1984 to 2020 was obtained, which provided data
support for watercolor remote sensing and water environment monitoring.
2 Metadata of the Dataset
The metadata of Landsat image-based
retrieval dataset of total suspended solids in the Jiaozhou Bay (1984-2020)[6] is summarized in Table
1. It includes the dataset full name, short name, authors, year of the dataset,
temporal resolution, spatial resolution, data format, data size, data files,
data publisher, and data sharing policy, etc.
Table 1 Metadata
summary of the Landsat image-based retrieval dataset of total suspended solids
in the Jiaozhou Bay (1984–2020)
|
Items
|
Description
|
|
Dataset
full name
|
Landsat
image-based retrieval dataset of total suspended solids in the Jiaozhou Bay
(1984-2020)
|
|
Dataset
short name
|
JZBay_TSS_1984-2020
|
|
Authors
|
Huang,
J.,
College
of Geodesy and Geomatics, Shandong University of Science and Technology,
huangjue@sdust.edu.cn
Zhang, X., AAG-5860-2022, College of
Geodesy and Geomatics, Shandong University of Science and Technology,
zhangxiang0112@sdust.edu.cn
Zhao, Y. F., Jiaozhou Bay Marine Ecosystem Research
Station, Chinese Academy of Sciences, yfzhao@qdio.ac.cn
|
|
Geographical
region
|
Jiaozhou
Bay of Qingdao (35??55¢N‒36??18¢N, 120??04¢E‒120??22¢E)
|
|
Year
|
1984-2020
|
|
Spatial
resolution
|
30 m
|
|
Data
format
|
.shp,
.tif
|
|
|
|
Data
size
|
232 MB
(after compression)
|
|
|
|
Data
files
|
The dataset includes boundary vector data
of Jiaozhou Bay in 1984 and 2020, and 318 data files of suspended matter
concentration in Jiaozhou Bay from 1984 to 2020 obtained by Landsat??s three
sensors. ??Landsat_TM_TSS?? contains 144 data files, ??Landsat_ETM+_TSS??
contains 120 data files, and ??Landsat_OLI_TSS?? contains 54 data files
|
|
Foundations
|
National
Natural Science Foundation of China (42076185, 41706194); Ministry of
Scienceand Technology of P. R. China (CNERN)
|
|
Data computing environment
|
Google Earth Engine
|
|
Data
publisher
|
Global Change Research Data Publishing &
Repository, http://www.geodoi.ac.cn
|
|
Address
|
No.
11A, Datun Road, Chaoyang District, Beijing 100101, China
|
|
Data
sharing policy
|
Data from
the Global Change Research Data Publishing & Repository includes metadata, datasets
(in the Digital Journal of Global Change Data Repository), and
publications (in the Journal of Global Change Data & Discovery). Data sharing policy
includes: (1) Data are openly available and can be free downloaded via the
Internet; (2) End users are encouraged to use Data subject to
citation; (3) Users, who are by definition also value-added service providers,
are welcome to redistribute Data subject to written permission
from the GCdataPR Editorial Office and the issuance of a Data redistribution
license; and (4) If Data are used to compile new
datasets, the ??ten per cent principal?? should be followed such that Data
records utilized should not surpass 10% of the new dataset contents, while
sources should be clearly noted in suitable places in the new dataset[7]
|
|
Communication
and searchable system
|
DOI, CSTR, Crossref, DCI,
CSCD, CNKI, SciEngine, WDS/ISC, GEOSS
|
3 Methods
3.1 Jiaozhou Bay Vector Data
In
this study, the geographic boundary data of Jiaozhou Bay in 1984 and 2020 were
obtained using ArcGIS. Due to the influence of land reclamation in recent
years, the area of JZB has decreased, and the boundary is changing, so the 2020
boundary was used. The boundary of JZB in 2020 has a certain distance to the
coast in the north, because the northern part of JZB is mostly tidal flats with
shallow water depth, and the high reflectance of the sediment seriously affects
the retrieval results of TSS. As a result, the areas seriously affected by
sediment were excluded, and this boundary was finally determined as the
??retrieval boundary?? to minimize the impact of the tidal flat. In addition, the
JZB Bridge has a significant difference in reflectance from seawater. In order
to reduce the influence of the JZB Bridge on TSS retrieval, the JZB Bridge was
masked.
3.2 In-Situ
Data
In
this study, 23 sets of field-measured data between 2011 and 2015 were collected
from the JZB Marine Ecosystem Research Station (http://jzw.qdio.cas.cn/). The
TSS concentration was measured gravimetrically. The water samples were first
filtered through a dry preweighed 0.45 µm filter. Then, the filters were dried
at 45??C for 24 hours and then reweighed. The drying process was repeated until
the difference in the TSS values of consecutive weighing was less than 0.01
mg/L. Information on the location of the sample sites is shown in Figure 1.
3.3 Acquisition and Preprocessing of Landsat Data
In
this study, Landsat reflectance data were collected from the Google Earth
Engine (GEE) platform, including Theme Mapper (TM), Enhanced Theme Mapper Plus
(ETM+), and Operating Land Imager (OLI). Images with cloud cover >10% were
excluded for quality control. The atmospheric correction method for Landsat
TM/ETM+ and OLI reflectance data were LEDAPS (Landsat Ecosystem Disturbance
Adaptive Processing System) and LaSRC (Landsat Land Surface Reflectance Code),
respectively.
The Quality
Assessment (QA) band was used to detect clouds and cloud shadows on Landsat
images and generate cloud mask files for cloud removal. Although TM/ETM+ and
OLI have similar spectral bands, there were still differences between the image
reflectance obtained by the three sensors used in this study. Therefore, a
linear relationship between the reflectance of OLI and TM/ETM+ was developed
using the empirical line method[8], and the reflectance of Landsat
TM/ETM+ images was adjusted to the same level as the reflectance of OLI images.
On May 31, 2003, the Landsat ETM+ airborne scan line corrector (SLC) failed,
resulting in the loss of data bands in subsequently acquired images. Therefore,
the focal mean function was applied to fix the mistakes.
3.4 Development of TSS Quantitative Retrieval Model
|
Table 2 Correlation analysis of
band combination and TSS
|
|
Band
Combination*
|
Correlation Coefficient (r)
|
|
(G+R)/(G/R)
|
0.82
|
|
G+R
|
0.80
|
|
NIR/R
|
0.79
|
|
(G+R)/(B/R)
|
0.79
|
|
(R − B)/(R+B)
|
0.77
|
|
B+R
|
0.76
|
|
B+NIR
|
0.73
|
|
R/G
|
0.68
|
|
|
|
|
|
|
*: B, G, R, and NIR are blue, green, red, and
near-infrared band reflectance, respectively.
|
Through band sensitivity
analysis, it was found that the red band had the strongest correlation with the
TSS concentration. Therefore, the combinations of the red band and other bands
were used as indicators to analyze the correlation between the TSS
concentration and remote sensing data. Table 2 shows that the band combination
with the strongest correlation was (G+R)/(G/R) (G is the remote sensing
reflectance of the green band, R is the remote sensing reflectance of the red
band). Therefore, in this study, the band combination mentioned above
was
used for the establishment of a quantitative inversion model of TSS
concentration.
The model was calibrated and validated
using a robust leave-one-out cross-validation approach[9]. In total,
22 sets of remote sensing reflectance and TSS concentration data were used for
modeling, and the remaining one set of data was used for validation. The above
process was carried out in sequence, a total of 23 models were obtained, and
the coefficient of determination (R²)
and root-mean-square error (RMSE) were calculated. The model with the highest
accuracy was finally selected as the retrieval model of TSS concentration. The
model proposed in this study achieved the best performance, and the retrieval
model was set as follows:
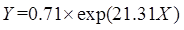 (1)
(1)
where X was (B2 + B3)/(B2/B3) for Landsat 5
and Landsat 7 and (B3 + B4)/(B3/B4) for  , while Y was the TSS concentration. B2, B3, and B4 were the
reflectance associated with the Landsat channels.
, while Y was the TSS concentration. B2, B3, and B4 were the
reflectance associated with the Landsat channels.
4 Data Results and Validation
4.1 Data Composition
After the
preprocessing, the retrieval model was applied to the Landsat images, and
finally, 318 images of TSS concentration of JZB from 1984 to 2020 were
obtained. The data format, spatial resolution, and unit were. tif, 30 m, and
mg/L, respectively. Among them, there were 144 TM images with a time range of
1984-2011, 120 ETM+ images with a time range
of 1999–2020, and 54 OLI images with a time range of 2013–2020. The image was
named as follows: XXXX_120035_YYYYMMDD.tif, where XXXX represented different
Landsat sensors (LT05, LE07, and LC08), 120035 represented the row and column
number of the image where the JZB is located, and YYYYMMDD represented the
date. The TSS concentration derived from different sensors can be mixed. In
addition, this dataset also included the vector data of JZB boundaries in 1984
and 2020.
|
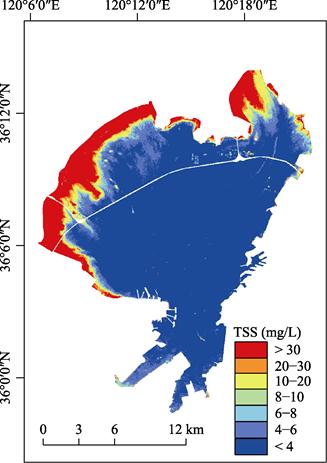
Figure
2 Spatial distribution of TSS in
JZB on August 19, 2013
|
4.2 Data Results
The spatial
distribution of the TSS in JZB on August 19, 2013, was taken as an example and
is shown in Figure 2. The missing pixels in the image were due to cloud removal
and generally did not affect usability. The TSS concentration in the JZB mainly
varied in the range of 0–150 mg/L, showing a low turbidity and gradually
decreasing from northwest to southeast. The TSS concentration was generally
above 30 mg/L in the estuary and coastal areas but was mostly below 30 mg/L in
the central sea area.
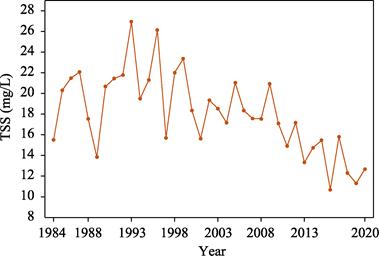
Figure 3 shows the variation of the annual
average TSS in JZB inversed from the Landsat data from 1984 to 2020. The annual
average TSS concentration reached a maximum value (26.94 mg/L) in 1993 and a
minimum value (10.69 mg/L) in 2016. However, there was an overall decreasing
trend, which was consistent with the research by Gao et al[10].
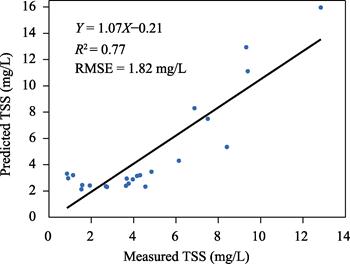
4.3 Data Validation
Leave-one-out
cross-validation was used to minimize the influence of random factors caused by
the small amount of field-measured data in the TSS model development. Figure 4
showed the correlation between the measured and predicted TSS values. The model
had high explanatory and predictive power. The R², RMSE, and trendline slope were 0.77, 1.82, and 1.07,
respectively. The scatter points were evenly distributed on both sides of the
1:1 line, and all predicted TSS values were within the range of the measured
data.
|
|
|
|
Figure 3 Variation of the annual average TSS in JZB from 1984
to 2020
|
Figure 4 Relationship between the measured and predicted TSS
|
5 Discussion and Conclusion
The data format,
spatial resolution, and unit were .tif, 30 m, and mg/L, respectively. The data
source of the dataset was reliable, and it was mainly produced based on
platforms such as GEE. Users can open it with the help of image processing
software such as ArcGIS or ENVI. If other formats are required, format
conversion can be performed in the software above.
It is worth noting that there may be
certain uncertainties in this dataset. Firstly, there was a difference in the
acquisition time between field-measured data and satellite data due to the
limited number of field-measured data, inevitably introducing uncertainty to
the retrieval model. Secondly, due to the lack of near-shore observation sites,
the highest concentration in the field-measured data was 13 mg/L, but a small
part of the TSS concentration in the retrieval results was higher than 30 mg/L.
Retrieval model developed based on a narrower concentration dynamic range also
introduced certain uncertainties. In addition, less remote sensing data were
available in summer than in other seasons because of the cloudy summer weather
in the JZB. Finally, the northern coast of the JZB was greatly affected by the
high reflectance of sediments from shallow waters; therefore, the high TSS
concentration in this area revealed by the retrieval model might be
inconsistent with reality.
Long-term dynamic TSS datasets can
effectively provide data support for management departments and accelerate
water quality improvement. This dataset provided the TSS concentration products
in JZB from 1984 to 2020, with a large amount of data and a wide time range. It
provided important data support for the study of ocean color remote sensing
such as the pattern of the temporal and spatial distribution of TSS in JZB and
its influencing factors and also provided a basis for water environment
monitoring and environmental protection policy formulation.
Author Contributions
Huang, J. made the overall
design for the development of the dataset, participated in the model design and
the writing and revision of the paper. Zhao, Y. F. collected the
field-measured data and gave general guidance for the research. Zhang,
X. processed basic data, participated in model development, performed data
validation, and wrote data papers.
Acknowledgements
Thanks to the Jiaozhou Bay Marine Ecosystem
Research Station for the field-measured data of the total suspended solid
concentration in Jiaozhou Bay.
Conflicts of Interest
The
authors declare no conflicts of interest.
References
[1]
Yang, G., Jiang, T., Zhao, Y., et
al. Study on variation in chlorophyll-a concentration and its influencing
factors of Jiaozhou Bay based on long term remote sensing images [J]. Haiyang
Xuebao, 2019, 41(1): 183–190.
[2]
Yuan, Y., Jal??n-Rojas, I.,
Wang, X. H., et al. Design, construction and application of a regional
ocean database: a case study in Jiaozhou Bay, China [J]. Limnology and
Oceanography, 2019, 17(3): 210‒222.
[3]
Zhang, Y., Wu, Z., Liu, M.
Thermal structure and response to long-term climatic changes in Lake Qiandaohu,
a deep subtropical reservoir in China [J]. Limnology and Oceanography,
2014, 59(4): 1193‒1202.
[4]
Zhang, M. H. Distribution and seasonal
variation of suspended matter in sea water of Jiaozhou Bay [J]. Studia
Marina Sinica, 2000(00): 49–54.
[5]
Zhang, X., Song, Y., Chen, J.
J., et al. Landsat image-based retrieval and analysis of spatiotemporal
variation of total suspended solid concentration in Jiaozhou Bay, China [J]. Remote
Sensing, 2021, 13(23): 4796‒4796.
[6] Huang, J., Zhang, X., Zhao, Y., F. Landsat image-based retrieval
dataset of total suspended solids in the Jiaozhou Bay (1984–2020) [J/DB/OL]. Digital Journal of Global Change Data
Repository, 2022. https://doi.org/10.3974/geodb.2022.02.09.V1.
https://cstr.escience.org.cn/CSTR:20146.11.2022.
02.09.V1.
[7]
GCdataPR Editorial Office.
GCdataPR data sharing policy [OL]. https://doi.org/10.3974/dp.policy.2014.05
(Updated 2017).
[8]
Han, X. X., Chen, X. L., Feng,
L., et al. Four decades of winter wetland changes in Poyang Lake based
on Landsat observations between 1973 and 2013 [J]. Remote Sensing of
Environment, 2015, 156: 426‒437.
[9]
Huang, J., Wu, M., Cui, T. W., et
al. Quantifying DOC and its controlling factors in major Arctic rivers
during ice-free conditions using Sentinel-2 data [J]. Remote Sensing,
2019, 11(24): 2904.
[10]
Gao, G., Wang, X., Bao, X., et
al. The impacts of land reclamation on suspended-sediment dynamics in
Jiaozhou Bay, Qingdao, China [J]. Estuarine Coastal and Shelf Science,
2018, 206: 61‒75.