Dataset Development on Moisture
Sources of Precipitation on the Qinghai-Xizang Plateau (1998?C2018)
Zhang,
C.
Key Laboratory of Land Surface Pattern
and Simulation, Institute of Geographic Sciences and Natural Resources Research, Chinese Academy of Sciences, Beijing
100101, China
Abstract: The source and transport mechanisms of water vapor for
precipitation on the Qinghai-Xizang Plateau have been a focal point of interest
in international hydroclimatology. Due to the limited number of ground
observation stations and their uneven distribution on the plateau, there are
large errors in overall precipitation measurements, leading to significant
uncertainties in tracing precipitation sources. The authors introduced
satellite precipitation data to compensate for the limitations of station-based
precipitation observations, enabling a more accurate assessment of moisture
sources for the plateau??s overall precipitation. Using a water vapor tracking
numerical model, the authors simulated the moisture sources for the plateau??s
overall precipitation over approximately 20 years. The model was driven by
ERA-Interim reanalysis data, TRMM satellite precipitation, and GLDAS-OAFlux
evaporation data. Comparative experiments were conducted for validation,
ultimately generating monthly-scale data of moisture sources for the plateau??s
overall precipitation. The dataset includes: (1) the extent of the Qinghai-Xizang
Plateau; (2) monthly moisture source data for precipitation from 1998 to 2018,
with a spatial resolution of 1????1??, the unit is mm/mon; (3) monthly and annual
precipitation data of the plateau. The dataset is archived in .nc, .shp, and
.xlsx formats, consisting of 8 data files with a total size of 55 MB (compressed into 1 file, 40.9 MB).
Keywords: Qinghai-Xizang Plateau; climate; precipitation; moisture source
DOI: https://doi.org/10.3974/geodp.2025.01.04
Dataset Availability Statement:
The dataset supporting this paper was published and is accessible through
the Digital Journal of Global Change Data Repository at: https://doi.org/10.3974/geodb.2024.09.02.V1.
1 Introduction
The
Qinghai-Xizang Plateau, is the source of several major Asian rivers, with its
precipitation constituting the main source of runoff[1].
The sources and transport mechanisms of water vapor for precipitation over the
plateau have long been a focus of international hydroclimatological research[2,3]. However, due to the
limited number of ground observation stations and their uneven distribution,
there are significant errors in estimating the total precipitation over the plateau[4]. This uncertainty not only affects
the accurate assessment of precipitation but also poses challenges in tracing
water vapor sources.
To
address the problem of sparse and unevenly distributed precipitation
observation stations on the plateau, this study introduced the satellite
precipitation data product TRMM (Tropical Rainfall Measuring Mission) to
compensate for the limitations of surface observations. TRMM data showed high
consistency with measured data in areas with dense ground observation stations
in the eastern plateau, strongly confirming its applicability across the entire
plateau[4]. The successful
introduction of satellite precipitation has made it possible to conduct
comprehensive and accurate source tracking of overall precipitation on the
plateau. This study used ERA-Interim reanalysis, TRMM satellite precipitation,
and GLDAS/OAFlux evaporation data as inputs to drive a water vapor tracking
numerical model, simulating moisture sources for total precipitation over the
plateau from 1998 to 2018, ultimately generating a monthly-scale dataset of
moisture sources for plateau precipitation. This achievement provides a solid
data foundation for accurately assessing the moisture sources, seasonal
variations, and water vapor transport mechanisms of total precipitation over
the plateau.
2 Metadata of the Dataset
The
metadata of Simulating precipitation moisture sources dataset on Qingzang
Plateau (1998?C2018)[5] is
summarized in Table 1. It includes the dataset full name, short name, authors,
year of the dataset, temporal resolution, spatial resolution, data format, data
size, data files, data publisher, and data sharing policy, etc.
3 Methods
3.1 Model
This
study selected the new generation Eulerian numerical model WAM2Layers (Water
Accounting Model with Two Layers) as the primary tool for tracking moisture
sources of total precipitation over the plateau. This model has been
significantly optimized from the original WAM model, notably by introducing a
dual-layer structure to refine vertical simulation. This design effectively
overcomes the tracking errors of the previous model under conditions of
vertical wind direction changes, greatly improving the accuracy of dynamic
moisture tracking[7,8]. The main
model equation is:
 (1)
(1)
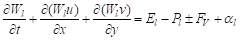
where
W represents atmospheric precipitable water (mm), l represents
the upper or lower atmospheric layer, u, v represent
horizontal wind speed (m/s), E represents surface evaporation (mm), P
represents precipitation (mm), Fv represents vertical moisture transport
between layers (mm), and ?? represents the residual term. Moisture from
the specific source region follows a similar atmospheric water balance
equation:
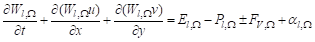 (2)
(2)
Where ?? represents moisture from a specific source region
(mm).
Table
1 Metadata summary of MoistureSourceQZP_1998?C2018
|
Items
|
Description
|
|
Dataset full name
|
Simulating precipitation moisture sources dataset
on Qingzang Plateau (1998?C2018)
|
|
Dataset short
name
|
MoistureSourceQZP_1998?C2018
|
|
Authors
|
Zhang, C., Institute of Geographic Sciences and
Natural Resources Research, Chinese Academy of Sciences, zhangchi@igsnrr.ac.cn
Tang,
Q. H., Institute of Geographic Sciences and Natural Resources Research,
Chinese Academy of Sciences, tangqh@igsnrr.ac.cn
Huang,
J. C., Institute of Geographic Sciences and Natural Resources Research,
Chinese Academy of Sciences, huangjc@igsnrr.ac.cn
Zhou, Y. Y., Institute of Geographic Sciences and
Natural Resources Research, Chinese Academy of Sciences, zhouyy@igsnrr.ac.cn
Gaffney, P. P. J., Institute of Geographic Sciences
and Natural Resources Research, Chinese Academy of Sciences, gafppj@igsnrr.ac.cn
Xu, X. M., Institute of Geographic Sciences and
Natural Resources Research, Chinese Academy of Sciences, xuxm@igsnrr.ac.cn
|
|
Geographical
region
|
Qinghai-Xizang Plateau
|
|
Year
|
1998?C2018
|
|
Temporal
resolution
|
Month
|
|
Spatial
resolution
|
1????1??
|
|
Data format
|
.nc, .xlsx, .shp
|
|
|
|
Data size
|
40.9 MB (after compression)
|
|
|
|
Data files
|
The Qinghai-Xizang Plateau region, monthly
precipitation, monthly moisture sources for precipitation in Qinghai-Xizang
Plateau
|
|
Foundation
|
Chinese Academy of Sciences (XDA2006040202)
|
|
Data publisher
|
Global Change Research Data
Publishing & Repository, http://www.geodoi.ac.cn
|
|
Address
|
No. 11A, Datun Road, Chaoyang District, Beijing
100101, China
|
|
Data sharing
policy
|
(1) Data
are openly available and can be free downloaded via the Internet; (2) End
users are encouraged to use Data
subject to citation; (3) Users, who are by definition also value-added
service providers, are welcome to redistribute Data subject to written permission from the GCdataPR Editorial
Office and the issuance of a Data
redistribution license; and (4) If Data
are used to compile new datasets, the ??ten percent principal?? should be
followed such that Data records
utilized should not surpass 10% of the new dataset contents, while sources
should be clearly noted in suitable places in the new dataset[6]
|
|
Communication and searchable system
|
DOI, CSTR, Crossref, DCI, CSCD, CNKI, SciEngine,
WDS, GEOSS, PubScholar, CKRSC
|
3.2 Data Sources
The
atmospheric data used in this study comes from the European Centre for
Medium-Range Weather Forecasts?? ERA-Interim reanalysis[9],
with a spatial resolution of 1????1??. It includes zonal wind, meridional wind,
and specific humidity at model levels at 6-hour intervals, surface atmospheric
pressure at 6-hour intervals, and a series of vertically integrated water and
flux variables.
For precipitation,
the study used the surface station-calibrated TRMM research product 3B43 (V7)[10], which covers the global range
of 50??N?C50??S and provides monthly data from 1998 to 2018 on a 0.25????0.25?? grid.
For land surface evaporation, the study selected the 3-hourly 1????1?? evaporation
product produced by the Community Land Model (CLM) of the Global Land Data
Assimilation System (GLDAS)[11].
CLM is a rigorously evaluated physics-based model. Its forcing data, including
precipitation, temperature, and radiation, are all observational data. Over the
oceans, the Objectively Analyzed Air-sea Fluxes (OAFlux) product[12]
was used, with a temporal and spatial resolution of monthly 1????1??. The OAFlux
product has assimilated satellite data since 1985. Additionally, 3-hourly
precipitation and evaporation data from ERA-Interim were incorporated to
provide diurnal variation information.
3.3 Data Processing
Apart
from the GLDAS land surface evaporation data, surface fluxes are primarily
monthly data. The values of precipitation and evaporation in ERA-Interim are
too high to be used directly[13],
but they contain diurnal variation information at 3-hour intervals. To preserve
this diurnal variation information of ERA-Interim??s precipitation and
evaporation while conforming to observational data, the team used monthly
observational precipitation and evaporation data to recalibrate the ERA-Interim
data. The specific steps are as follows:
First, the TRMM
precipitation was converted to the same spatial resolution as ERA- Interim by
integrating the 0.25?? grid values that fall within a 1?? grid. Meanwhile,
monthly precipitation from ERA-Interim was calculated. Using monthly TRMM data
as the baseline, the ratio of TRMM precipitation to ERA-Interim precipitation
was calculated for each grid and each month. Then, ERA-Interim precipitation
for each grid was recalibrated by multiplying the 3-hourly ERA-Interim
precipitation data by the ratio for each month.
For ocean
evaporation, the 1????1?? OAFlux values were first linearly transformed to
ERA-Interim??s 1????1?? grid. Then, using a procedure similar to TRMM, the 3-hourly
ERA-Interim evaporation fields were recalibrated to match the OAFlux data. In
grids where OAFlux data was missing, ERA-Interim values were retained; Over
land, GLDAS evaporation data was linearly interpolated to ERA-Interim??s 1??
grid. Since GLDAS evaporation data was already at 3-hour resolution, the
interpolated data was used directly.
To ensure numerical
stability in moisture tracking, each set of input data was discretized to
15-minute time steps. The 6-hourly or 3-hourly data was converted to 15-minute
intervals using linear interpolation (for state variables) or equal
distribution (for cumulative variables). After the model completed the run, the
15-minute scale moisture contribution data was integrated to the specified time
scale as needed.
4 Data Results and Validation
4.1 Dataset Composition
The dataset consists of 8 data files in 3 data
groups, including: (1) Geographical extent of the Qinghai-Xizang Plateau (in .shp
format); (2) Monthly precipitation data for the plateau from 1998 to 2018
(mm/mon, in .xlsx format); (3) Simulated moisture source data on a monthly
scale from 1998 to 2018, with a spatial resolution of 1????1?? (mm/mon, in .nc
format).
4.2 Data Results
The
moisture sources for precipitation over the Qinghai-Xizang Plateau exhibit
significant seasonal variations (Figure 1). In winter, January shows the lowest
contribution from evaporative sources throughout the year, in stark contrast to
July in summer, when evaporative source contributions reach their annual peak.
Notably, the westerlies play a crucial role throughout all seasons of the year.
Even in July, when the South Asian monsoon dominates, the westerlies remain an
important source of moisture for plateau precipitation, highlighting their
persistent influence.
In spring (April),
the moisture contribution to plateau precipitation mainly comes from the
westerlies, while the Arabian Sea and Bay of Bengal also provide significant
contributions. In contrast, the situation in autumn (October) differs, with
moisture for plateau precipitation primarily originating from the Bay of Bengal
to the south, even exceeding the contribution from the Arabian Sea. This
phenomenon reflects subtle changes in the circulation patterns south of the
plateau during autumn.
July represents the
month with the most abundant total precipitation over the plateau, resulting
from the combined effects of multiple circulation systems. The prevailing South
Asian monsoon transports large amounts of Indian Ocean moisture to the plateau,
while simultaneously, due to the moist Eurasian continental surface, the
westerlies also bring considerable moisture contribution to the Qinghai-Xizang
Plateau. Additionally, active convection over the plateau
during summer strengthens the internal circulation, making local evaporation an
important contributor to precipitation, forming a notable center of strong
contribution in the southern plateau.
4.3 Data Validation
|
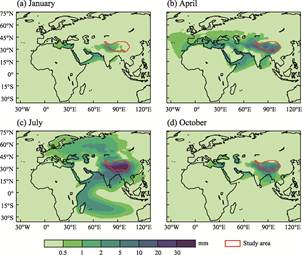
Figure 1 Maps of average
seasonal variations in moisture sources for the plateau precipitation
|
|
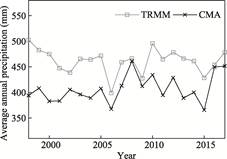
Figure 2
Comparison between remote sensing
observation (TRMM) and surface station observation (CMA) precipitations over
the Plateau (1998?C2017)
|
Due
to the sparse and uneven distribution of meteorological stationson the plateau, there exists significant uncertainty in data of the plateau
precipitation. A comparison between the China Meteorological
Administration??s (CMA) station-based precipitation
product and TRMM satellite precipitation data (Figure 2) shows that from 1998
to 2017, CMA??s estimated overall average annual
precipitation for the plateau was approximately 12% lower than TRMM??s
estimation, with a correlation coefficient of 0.40 between the two. Although
this passed the 0.10 significance level test (but not the 0.05 level),
substantial differences can be observed in their variations (Figure 2).
To verify the applicability
of TRMM precipitation data in Qinghai-Xizang Plateau, Zhang selected a
validation area in the eastern plateau with dense surface observation stations
to analyze the relationship between surface-observed precipitation and satellite-retrieved precipitation[4]. The results showed
that from 1998 to 2017, TRMM data indicated an average annual precipitation of
676.6??40.4 mm in the eastern plateau, which accounted for approximately 93% of
the measured precipitation. More importantly, TRMM data demonstrated
high consistency with measured data in interannual variations, with a
correlation coefficient as high as 0.92.
This result strongly confirms the usability of TRMM data under the complex
terrain conditions of the Qinghai-Xizang Plateau and supports its application
across the entire plateau region. In contrast, the CMA precipitation product
has more uncertainties over the plateau due to station-related issues and
should be used with caution.
5 Discussion and Conclusion
The
total precipitation and its moisture sources on the Qinghai-Xizang Plateau have
long been a research focus in the global climatology community. However, due to
sparse and uneven distribution of ground observation stations on the plateau,
there are significant errors in estimating total precipitation, which leads to
more uncertainties in tracing precipitation sources. This study introduces
satellite precipitation data, taking full advantage of its broad coverage,
validating it in areas with dense observations on the plateau, and extending it
to the entire plateau region. This method effectively addresses the lack of
ground observation data on the plateau and provides a more reliable data source
for studying precipitation moisture sources. The model uses multi-source
observational data as driving inputs, including TRMM precipitation, GLDAS/ OAFlux
model/remote sensing evapotranspiration data, and ERA-Interim reanalysis. Based
on strict physical processes and water balance equations, calculations are
performed at 15-minute time scales, ultimately providing monthly global gridded
moisture contribution data at 1????1?? spatial resolution. The annual
precipitation tracking ratio reaches 96.5%, indicating high reliability.
Seasonal
variation analysis of this dataset shows that moisture sources for Qinghai-Xizang
Plateau precipitation exhibit significant seasonal characteristics. The
westerlies influence persists throughout the year, while the abundant July
precipitation results from the combined effects of multiple circulation
systems, including the South Asian monsoon, plateau internal circulation, and
westerlies. This complex moisture transport pattern highlights the crucial role
of the Qinghai-Xizang Plateau??s unique geographical location and topographical
features in regulating regional water cycles, while also emphasizing the
synergistic effects of multi-scale atmospheric circulation systems in shaping
plateau precipitation characteristics.
Conflicts of Interest
The
authors declare no conflicts of interest.
References
[1]
Wang, T.,
Zhao, Y. T., Xu, C. Y., et al.
Atmospheric dynamic constraints on Tibetan Plateau freshwater under Paris
climate targets [J]. Nature Climate Change, 2021, 11(3): 219?C225.
[2]
Zhou, T. J.,
Gao, J., Zhao, Y., et al. Water vapor transport processes on Asian Water
Tower [J]. Bulletin of Chinese Academy of Sciences, 2019, 34(11): 1210?C1219.
[3]
Yao, T. D.,
Masson-Delmotte, V., Gao, J., et al. A review of climatic controls on ??18O
in precipitation over the Tibetan Plateau: observations and simulations [J]. Reviews
of Geophysics, 2013, 51(4): 525?C548. https://doi.org/10.1002/rog.20023.
[4]
Zhang, C.
Moisture source assessment and the varying characteristics for the Tibetan
Plateau precipitation using TRMM [J]. Environmental Research Letters,
2020, 15(10): 104003.
[5]
Zhang,
C., Tang, Q. H., Huang, J. C., et al.
Simulating precipitation moisture sources dataset on Qingzang Plateau (1998?C2018)
[J/DB/OL]. Digital Journal of Global Change Data Repository,
2024. https://doi.org/ 10.3974/geodb.2024.09.02.V1.
[6]
GCdataPR
Editorial Office. GCdataPR data sharing policy [OL].
https://doi.org/10.3974/dp.policy.2014.05 (Updated 2017).
[7]
van der Ent, R.
J., Tuinenburg, O. A., Knoche, H. R., et al. Should we use a simple or
complex model for moisture recycling and atmospheric moisture tracking? [J]. Hydrology
and Earth System Sciences, 2013, 17: 4869?C4884.
[8]
van der Ent, R.
J., Wang-Erlandsson, L., Keys, P. W., et al. Contrasting roles of
interception and transpiration in the hydrological cycle?Cpart 2: moisture
recycling [J]. Earth System Dynamics, 2014, 5(2): 471?C489.
[9]
Dee, D. P.,
Uppala, S. M., Simmons, A. J., et al. The ERA-Interim reanalysis:
configuration and performance of the data assimilation system [J]. Quarterly
Journal of the Royal Meteorological Society, 2011, 137: 553?C597.
[10]
Huffman, G. J.,
Bolvin, D. T., Nelkin, E. J., et al. The TRMM Multisatellite
Precipitation Analysis (TMPA): quasi-global, multiyear, combined-sensor
precipitation estimates at fine scales [J]. Journal of Hydrometeorology,
2007, 8(1): 38?C55.
[11]
Rodell, M.,
Houser, P. R., Jambor, U. E. A., et al. The global land data
assimilation system [J]. Bulletin of the American Meteorological Society,
2004, 85: 381?C394.
[12] Yu, L., Weller, R. A. Objectively analyzed air?Csea heat
fluxes for the global ice-free oceans (1981?C2005) [J]. Bulletin
of the American Meteorological Society,
2007, 88(4): 527?C540.
[13] Zhang,
C., Tang, Q. H., Chen, D. L. Recent changes in the moisture source of
precipitation over the Tibetan Plateau [J]. Journal of Climate,
2017, 30: 1807?C1819.