Oases Distribution
and Catalog of China
Gui, D. W.1,2*?? Lin, J. W.1,3?? Liu, Y. F.1,4?? Liu, Q.1,4?? Zhang, S. Y.1?? Liu, C.5*
1 Xinjiang Institute of Ecology and Geography, Chinese Academy of
Sciences, Urumqi 830011, China;
2 Xinjiang Technical Institute of Physics and
Chemistry, Chinese Academy of Sciences, Urumqi 830011, China;
3 University of Chinese Academy of Sciences, Beijing 100049, China;
4 Cele National Station of Observation and Research for Desert-Grassland
Ecosystems, Cele 848300, China;
5 Institute of Geographic
Sciences and Natural Resources Research, Chinese Academy of Sciences, Beijing
100101, China
Abstract: Oases, as azonal geographical units within arid regions, serve
as distinct places for human survival, their livelihood and maintaining
human-environment interactions. Despite their
significant importance in arid zones, oases are confronting the critical challenges
of unclear baseline statistics, uncertain boundaries, and inconsistent data that have been emerged under the rapid development of geospatial
big data technologies. Notably, the absence of systematic cataloging has
hindered the advancement of oasis science. To address these challenges, this
study selected 2020 as the baseline year and employed high-resolution summer
imagery from Google Earth as the primary data source, supplemented by
Sentinel-2 imagery. Through a rigorous three-year process encompassing image
calibration, visual interpretation, field surveys, and manual revisions, we
successfully extracted foundational data on Chinese oases. Subsequently, each
oasis was systematically cataloged based on administrative divisions, river,
and area attributes. Our analysis confirms that China contains 1,466 oases with
individual areas exceeding 0.01 km??, collectively covering 277,375.56 km??
(approximately 3.02% of the national territory). These oases are distributed
between 74.04??E???101.21??E and 35.87??N???48.39??N, spanning five provinces, 22
geomorphic units, and 7 major river basins. In terms of size, super-large oases (>10,000 km??) are predominant, with only eight of such kind of oases covering 151,783.04 km??, which constitutes 54.72% of the total oasis area. Xinjiang Uighur Autonomous Region has
the largest oasis area (171,801.06 km??), representing 63.78% of China's total
oasis area, primarily distributed at elevations of 700???2,600 m. Among
geomorphic units, the Northern Tarim River
lacustrine-alluvial plains small-region exhibits the most extensive oasis distribution (43,613.54 km??) and the
highest concentration of large-sized oases, including the Tarim
Mainstream Oasis, Weigan River Oasis, and Aksu Oasis, etc. The Tarim inflow region contains the largest oasis area (89,723.69 km??, 30.80% of the national
total), where oases form a ring along the periphery of the Taklimakan Desert, and interconnected by the Tarim River. In terms of
quantity, 853 miniature oases (0.01???1 km??) account for 58.19%. Xinjiang has the
largest number of oases (1,078), accounting for 73.53% of the total number of oases in China. This study not only clarifies the
baseline statistics of Chinese oases in 2020 but also fills the critical gap in
systematic oasis cataloging, providing a robust foundation for advancing oasis
science and promoting global research on arid-region ecosystems.
Keywords: arid regions;
oases; cataloging; China; river basins; geomorphic units
DOI: https://doi.org/10.3974/geodp.2025.01.01
1 Introduction
Oases are heterogeneous geographical units formed on desert
substrates in arid regions, driven by stable water sources[1]. They
serve as vital hubs for human livelihoods and biodiversity conservation in arid
regions[2]. Therefore, the stability of oases holds significant importance for the ecological civilization and regional socio-economic
development of arid regions[3,4]. Consequently, they consistently remain a key focus of research and are
attracting increasing attention from scholars in these regions. Particularly
after the systematic introduction of the concept of Oasis Studies by Huang[5],
oasis research gradually became more systematic and turned into a distinctive discipline within the study of arid
regions[6???8]. After 30 years of dedicated research, oasis studies in China have achieved a global prominence, focussing on land use changes in oasis[9], optimization of
oasis water resource allocation[10], oasis evolution under climate
change[11], and studies on suitable scales[12]. Several studies have focused on individual oases[13,14] or
specific regions[15???17] from physical geography point of view. However, with the rapid development of geographic
information and big data, there is still a lack of a complete and clear answer
regarding the total number of spatially independent oases in China and their
geographical attributes, such as location distribution, area boundaries, and
regional affiliation.
The
classification and cataloging of a geographical unit are fundamental tasks in geography and holds significant
academic value in clearly
understanding its distribution and evolutionary patterns. The lack of basic
data on oasis distribution has hindered the progress of oasis cataloging.
Compared to cataloging studies of other geographical units like glaciers[18,19],
lakes[20], and wetlands[21], research on oasis cataloging
remains generally underdeveloped and overlooked, resulting in an incomplete understanding
of oasis science.
Nonetheless, previous scholars in China have made considerable contributions to
the zoning of oases. For example, Shen[22] conducted a comprehensive
classification of China???s oases based on human impact, the formation period and
stages of oases, and their geomorphological location. Yang[23]
systematically explored the principles and methods of oasis zoning and proposed
a three-level zoning scheme for Chinese oases based on climate, geomorphology,
and rivers. These studies about
classification and zoning of oases provided a solid foundation for oasis cataloging and
necessitate further development in this field to improve the oasis research.
Therefore,
this study focuses on China???s oases, selecting 2020 as the baseline year. Based
on the definition of oases, the study uses multi-source remote sensing imagery
and field surveys. The oases are first accurately interpreted through manual
visual analysis, and then each spatially independent oasis is assigned a unique
???academic ID??? based on its geographical attributes. Ultimately, a comprehensive
catalog of oases in China is created to present a panoramic view of oasis
distribution. After three years of dedicated efforts, the research team completed the coding of all oases in
China larger than 0.01 km2.
This coding effectively reflects the spatial distribution characteristics and
natural attributes of the oases, providing a baseline for studies regarding
land use changes in oasis, spatiotemporal variations, and so on. It holds significant implications
for analyzing the causes and mechanisms behind the distribution of oases in
China, advancing oasis research from qualitative to quantitative approaches, and
establishing a strong foundation for the future quantitative study of oases in
Central Asia and even on a global scale.
2 Data and Methods
2.1 Data Sources
The high-precision identification of oases is the foundation for oasis cataloging. The data used in this study
primarily includes satellite remote sensing imagery, Digital Elevation Model
(DEM) data, and basic geographic information of China. The remote sensing
imagery is used to determine the presence of oases, extraction of oasis boundaries, and study oasis habitats. To ensure data
uniformity, accuracy, and scientific reliability, high-precision imagery (from summer of 2020) of northwest China obtained from Google Earth (spatial resolution better than 1
m), was employed for identification and analysis. For areas where some images
had not been updated in a timely manner or had quality issues such as excessive
cloud cover, Sentinel-2 data
released by the European Space Agency (spatial resolution of 10 m), was used as
a substitute. The DEM data were sourced from the 12.5m ALOS satellite product
from the Japan Aerospace Exploration Agency, which was used in conjunction with
remote sensing data to assist visual interpretation and extract geometric
parameters such as slope, aspect, and elevation of the oases. The basic
geographic information of China was obtained from the National Geomatics Center
of China,
which included administrative divisions of provinces and the distribution
of major rivers, providing data for oasis encoding and distribution analysis.
2.2 Methods
Repeated experimentation revealed that existing automatic
oasis extraction methods[24,25], are time-saving and convenient, but they often use low-resolution remote sensing imagery for
large-scale area extraction, resulting in poor extraction quality and accuracy.
This leads to contrasting statistical results regarding oasis numbers and areas, lacking precise quantitative statistics on oasis numbers. Therefore,
this study adopted a manual visual interpretation method, completing the
extraction of oases over a period of three years. The sources of error in oasis
extraction mainly fall into two categories: technical errors and human errors.
To reduce technical errors, each remote sensing image was systematically
radiometrically and geometrically corrected to make the features of image
clearer and consistent with the geographic
locations of the DEM data. Human errors mainly arose from differences in the judgment standards and practical
experience of different operators when determining oasis boundaries. To minimize
subjective errors, an expert group consisting of professionals in the field was
established before the work began. The group discussed and formulated work
guidelines for oasis data extraction (including the operating procedures of Google Earth software,
selection criteria for remote sensing images and specifications for extracting
oasis boundaries, etc.). Additionally, each staff member underwent expert
guidance and skill training before conducting visual interpretation, and was
tested on five experimental areas until they were proficient in identifying
oases based on features such as the shape, size, and shadow of objects, as well
as pixel texture and color. Only after achieving this level of proficiency
could they begin formal oasis extraction work.
During the boundary extraction of oases, it was observed that
the transition zone between oases and deserts shares similar features with the
oasis itself in remote sensing images, which caused problems while classifying some areas[26,27], thus presenting
difficulties in the extraction process. To accurately delineate the boundary
between oases and deserts, we first performed land-use classification on the
remote sensing images and then used the method of calculating the Fractional
Vegetation Cover (FVC) to make the distinction. The resulting FVC values ranged
from 0 to 1. Pixels with FVC
<0.2 (arid) or <0.3 (semi-arid) were classified as desert, while the rest
were designated as oasis areas aligning with soil aridity indices and
vegetation resilience thresholds[28].
In addition, for areas where land-use types were difficult to
identify from the remote sensing imagery or where image quality was
insufficient, detailed field surveys and GPS measurements were conducted to
determine the land features and boundary ranges. This ensured that the
extraction results for most areas of China???s oases had an accuracy within 1 m, while the worst extraction precision being <10 m. The extracted
oasis data for China were then imported into ArcGIS for spatial topology
checks, removing patches smaller than the minimum identifiable area (0.01 km2),
and the data were projected using the Albers Equal-Area Conic projection
(central meridian 91??E, standard parallels 35??N and 49??N, WGS84 coordinate
system) for the purpose of oasis cataloging and area calculations.
2.3 Encoding Rules
|
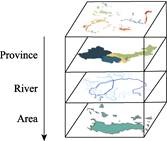
Figure 1 ??Composition of coding attributes for oases of
China
|
Determining a reasonable coding scheme
is the main pillar of
the cataloging process. Based on the previous work of coding the fields of
climate type, province, landform, river and area[29], in order to further reflect the simplicity and combine with
the expert consultation, it was finally determined that China???s oasis
cataloging code consists of three attributes that best reflect the
characteristics of the oasis, namely, province, river and area (Figure 1). Each
oasis code comprises six characters, with two characters allocated to each of
the three attributes. By defining and assigning these coding fields, each oasis
is assigned a unique ???academic ID???. Beyond the coding system, additional
geographic attributes such as latitude and
longitude, perimeter, and elevation were included in the oasis attribute table (Table 1). The complete vector dataset of China???s oases has been
published in the Global Change Research Data Publishing & Repository.
3 Data Results
3.1 Overall Distribution and Scale of
Oases of China
Based on the academic definition of oases, China???s
oases are distributed in the arid and semi-arid regions of Northwest China,
spanning from 74.04??E to 101.21??E, 35.87??N to 48.39??N. These oases are located
in northwestern Xinjiang, Gansu, and Qinghai, northern Ningxia, and
central-western Inner Mongolia, extending westward to the Kashgar region and
eastward to Baotou, bordered by the Altai Mountains to the north, and the
Kunlun and Qilian Mountains to the south (Figure 2). This spatial delineation
is generally consistent with the range
defined in most literature sources[22,23]. However, some studies[30]
have controversially classified areas east of Baotou as part of the
oasis region. Since these areas are no longer within the semi-arid zone, they
are not considered oases in this study.
According to statistical analysis, China has a total of 1,466
spatially independent oases, covering an area of 277,375.56 km??, which accounts
for 3.02% of China???s total land area and approximately 8% of its arid region. Oases in China are distributed
irregularly, with some oases forming
continuous belts along river systems, while
others are scattered as isolated patches in mountainous areas. This distribution pattern reflects the tendency of oases to spread
along mountains, develop around water sources, and inhabit suitable soil
environments.
Table
1 ??Attributes table of the China oases dataset
(part)
|
OasisID
|
ProvinceID
|
RiverID
|
AreaID
|
Area (km2)
|
Perimeter
(m)
|
Longitude
(??E)
|
Latitude (??N)
|
Mean_Elev
(m)
|
|
XJ2401
|
XJ
|
24
|
1
|
33,498.30
|
5,380.39
|
86.91
|
44.45
|
576.50
|
|
QH1501
|
QH
|
15
|
1
|
30,647.27
|
441.84
|
95.08
|
36.97
|
1,067.54
|
|
IM0101
|
IM
|
01
|
1
|
19,956.77
|
2,810,556.99
|
108.14
|
40.55
|
1,008.51
|
|
XJ4201
|
XJ
|
42
|
1
|
19,847.57
|
1,700.63
|
84.91
|
40.86
|
1,259.98
|
|
XJ4601
|
XJ
|
46
|
1
|
14,136.35
|
3,003.74
|
78.03
|
38.95
|
2,206.44
|
|
XJ4301
|
XJ
|
43
|
1
|
10,777.39
|
64,004.84
|
76.57
|
39.28
|
1,997.92
|
|
NX0102
|
NX
|
01
|
2
|
7,757.03
|
809,678.51
|
106.88
|
38.63
|
1,091.11
|
|
GS1201
|
GS
|
12
|
1
|
7,677.37
|
4,232.61
|
102.82
|
37.79
|
1,550.95
|
|
GS0701
|
GS
|
07
|
1
|
6,736.80
|
1,989.15
|
100.47
|
38.89
|
1,523.81
|
|
XJ6201
|
XJ
|
62
|
1
|
3,311.27
|
1,845.63
|
88.34
|
39.12
|
1,564.58
|
|
XJ6101
|
XJ
|
61
|
1
|
3,263.30
|
2,247.24
|
86.59
|
38.74
|
1,733.57
|
|
GS0201
|
GS
|
02
|
1
|
2,439.29
|
37,639.23
|
96.52
|
40.40
|
1,917.41
|
|
NX0103
|
NX
|
01
|
3
|
2,329.93
|
579,639.79
|
105.48
|
37.58
|
1,281.51
|
|
NX0103
|
NX
|
01
|
3
|
2,323.19
|
579,639.79
|
105.48
|
37.58
|
1,281.51
|
|
GS1202
|
GS
|
12
|
2
|
2,198.81
|
3,670.20
|
103.35
|
38.78
|
1,357.35
|
|
GS0301
|
GS
|
03
|
1
|
1,830.21
|
160,134.99
|
94.71
|
40.35
|
1,440.23
|
|
XJ8302
|
XJ
|
83
|
2
|
1,688.97
|
12,531.04
|
81.75
|
41.77
|
1,857.40
|
|
QH7601
|
QH
|
76
|
1
|
1,649.45
|
989.08
|
90.68
|
39.61
|
2,104.10
|
|
NX0104
|
NX
|
01
|
4
|
887.36
|
321,164.73
|
105.07
|
37.02
|
1,666.08
|
|
QH1301
|
QH
|
13
|
1
|
841.89
|
1,189.96
|
94.19
|
38.93
|
746.73
|
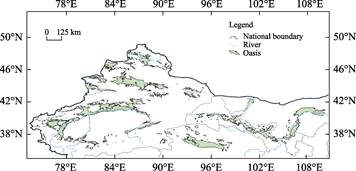
Figure 2 ??Spatial distribution of oases of China (2020)
Furthermore, the analysis also reveals that although small oases
are numerous, they cover only a small fraction of the total oasis area. In
contrast, large oases are less common but make up a substantial portion of the
overall oasis coverage.
3.2 Oasis Distribution Characteristics by Province
The number, area, and proportion of oases in each province
are provided in Table 2. According to the Table 2, Xinjiang has the
highest number and largest area of oases among all
the five provinces, with 1,078
oases, accounting for 73.53% of the total number of oases in China. The total
area is 171,801.06 km2, accounting for 63.78% of the total oasis
area in the country. Over the past 30 years, oasis area in Xinjiang has shown a significant increase and
the proportion of oasis area to its administrative area has increased from
about 5%???8%[31,32] to over 10%
(reaching 10.32%). Oases
in Xinjiang are divided into northern and
southern parts by the Tianshan Mountains. The northern part of Xinjiang, contains the northern Tianshan oasis, formed by regions like Urumqi,
Changji, and Shihezi, as well as the rapidly developing industrial and mining
oasis of Karamay due to oil, and the scenic Ili oasis. The southern part of Xinjiang, comprises of many historically significant oases such as the Hotan, Aksu,
and Kashgar oases.
Qinghai has a relatively small number of oases, with only 25
patches, covering a total area of 30,047.08 km2, ranking second in
China and accounting for 11.15% of the country???s total oasis area. However, due
to Qinghai???s large administrative area, its oasis area proportion is only
4.16%. Qinghai???s oases are predominantly natural, with extensive original
vegetation, making them the least affected by human activities compared to
other provinces.
Gansu ranks second in the number of oases (316 patches) and
third in total oasis area (29,024.79 km2), representing 10.77% of
China???s total oasis area and 8.81% of Gansu???s administrative area. Notably,
southeastern Gansu lies at the transition between semi-arid and semi-humid
zones, where the boundary between oases and non-oases areas is difficult to define. Therefore, the actual oasis area in
Gansu may be larger than reported.
Inner Mongolia and Ningxia have smaller
oasis areas, with 25,201.61 km2 and 13,301.02 km2, accounting for 9.36% and 4.94% of
the national total, respectively. However, due to the relatively small
administrative areas of these provinces, their oasis area proportions are
relatively high, at 21.30% and 20.03%, respectively. In Alxa, Inner Mongolia,
the semi-arid climate has created a landscape with relatively dense herbaceous
and shrub vegetation, which falls outside the academic definition of an oasis.
Consequently, no natural oases exist in this region. However, increasing
population and economic activities have led to extensive groundwater extraction
for irrigation, resulting in the formation of numerous scattered artificial
oases.
Table
2 ??Number, area, and percentage of oases in each
province
|
Province
|
Number
|
Oasis area
(km2)
|
Administrative area (km2)
|
Percentage of total oasis area
(%)
|
Percentage of administrative area
(%)
|
|
Xinjiang
|
1,078
|
171,801.06
|
1,664,900
|
63.78
|
10.32
|
|
Qinghai
|
25
|
??30,047.08
|
722,300
|
11.15
|
??4.16
|
|
Gansu
|
316
|
??29,024.79
|
425,900
|
10.77
|
??8.81
|
|
Inner Mongolia
|
37
|
??25,201.61
|
118,300
|
??9.36
|
21.30
|
|
Ningxia
|
10
|
??13,301.02
|
66,400
|
??4.94
|
20.03
|
China???s oases are classified into 5 categories based on size:
micro oases (0.01???1 km2), small oases (1???100 km2), medium
oases (100???1,000 km2), large oases (1,000???10,000 km2),
and extra-large oases (>10,000 km2)[33]. Statistical
charts and percentage-stacked graphs of the number and area of oases at
different scales in each province are presented in Figure 3 and 4. As shown in the figures,
micro oases (0.01???1 km2) are the most frequent in the four provinces of Xinjiang, Gansu, Inner Mongolia,
and Ningxia, accounting for 59.65%, 59.81%, 43.24%, and 40.00% of the total
number of oases in each province, respectively. Despite their large numbers,
micro oases cover a small area, with a total of just 244.18 km2. As
the oasis size category increases, the number of oases decreases, while the
total area occupied by these oases progressively increases, albeit at a
diminishing rate.
The number of small oases (1???100 km2) is 523, covering an area of 6,264.85 km2, mainly
distributed in Xinjiang, Inner Mongolia, and Gansu. Compared to micro oases,
their number decreased by 15.10%, but their total area was increased by 24.66 times. The number of
medium oases (100???1,000 km2) is 53, accounting for 3.62% of the
total number of oases in China, with a combined area of 16,734.13 km2,
representing 6.03% of the total oasis area. Among them, Qinghai has the highest
proportion of small and medium-sized oases, reaching 25.71%.
The number of large oases (1,000???10,000 km??) is 29,
accounting for 1.98% of the total number of oases in China, with a total area
of 100,517.68 km2, representing 36.23% of the total oasis area.
Among these, the proportion of large oasis areas was the highest in Ningxia (85.99%) and Gansu (93.30%). Compared to medium oases, the number of large oases decreased by 45.28%, but their total area increased by 5.01 times. The number of extra-large oases (>10,000
km2) are extremely rare, with only 8 in total, out of which 6 are located in Xinjiang, and one each in Qinghai and Inner
Mongolia. These extra-large oases account for just 0.54% of the total number of
oases in China but cover a vast area of 151,783.04 km2, making up
54.72% of the total oasis area. Compared to large oases, the number of
extra-large oases decreased by 72.41%, while their total area
increased by 0.51 times.
Based on the spatially contiguous oasis areas, the ten
largest oases in China are: the middle and lower reaches of the Tarim River
Oasis (51,900.52 km2), the northern slope of the Tianshan Mountains
Oasis (33,498.30 km2), the Qaidam Basin Oasis (30,647.27 km2),
the Hetao Plain Oasis (30,043.73 km2), the Kashgar-Yarkand River
Oasis (24,960.17 km2), the Shiyang River Oasis (10,851.67 km2),
the Irtysh River Oasis (10,774.94 km2), the Ili Oasis (9,080.27 km2),
the middle reaches of the Heihe River Oasis (6,736.80 km2), the Emin
River Oasis (6,248.26 km2).
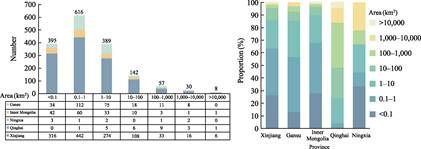
Figure 3 ??Number and percentage of oases by different
scales in 5 provinces of China

Figure 4??
Area and percentage of
oases by different scales in 5 provinces of China
From the ridge plot of the average elevation distribution of
oases in each province (Figure 5), it can be observed that the elevation range of
oases in Xinjiang is the widest, forming multiple ridges. The lowest point is
below sea level, while the highest point approaches 4,000 m. The majority of
oases are concentrated between 700 m and 2,600 m. The elevation distribution of
oases in Qinghai is relatively balanced, with a smaller range of variation, as
all oases are located in high-altitude regions. The lowest point is
approximately 2,600 m, while the highest exceeds 3,100 m, forming a distinct
bimodal structure. The peak values, indicating areas with concentrated oasis
distribution, are around 2,800 m and 3,000 m.
|
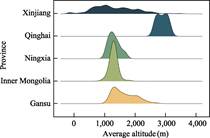
Figure 5?? Ridge map of
average elevation distribution of oases by province of China
|
The elevation distribution characteristics of oases in
Ningxia and Inner Mongolia are similar, with relatively lower overall
elevations compared to other regions. The lowest elevations in both provinces
are around 900 m, and the ridge plots exhibit a unimodal structure, with peak
values at approximately 1,300 m in Ningxia and 1,400 m in Inner Mongolia. The
elevation distribution of oases in Gansu is wider, ranging from a minimum of approximately 1,000 m to a
maximum exceeding 2,700 m. The distribution forms two peaks, one major and one
minor. Around the main peak at 1,300 m, 49.22% of the oases are distributed,
while around the secondary peak at 2,200 m, 10.85% of the oases are found.
3.3 Oasis Distribution and Scale across Different
Geomorphological Units
Geomorphological units, as the primary receptors and media
for light, thermal energy, and water, directly influence the regional environment and distribution of surface water and thermal energy. They
also affect the conversion processes of land, vegetation, and their products,
as well as the succession and evolution of ecosystems indirectly. The formation and development of oases are
closely related to specific geomorphological locations, and the type of
landform is strongly correlated with the geometric configuration and spatial
distribution under these conditions of oases. In China, oases are predominantly
distributed in plains and basins, covering a total area of 255,476.68 km2,
accounting for 92.10% of the total oasis area. The number of oases is 1,181,
making up 80.56% of the total number of oases.
According to the Chinese geomorphological classification
system[34], the regions where China???s oases are located are divided
into 22 geomorphological units (Table 3). The top three geomorphological units
with the largest oasis areas are the Northern Tarim River lacustrine-alluvial
plains small-region (43,613.54 km2), the Qaidam Basin small-region (38,315.63 km2), and the
Southern margin of Junggar Basin diluvial-alluvial plains small-region
(34,396.02 km2), which account for 15.52%, 13.81%, and 12.40% of the
total oasis area in China, respectively. The Northern Tarim River
lacustrine-alluvial plains small-region, located in the Tarim River Basin, is
formed by river erosion and lake deposition. The terrain is flat, and the water
and soil conditions are favorable for human settlements, supporting large oases such as the Tarim River main stream
oasis, the Weigan River oasis, and the Aksu oasis. The Qaidam Basin
small-region, surrounded by a series of northwest-southeast parallel mountain
ranges and wide valleys, has favorable heat conditions in the center, allowing
the deposition of material carried from the surrounding mountains. This leads
to fewer oases (27 in total), but a very large oasis (30,647.27 km2)
exists in the center of the basin. The Southern margin of Junggar Basin
diluvial-alluvial plains small-region relies mostly on natural precipitation
for vegetation development, with relatively uniform seasonal water
distribution. This is the only region in China???s desert areas where vegetation is distributed in a non-contracted pattern.
The top three geomorphological units in terms of oasis
quantity are the Hexi Corridor alluvial-diluvial plains small-region (235
oases), the Turpan-Hami alluvial-diluvial plains small-region (211 oases), and
the Southern margin of Tarim River alluvial-diluvial plains small-region (140
oases), which account for 16.03%, 14.39%, and 9.55% of China???s total oases,
respectively. The Hexi Corridor alluvial-diluvial plains small-region consists
of the Anxi-Dunhuang Basin, the Jiuquan-Zhangye Basin, and the Wuwei Basin. Due
to its unique geographical location and favorable terrain, this area has long
been a major communication route in central and western China, with a long
history of development. The Hexi Corridor has not only many oases but also contains considerable oasis areas (25,482.18 km2). The
Turpan-Hami alluvial-diluvial plains small-region is the driest and hottest
region in Xinjiang, making it difficult to form perennial rivers. Historically,
people used qanat systems to channel water into oases, leading to a high degree
of fragmentation, but also many oases. The Southern margin of Tarim River
alluvial-diluvial plains small-region includes five medium-sized oases in areas
such as Cele, Yutian, Minfeng, Ruoqiang, and Qiemo. Each oasis is linked to the
river that provides water and soil, but the rivers are relatively short, and
their outlets lead into the desert, which makes the oases scattered and loosely
connected in this
area. Additionally, the western segment
of central Kunlun Mt. high mountains and lake basins small-region, with its
high altitude and barren soil, belongs to a plateau temperate climate. Under such conditions, the oasis
formation is very difficult resulting in a few and small size oases. Therefore,
the only oasis in the Altyn-Tagh Mountain area, which is abundant in lakes, is
located here.
Table
3 ??Statistics of oases in different geomorphological
units
|
Geomorphological
Units
|
Area (km2)
|
Number
|
|
Northern Tarim River lacustrine-alluvial plains small-region
|
43,613.54
|
125
|
|
Qaidam Basin small-region
|
38,315.63
|
27
|
|
Southern margin of Junggar Basin diluvial-alluvial plains small-region
|
34,396.02
|
41
|
|
Hetao alluvial plains small-region
|
27,714.43
|
9
|
|
Hexi Corridor alluvial-diluvial plains small-region
|
25,482.18
|
235
|
|
Southern margin of Tarim River alluvial-diluvial plains small-region
|
24,084.52
|
140
|
|
Ulungur and Ertix rivers alluvial plains small-region
|
12,331.79
|
41
|
|
Kashgar diluvial-alluvial plains small-region
|
11,173.14
|
59
|
|
Central Tianshan Mt high mountains and basins small-region
|
9,100.20
|
6
|
|
Yanqi Basin small-region
|
8,855.34
|
57
|
|
Western Junggar middle mountains and hills small-region
|
7,769.56
|
102
|
|
Southeastern margin of Tarim River alluvial-diluvial platforms and
plains small-region
|
6,628.62
|
12
|
|
Liupan Mt middle and low mountains, hills and valleys small-region
|
5,543.84
|
6
|
|
Mazong Mt middle mountains and hills small-region
|
4,653.37
|
4
|
|
Tianshan Mt north piedmont low mountains, hills and plains small-region
|
4,344.45
|
108
|
|
Turpan-Hami alluvial-diluvial plains small-region
|
4,340.83
|
211
|
|
Alxa plateaus, hills, aeolian plains small-region
|
4,133.59
|
109
|
|
Eastern Tianshan Mt. high mountains small-region
|
1,563.85
|
67
|
|
Gurbantunggut Desert small-region
|
1,475.91
|
21
|
|
Western segment of central Kunlun Mt high mountains and lake basins
small-region
|
962.40
|
1
|
|
Western Kunlun Mt high and extremely high mountains small-region
|
485.20
|
13
|
|
Southern Tianshan Mt high mountains small-region
|
407.13
|
72
|
3.4 Oasis Distribution and Scale across River Basins
Rivers originating from mountainous
areas are the main driving factors responsible for oasis formation[35]. Spatial variation in river directly governs the
spatial distribution of oases[36]. Water is essential for an
oasis, and its absence leads to desertification. The amount of river runoff
directly impacts the existence, development scale, and disappearance of oases,
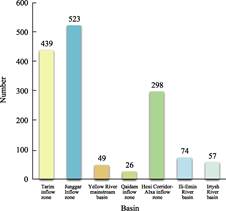
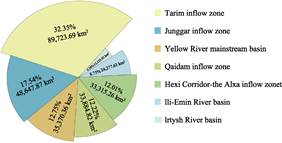
while the number of rivers also determines the number of oases. As shown in Figure 6, oases in China are
distributed across the Yellow River mainstream basin, the Hexi Corridor-the
Alxa inflow zone, the Qaidam inflow zone, the Junggar inflow zone, the Tarim
inflow zone, the Irtysh River basin, and the Ili-Emin River basin. The area and proportion
of oases in each river basin are shown in Figure 7.
 ??
??
????
Figure 6??
Number of oases in each basin???????? Figure
7?? Area and percentage of oases in
each basin
Among these, the Tarim inflow zone has the largest oasis area
(89,723.69 km2), accounting for 32.35% of the total oasis area in
China. Located in southern Xinjiang, between the Tianshan and Kunlun Mountains
ranges, this is the world???s largest inland river basin. The water sources of the Tarim River mainly come from the Aksu,
Hotan, and Yarkand rivers, which irrigate and form a massive ring of oases
surrounding the Taklamakan Desert.
The Junggar inflow zone has a dense and complex river
network. While its oasis area (48,647.87 km2) is smaller than the
Tarim inland basin, it contains a greater number of oases (523 oases), which
account for 35.68% of the total number of oases in China. The oasis economy
here is also more developed than the Tarim River inland basin. Notably, the northern
foothills of the Tianshan Mountains are rich in rivers, such as the Manas and
Kuitun rivers, which provide abundant water for the formation of oases along
the northern Tianshan slopes.
In the Qaidam inflow zone, all rivers originate from the
surrounding high mountains, and the basin
almost does not generate runoff. Furthermore, the runoff is extremely unevenly
distributed throughout the year. As a result, although the oasis area is large
(35,370.36 km2), the closed terrain and limited basin area dictate
the inland nature of the Qaidam water system and the shortness of its rivers.
These features create a radial distribution of oases, with fewer oases (26 in
total), which are concentrated in the lower-altitude central parts of the
basin.
The Yellow River mainstream basin has a large oasis area
(33,884.82 km2), but fewer oases (49 oases), accounting for 12.22%
and 1.09% of China???s total oasis area and quantity, respectively. The Yellow
River, often known as the ???Mother River of the Chinese nation???, provides
abundant water and fertile silt to the regions it flows through. It forms three
major exogenous oasis areas in the Hetao Plain: the Ningwei Plain, the Yinchuan
Plain, and the Houtao Plain. Particularly, the Houtao Plain oasis area, located
at the ???S??? shaped bend of the Yellow River, is China???s largest ancient
irrigation area, historically known as an area of strategic importance and a
vital grain production base and ecological protection barrier.
In the Hexi Corridor-the Alxa inflow zone, the oasis area is
not very large (33,315.26 km2), but the number of oases is
relatively high (298 oases). Similar to the northern Tianshan foothills, the
Hexi Corridor features many rivers, including the Heihe, Shiyang, and Shule
rivers, forming the Hexi Corridor oasis group. Among them, the Heihe River
basin has the largest oasis area (16,147.52 km2) and the most oases
(132 oases), with many oases concentrated along riverbanks and delta regions.
The Ili-Emin River basin has an oasis area of 24,277.63 km??,
which accounts for 8.75% of China???s total oasis area. The Ili River basin,
located near the highest peak of the Tianshan Mountains, has a climate that
differs significantly from other arid regions, with some areas receiving over
400 mm of rainfall and being less affected by sandstorms and droughts. Most of
the oases are river valley oases irrigated by the Ili River, offering fertile
land and abundant pasture, thereby the region is called as ???wet island??? of Central Asia???s arid zone.
The Irtysh River basin, which originates from China???s Altai
Mountains, is an exogenous river with the second-largest flow among rivers in
Xinjiang. However, due to its location in the northernmost part of Xinjiang and
its poor thermal conditions (with an average annual temperature ranging from 2 ???
to 4 ???), the oasis area here (12,155.92 km2) is the smallest among
the seven basins, accounting for only 4.38% of the total oasis area in China.
The number of oases (57 oases) is also relatively low.
4 Conclusion and Outlook
The first comprehensive cataloging of China???s oases has been
completed, using 2020 as the baseline year. This effort has resulted in a
detailed understanding of the current state of oases across various
geomorphological units and river basins throughout the country. This study advances oasis research
and provides a foundation for understanding future oasis dynamics. It addresses
discrepancies in research data and establishes a robust baseline for the
continuity of oasis cataloging in the future. Based on this cataloging, the general distribution of oases
in China can be summarized as follows.
In 2020, the total area of oases in China was 277,375.56 km2,
with 1,466 oases distributed across the northern regions of Xinjiang, Gansu,
Qinghai, Ningxia, and the western part of Inner Mongolia. These oases are
distributed either as continuous oasis belts along the same river or as
isolated blocks spread across mountainous areas.
In terms of oasis distribution across different provinces, Xinjiang emerges as the predominant region,
comprising 63.78% of the China???s total oasis area, while Ningxia has the smallest oasis area. Xinjiang also has the highest number of oases, while Gansu, Inner Mongolia, Qinghai, and Ningxia
have relatively fewer oases. The altitudes of oases also vary across provinces, with Xinjiang having the widest range of elevations, oases in Qinghai are at the highest overall altitudes, while the altitudes of oases in Ningxia and Inner Mongolia are
similar.
The 22 geomorphological units comprising of oases, flat plains and basin areas account for 92.10% of the
total oasis area and 80.56% of the total number of oases in China. In terms of
area, the largest oasis areas are in the Northern Tarim River
lacustrine-alluvial plains small-region, followed by the Qaidam Basin
small-region and the Southern margin of Junggar Basin diluvial-alluvial plains
small-region. In terms of numbers, the Hexi Corridor
alluvial-diluvial plains small-region has the greatest number of oases, followed by the Turpan-Hami alluvial-diluvial plains
small-region and Southern margin of Tarim River alluvial-diluvial plains
small-region.
In terms of oasis distribution across different river basins,
most oases are in inland river basins. The Tarim
inflow zone has the largest oasis area, accounting for 32.35% of the total
oasis area in China. The Junggar inflow zone has the most oases, accounting for
35.68% of the total number of oases in the country. Oases in exogenous basins
are mainly distributed along the Yellow River mainstream basin, but these oases
are fewer in number and smaller in size.
While significant strides have been made
in the systematic documentation of China???s oases, this represents merely the
initial step in the current era of geographic information big data. There is still much work that remains to
be done in expanding and advancing oasis research. First, it is necessary to
expand this research beyond China by conducting thorough and precise
identification and cataloging of global oases using 2020 as the baseline. This
initiative would represent a significant advancement in the field. Second, the limitations of current oasis
identification methods must be recognized. Although high-precision oasis
identification has been achieved, manual visual interpretation methods are time-consuming and costly, and
cannot effectively meet the need for catalog updates. Therefore, it is crucial
to integrate rapidly developing artificial intelligence image recognition
technologies to address the technical challenges of high-resolution oasis
identification. This will allow a rapid updating of oasis cataloging. Third, many detailed studies require further
refinement, such as
distinguishing between oases in hot and cold deserts, the accurate
identification and evolutionary mechanisms of natural versus artificial oases,
and strategies for the sustainable development and adaptation under future climate change. These
efforts require the involvement of more scholars, open sharing of data, and the development of geographically relevant technologies
aligned with current advancements.
Author Contributions
Gui,
D. W. and Liu, C. were responsible for the formulation of the technical
specifications and the overall design of the paper framework; Lin, J. W.
collected and processed the data; Zhang, S. Y. conducted data validation; Gui,
D. W. and Lin, J. W. wrote the data paper; Liu, Q. and Liu. Y. F. provided
guidance and revised the paper.
Acknowledgements
We would like
to express our sincere gratitude to Professor Yang, Faxiang and Professor Lei,
Jiaqiang from the Xinjiang Institute of Ecology and Geography, Chinese Academy
of Sciences, for their encouragement and strong support throughout this work.
Our heartfelt thanks also go to Professor Chunxi from Inner Mongolia Normal
University for the professional advice provided in the oasis identification
work in semi-arid regions.
Conflicts of Interest
The
authors declare no conflicts of interest.
References
[1]
Lin, J. W., Gui, D. W., Zhang,
S. Y., et al. Dataset development of the Hotan Oasis, water system,
watershed, and elevation [J]. Journal of Global Change Data &
Discovery, 2023, 7(3): 314???320. https://doi.org/ 10.3974/geodp.2023.03.10.
[2]
Wang, T., Wang, Z., Guo, L., et
al. Experiences and challenges of agricultural development in an artificial
oasis: a review [J/OL]. Agricultural Systems, 2021, 193: 103220. DOI:
10.1016/j.agsy.2021.103220.
[3]
Xue, J., Gui, D. W., Lei, J.
Q., et al. Oasification: an unable evasive process in fighting against
desertification for the sustainable development of arid and semiarid regions of
China [J]. Catena, 2019, 179: 197???209.
[4]
Wei,
H. J., Liu, H. M., Xu, Z. H., et al. Linking ecosystem services supply,
social demand and human well-being in a typical mountain-oasis-desert area,
Xinjiang, China [J]. Ecosystem Services, 2018, 31: 44???57.
[5]
Huang, S. Z. On oasis research
and oasis science [J]. Collections of Essays on Chinese Historical Geography,
1990, (2): 1???24.
[6]
Gui, D. W., Zeng, F. J., Lei,
J. Q., et al. Suggestions for sustainable development of the oases in
the south rim of Tarim Basin [J]. Journal of Desert Research, 2016,
36(1): 6???11.
[7]
Tao, W. Review and prospect of
research on oasification and desertification in arid regions [J]. Journal of
Desert Research, 2009, 29(1): 1???9.
[8]
Du, H. R., Liu, Y. Progress on
the study of oasis cities in arid zone of China [J]. Progress in Geography,
2005, 24(2): 69???79.
[9]
Zhang, Q., Luo, G., Li, L., et
al. An analysis of oasis evolution based on land use and land cover change:
a case study in the Sangong River Basin on the northern slope of the Tianshan
Mountains [J/OL]. Journal of Geographical Sciences, 2017, 27(2):
223???239. DOI: 10.1007/s11442-017-1373-9.
[10]
Wang,
J. F., Cheng, G. D., Gao, Y. G., et al. Optimal water resource
allocation in arid and semi-arid areas [J/OL]. Water
Resources Management, 2008, 22(2): 239???258.
DOI:10.1007/s11269-007-9155-2.
[11]
Liu, X., Shen, Y.
Quantification of the impacts of climate change and human agricultural
activities on oasis water requirements in an arid region: a case study of the
Heihe River Basin, China [J/OL]. Earth System Dynamics, 2018, 9(1):
211???225. DOI: 10.5194/esd-9-211-2018.
[12]
Guo, H., Ling, H., Xu, H., et
al. Study of suitable oasis scales based on water resource availability in
an arid region of China: a case study of Hotan River Basin [J/OL]. Environmental
Earth Sciences, 2016, 75(11): 984. DOI: 10.1007/s12665-016-5772-5.
[13]
Liu, Y., Shen, M. Y., Zhao, J.
P., et al. A new optimization method for the layout of pumping wells in
oases: application in the Qira Oasis, Northwest China [J]. Water, 2019,
11(5): 970.
[14]
Xue, D. P., Dai, H., Liu, Y., et
al. Interaction simulation of vadose zone water and groundwater in Cele
Oasis: assessment of the impact of agricultural intensification, northwestern
China [J]. Agriculture-Basel, 2022, 12(5): 641. DOI:
10.3390/agriculture12050641.
[15]
Bie, Q., Xie, Y. W. The
constraints and driving forces of oasis development in arid region: a case
study of the Hexi Corridor in northwest China [J]. Scientific Reports,
2020, 10(1): 17708.
[16]
Li, Q. G., Wang, L. C., Gul, H.
N., et al. Simulation and optimization of land use pattern to embed
ecological suitability in an oasis region: a case study of Ganzhou District,
Gansu Province, China [J]. Journal of Environmental Management, 2021,
287: 112321.
[17]
Sun, F., Wang, Y., Chen, Y. N.,
et al. Historic and simulated desert-oasis ecotone changes in the arid
Tarim River Basin, China [J]. Remote Sensing, 2021, 13(4): 647.
[18]
Pfeffer, W. T., Arendt, A. A.,
Bliss, A., et al. The Randolph Glacier Inventory: a globally complete
inventory of glaciers [J]. Journal of Glaciology, 2014, 60(221):
537???552.
[19]
Liu, S. Y., Yao, X. J., Guo, W.
Q., et al. The contemporary glaciers in China based on the Second
Chinese Glacier Inventory [J]. Acta Geographica Sinica, 2015, 70(1):
3???16.
[20]
Verpoorter, C., Kutser, T.,
Seekell, D. A., et al. A global inventory of lakes based on
high-resolution satellite imagery [J]. Geophysical Research Letters,
2014, 41(18): 6396???6402.
[21]
Cong,
Y., Zou, Y. C., Lv, X. G., et al. Comparison of weltland resoures
inventory and weltland monitoring [J]. Wetland
Science, 2021, 19(3): 277???284.
[22]
Shen, Y. C., Wang, J. W., Wu,
G. H. Oases as well as their sustainable development and constructions in China
[J]. Journal of Arid Land Resources and Environment, 2002(1): 1???8.
[23]
Yan, F. X., Fu, Q., Mu, G. J., et
al. Study on regionalization of oases in China [J]. Arid Zone Research,
2007, 24(5): 5.
[24]
Kennedy, R., Yang, Z. Q.,
Gorelick, N., et al. Implementation of the LandTrendr algorithm on
Google Earth Engine [J]. Remote Sensing, 2018, 10(5): 691.
[25]
Yao, J. X., Wu, J., Xiao, C.
Z., et al. The classification method study of crops remote sensing with
deep learning, machine learning, and Google Earth Engine [J]. Remote Sensing,
2022, 14(12): 2758.
[26]
Ji, S. X., Bai, X. L., Qiao, R.
R., et al. Width identification of transition zone between desert and
oasis based on NDVI and TCI [J]. Scientific Reports, 2020, 10(1): 8672.
[27]
Chang, J. J., Gong, L., Zeng,
F. J., et al. Using hydro-climate elasticity estimator and geographical
detector method to quantify the individual and interactive impacts on NDVI in
oasis-desert ecotone [J]. Stochastic Environmental Research and Risk
Assessment, 2022, 36(10): 3131???3148.
[28]
Amuti, T., Luo, G. Analysis of
land cover change and its driving forces in a desert oasis landscape of
Xinjiang, northwest China [J]. Solid Earth, 2014, 5(2): 1071???1085.
[29]
Lin,
J. W., Gui, D. W., Liu, Y. F., et al. A high-precision oasis dataset for
China from remote sensing images [J]. Scientific
Data, 2024, 11: 726.
[30]
Chen, P., Wang, S., Liu, Y. X.,
et al. Spatio-temporal patterns of oasis dynamics in China???s drylands
between 1987 and 2017 [J]. Environmental Research Letters, 2022, 17(6):
064044.
[31]
Yang, Q., Lei, J. Q., Wei, W.
S., et al. The impact of artificial oases on summer climate change
trends [J]. Acta Ecologica Sinica, 2004(12): 2728???2734.
[32]
Yang, Z., Lei, J., Duan, Z. L.,
et al. Spatial distribution characteristics of the population in
Xinjiang [J]. Geographical Research, 2016, 35(12): 2333???2346.
[33]
Han, D. L. Artificial Oases in
Xinjiang [M]. Beijing: China Environmental Science Press, 2001.
[34]
Cheng, W. M., Zhou, C. H., Li,
B. Y., et al. Geomorphological regionalization theory system and
division methodology of China [J]. Journal of Geographical Sciences,
2019, 74(5): 839???856.
[35]
Yang, S. T., Yu, X. Y., Ding,
J. L., et al. A review of water issues research in Central Asia [J]. Journal
of Geographical Sciences, 2017, 72(1): 79???93.
[36]
Jin,
X. M., Schaepman, M., Clevers, J., et al. Correlation between annual
runoff in the Heihe River to the vegetation cover in the Ejina Oasis (China)
[J]. Arid Land Research and Management, 2010, 24(1): 31???41.