Reconstruction Dataset of Cropland Change in Five Central
Asian Countries over the Last
Millennium
Jiang, C. Ye, Y.* Fang, X. Q. Zhang, C. P. Zhang, D. Y.
Faculty of Geographical
Science, Beijing Normal University, Beijing 100875, China
Abstract: Reconstructing land use and
cover change (LUCC) is an important task for global change research. As one of
the important ways to use land, cropland is the focus for the reconstruction of
historical land cover datasets. This study reconstructed the total cropland
area of five Central Asian countries over the last millennium based on
historical documents and used a gridded allocation algorithm to develop gridded
cropland fraction data with a spatial resolution of 5¢´5¢. The main
conclusions are as follows: (1) the change in cropland area in five Central
Asian countries between 1000 A.D. and 2000 A.D. had three phases of
"steady with fluctuations - growth - decline". (2) The cropland is
mainly distributed in oases along rivers, with a tendency to expand outward over
time. (3) After 1850 A.D., the increase in cropland area mainly occurred in the
northern part of Kazakhstan. This dataset includes tables of total cropland
area in five Central Asian countries for the last millennium archived in.xlsx
data format and preserved 5¢´5¢ gridded
cropland fractions of five Central Asian countries over the last millennium
archived in.img data format with a data size of 8.61 MB (compressed into one
single file with 422 KB).
Keywords: land use/cover change; cropland
area; gridded allocation; five Central Asian countries
DOI: https://doi.org/10.3974/geodp.2022.03.07
CSTR: https://cstr.escience.org.cn/CSTR:20146.14.2022.03.07
Dataset Availability Statement:
The dataset
supporting this paper was published and is accessible through the Digital Journal of
Global Change Data Repository at: https://doi.org/10.3974/geodb.2022.04.10.V1 or https://cstr.escience.org.cn/CSTR:20146.11.2022.04.10.V1.
1 Introduction
Land
use/cover change (LUCC) has affected natural terrestrial ecosystems and biodiversity
as well as has altered the albedo and radiative forcing on the land surface,
which consequently changed global biogeochemical cycles (carbon cycle, nitrogen
cycle, etc.), resulting in far-reaching implications for global climate change[1?C5].
As one of the land use types with the most influential and far-reaching impact
on the original land cover, cropland has been the focus of research regarding
historical land use/cover change. The six existing global- scale historical
land cover datasets (HH[6], SAGE[7], HYDE3.2[8],
PJ[9], LUH[10], KK10[11]) all contain
reconstructions of cropland data.
Reconstruction of relatively accurate
historical cropland cover change based on regional history is one of the
fundamental ways to improve the accuracy of global land cover data[12].
Existing regional reconstructions of historical cropland cover change are
mostly concentra-
ted
in traditional farming regions, such as China[13?C16], Germany[17?C19],
France[20,21], and America[22], while few studies have
been conducted on nonmajor farming regions.
The five Central
Asian countries include Kazakhstan, Tajikistan, Uzbekistan, Kyrgyzstan and
Turkmenistan. Because the five Central Asian countries are landlocked and water
resources are scarce, the majority of this region has been historically
dominated by pastoralism, with only a small amount of cropland in oases around
the Syr Darya and Amu Darya[23]. However, since Tsarist Russia
invaded the five Central Asian countries in the mid-19th century, Kazakhstan??s
agriculture has grown at an astonishing rate in just over 100 years, and
Kazakhstan is now the largest food producer in Central Asia and a major global
food exporter[24]. Therefore, reconstructing the cropland cover
change over the last millennium in five Central Asian countries can not only
help to characterize the spatial and temporal changes in cropland cover in
nonmajor farming regions but also help to understand the impact of
physiogeographic factors associated with human production patterns as well as determine
how humans surpass the limits of physical conditions to exploit land.
This dataset
reconstructed the cropland cover change in five Central Asian countries over
the last millennium based on historical documents. It includes total cropland
area in five Central Asian countries for 25 time sections during 1000-2000 A.D. and 5¢´5¢ gridded cropland cover data for 8 time
sections during 1000-2000 A.D.
The overall goal is for this study to provide a reference for historical
cropland cover reconstruction in nonmajor farming regions.
2 Metadata of the Dataset
The
metadata of the Reconstruction dataset of cropland change in five Central Asian
countries over the last millennium (1000-2000)[25] are summarized in Table 1. It includes the
dataset full name, short name, authors, year of the dataset, spatial
resolution, data format, data size, data files, data publisher, and data
sharing policy, etc.
3 Methods
The
development of this dataset consists of the following two main elements: (1) Reconstruction
of cropland area; (2) Gridded allocation. The data sources and references are
shown in Table 2 and Table 3.
3.1 Methods for Reconstructing Cropland Area
The
cropland area for the 13 time sections in this study between 1954 A.D. and 2000
A.D. was obtained directly from the data sources listed in Table 2, and no
direct data sources were available for each time section prior to 1954 A.D. In
these time sections for which no direct data are available, the cropland area
in 1928 A.D. was obtained from statistical yearbooks and historical documents
that combined with the 1954-2000 A.D.
cropland area. The cropland area for the 11 time sections between 1000 A.D. and
1850 A.D. were derived from historical documents and extrapolated back from the
1928 A.D. reconstruction results.
Table 1 Metadata summary of the Reconstruction dataset of cropland
change in five Central Asian countries over the last millennium (1000-2000)
|
Items
|
Description
|
|
Dataset
full name
|
Reconstruction
dataset of cropland change in five Central Asian countries over the last
millennium (1000-2000)
|
|
Dataset
short name
|
CroplandCentralAsia_1000-2000
|
|
Authors
|
Jiang,
C. AEN-4274-2022, Beijing Normal University, jayciejiang@mail.bnu.edu.cn
Ye,
Y., Beijing Normal University, yeyuleaffish@bnu.edu.cn
Fang,
X. Q., Beijing Normal University, xfang@bnu.edu.cn
Zhang,
C. P., Beijing Normal University, cpzhang01@163.com
Zhang,
D. Y., Beijing Normal University, zdy2014@mail.bnu.edu.cn
|
|
Geographical
region
|
(Under
modern frontiers) Kazakhstan, Tajikistan, Uzbekistan, Kyrgyzstan and
Turkmenistan
|
|
Year
|
1000-2000A.D.
|
|
Spatial
resolution
|
5¢´5¢
|
|
Data
format
|
.xlsx,
.img
|
|
|
|
Data
size
|
8.61
MB (422 KB after compression)
|
|
|
|
Data
files
|
(1) Data archived in .xlsx
data format includes two tables:
Table 1. Total cropland area
of five Central Asian countries during 1000-2000
Table 2. Cropland area of each
five Central Asian country during 1928-2000
(2) Data archived in .img data
format includes 8 time sections (1000 A.D., 1200 A.D., 1400 A.D., 1500 A.D.,
1750 A.D., 1850 A.D., 1928 A.D., 2000 A.D.) of gridded cropland fraction in
five Central Asian countries
|
|
Foundation
|
Ministry
of Science and Technology of P. R. China (2017YFA0603304)
|
|
Data
publisher
|
Global Change Research Data Publishing &
Repository, http://www.geodoi.ac.cn
|
|
Address
|
No.
11A, Datun Road, Chaoyang District, Beijing 100101, China
|
|
Data
sharing policy
|
Data from
the Global Change Research Data Publishing & Repository includes metadata, datasets (in the Digital Journal of Global Change Data Repository), and
publications (in the Journal of Global Change Data & Discovery). Data sharing policy
includes: (1) Data are openly available and can be free downloaded via the
Internet; (2) End users are encouraged to use Data subject to citation;
(3) Users, who are by definition also value-added service providers, are welcome
to redistribute Data subject to written permission from the GCdataPR
Editorial Office and the issuance of a Data redistribution license; and
(4) If Data are used to compile new datasets, the ??ten per cent
principal?? should be followed such that Data records utilized should not
surpass 10% of the new dataset contents, while sources should be clearly
noted in suitable places in the new dataset[26]
|
|
Communication and searchable system
|
DOI, CSTR, Crossref, DCI, CSCD,
CNKI, SciEngine, WDS/ISC, GEOSS
|
Table 2 Data sources and references for the
reconstruction of cropland area
|
Type of data
|
Data sources and references
|
Time
|
|
Cropland area
|
FAO[27]
|
2000
|
|
Compilation of Economic Statistics of the
Five Soviet Central Asian Republics[28]
Statistical Yearbook of the National
Economy of the USSR 1956[29]
Compilation of Soviet Agricultural
Statistics[30]
Sixty Years of Soviet National Economy[31]
|
1928, 1954, 1955, 1958, 1959, 1962, 1968, 1975, 1976, 1978, 1980, 1983
|
|
Population
|
Atlas of World Population History[32]
|
1000-1850
|
|
Study of Population Issues in Central Asia[33]
|
1750, 1850
|
|
Qualitative description of agricultural
historical facts
|
Outline of Central Asia History[34]
Outline History of Five Central Asian
Countries[35]
General History of Central Asia[36,37]
History of Central Asia[38?C40]
History of Civilizations of Central Asia[41]
History of the Conquest of Central Asia[42]
|
1000-2000
|
|
A History of the Tsarist Russia Conquest of
Central Asia[43]
Soviet Exploitation of Central Asia and
Kazakhstan[44]
Study of the Policy of Russian Rule in
Central Asia[45]
|
1750, 1850, 1928
|
|
Brief History of Central Asia[46]
History of the World Conquer[47]
Turkestan Down to the Mongol Invasion[48]
The Empire of the Steppes[49]
Turkic Lineage[50]
|
1219, 1229, 1260, 1370, 1400, 1405
|
Table 3 The data sources of gridded allocation
|
Type of data
|
Data sources
|
|
Cultivatable land suitability dataset
|
Zhang??s study[51]
|
|
Cropland fraction data approximately 2000 C.E.
|
Zhang??s study[52]
|
|
Bare land, water bodies, artificial surfaces
|
http://globallandcover.com/home.html?type=data
|
(1) Cropland area in 1928 A.D.
The five Central
Asian countries had data on both cropland area and sown area in the various
statistical yearbooks of the USSR before 1954 A.D., whereas in 1928 A.D., only
data on sown area were available. In terms of the history of agricultural
development in the five Central Asian countries[42?C45], the pattern
of cropland cover in the four Central Asian countries except Kazakhstan has not
changed much in the 20th century. Therefore, the average of the ratio of
cropland area to sown area in 1954-2000 A.D.
can be used instead of the ratio of cropland area to sown area in 1928 A.D. in
these four countries. Equation 1 shows the process of calculating the cropland
area in 1928 A.D. for these four countries using Uzbekistan as an example.
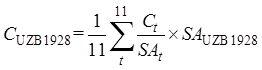 (1)
(1)
where CUZB1928 refers to the cropland area in
Uzbekistan in 1928 A.D.; CUZBt refers to the cropland area in Uzbekistan under
time section t from 1954 A.D. to 2000
A.D., and there are 11 time sections of cropland from 1954 A.D. to 2000 A.D. in
this study; SAUZBt
refers to the sown area in Uzbekistan under time section t from 1954 A.D. to 2000 A.D.; and SAUZB1928 refers to the sown area in Uzbekistan
in 1928 A.D.
Kazakhstan
experienced rapid large-scale agricultural reclamation in the 20th century that
was extensive and deep, and the ratio of cropland area to sown area in 1928
A.D. cannot be replaced by the average of the ratio of cultivated area to sown
area for the period from 1954 AD to 2000 A.D., as in the other four countries.
Therefore, the cropland area in Kazakhstan in 1928 A.D. was reconstructed
according to historical sources[53], which stated that ??after the
October Revolution, cropland in Kazakhstan increased by an average of 154,000
hectares (converted into 1540 km2) per year??.
 (2)
(2)
where CKAZ1928 refers to the cropland area in
Kazakhstan in 1928 A.D. and CKAZ1954 refers to the cropland area in
Kazakhstan in 1954 A.D.
(2) Cropland area
in 1850 A.D.
The agricultural
history of Kazakhstan began with the large-scale agricultural migration from
Tsarist Russia to Kazakhstan in the second half of the 19th century[44]
at the point when Russian migration policy towards Central Asia shifted from a
military based policy to a predominantly agricultural one around the 1860s[45],
which showed a spatial progression from north to south.
Before 1850 A.D.,
agriculture in Kazakhstan was mainly located in the Syr Darya basin in southern
Kazakhstan and near the Zhetysu region in southeastern Kazakhstan. Nomadic
herders predominantly populated the steppes of northern Kazakhstan, with a
negligible cropland fraction, and from 1850 A.D. onwards, the steppes of
northern Kazakhstan experienced large-scale reclamation for cultivation. The
growth of cropland in southern Kazakhstan and the other four countries of
Central Asia during this period is difficult to estimate because of the
difficulty of obtaining population ratios in northern and southern Kazakhstan
from 1850 A.D. to 1928 A.D. and the increased uncertainty created by the
demographic changes brought about by mass migration and changes in population
density resulting from the shift of the nomadic population to the settled population.
However, the cropland fraction in southern Kazakhstan and the other four
countries of Central Asia, although increasing slightly in line with population
growth, is negligible compared to the unprecedentedly large increase in
northern Kazakhstan. Therefore, this study concluded that the increase in
cropland in the five Central Asian countries after 1850 A.D. occurred mainly in
northern Kazakhstan, with the southern part of the five Central Asian countries
reaching the maximum area that could be reached in 1850 A.D. in the context of
this study. This north?Csouth divide in Kazakhstan is derived from An Historical Atlas of Central Asia[54].
The total cropland area of the five Central Asian countries in 1850 A.D. was
calculated by Equation 3.
 (3)
(3)
where CCA1850 and
CCA1928 refer to the
total cropland area in the five Central Asian countries in 1850 A.D. and 1928
A.D., respectively, and CKN1928
is the cropland area of northern Kazakhstan in 1928 A.D.
(3) Cropland area
in 1750 A.D.
The rapid
development of irrigation programs in the five Central Asian countries occurred
after 1750 A.D.[40]. A large proportion of the nomadic population
was converted to a settled population and started to engage in farming[35],
which led to the rapid development of cropland area during this period. The
main idea for reconstructing cropland area in 1750 A.D. is shown by Equation 4.
 (4)
(4)
where CCA1750 refers to the total cropland
area of five Central Asian countries in 1750 A.D., PCA1850C
refers to the number of people engaged in farming in 1850 A.D., and PCA1750C refers to the number of people engaged in farming
in 1750 A.D.
The population engaged in farming in 1850 A.D. was made up
of two components: the population engaged in farming in 1750 A.D. increased by
the way of natural growth, and the number of people who
switched from pastoralism to farming between 1750 A.D. and 1850 A.D. We
consider the former rate of growth to be equal to the growth rate of the total
population of the region between 1750 A.D. and 1850
A.D. and the latter that the conversion occurred
mainly among the Uzbeks and Turkmens[35, 40]. PCA1750C
was calculated by Equation 5.
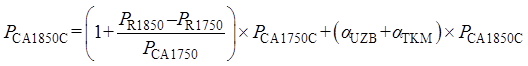 (5)
(5)
where PR1850
and PR1750 refer to the total population of the region in 1850
A.D. and 1750 A.D., respectively, and ??UZB and ??TKM refer to the number of Uzbeks and
Turkmens who have switched from pastoralism to farming, respectively, as a
percentage of the total population.
The total
population was derived from the Atlas
of World Population History[32]. The number of the farming
population was converted from the total population combined with the
descriptions in historical sources[34, 35, 55], and the discounted
proportion of the farming population in 1850 A.D. was 60%. The ??UZB and ??TKM are determined from the qualitative
descriptions in references[33, 35, 41-43, 55, 56], with ??UZB at 30% and ??TKM at 8.75%.
(4) Cropland area in 1000 A.D., 1200 A.D., and 1500 A.D.
The period of
rapid cropland development in Central Asia occurred mainly after 1750 A.D.,
before which the total amount of cropland area was small and the development
trend was not positive and tended to be stable[36?C41]. The cropland
area fluctuated only when subject to war or invasion[46?C49], and
such fluctuations are reflected in the reconstruction of cropland area in 1219-1260 A.D. and 1370-1405 A.D.
This study assumed that the per capita cropland area in the five Central Asian
countries during the period 1000-1500
A.D., except for fluctuating time periods, remained the same as in 1750 A.D.
and that the cropland area increased with population growth (Equation 6).
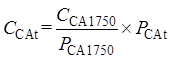 (6)
(6)
where CCAt
refers to the total cropland area in the five Central Asian countries under
time section t that was not affected
by external disturbances during the period 1000-1500 A.D. and PCAt refers to the total population
of the five Central Asian countries under time section t that is not affected by external
disturbances during the period 1000-1500 A.D.
(5) Cropland
area in 1219 A.D., 1229 A.D. and 1260 A.D.
In the year 1219
A.D., Genghis Khan led an invasion of Central Asia, and the arrival of nomads
resulted in a large amount of damage to the cropland in five Central Asian countries[36].
It was not until 1229 A.D. that agriculture began to recover when the cities
and cropland of the region were taken over by Yalavachi[39, 57], and
it recovered to its original level in 1260 A.D.[47]. Therefore, it
can be assumed that the year 1219 A.D. was the start of the disturbance and
1260 A.D. was the end of the disturbance, the cropland area in these two time
sections was unaffected by the disturbance, and the cropland area was
reconstructed in the same way as in Equation 6. The year 1229 A.D. can be considered
the period when the disturbance had its greatest impact and the cropland area
fell to its lowest value during the disturbance, which can be calculated by
Equation 7.
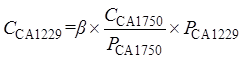 (7)
(7)
where CCA1229 refers to the total
cropland area in the five Central Asian countries in 1229 A.D. and ?? is the
percentage of conversion.
The Mongol invasion of Central Asia resulted in the mass murder of its
inhabitants. As there is a positive correlation between population and cropland
area, ?? can be determined by the
proportion of the population reduced in that period. According to the Empire of the Steppes, approximately
four-fifths of the population was killed, leaving the affairs of the surviving
one-fifth of the population to be managed by Darugachi[49].
Therefore, ?? is taken as 1/5.
(6) Cropland area
in 1370 A.D., 1400 A.D. and 1405 A.D.
In 1370 A.D.,
Timur began his wars of expansion, which had a large impact on agriculture in
five Central Asian countries, similar to the conquest of Genghis Khan. However,
after, and even during, the war of conquest in 1400 A.D., Timur had already
started to recover the economy. Until Timur??s death in 1405 A.D., prosperity
was restored in Central Asia[39]. Therefore, 1370 A.D. was the start
of the disturbance, and 1405 A.D. was the end of the disturbance. The cropland
area in these two time sections was unaffected by the disturbance, and the
cropland area was reconstructed in the same way as in Equation 6. The year 1400
A.D. can be considered the period when the disturbance had its greatest impact and
the cropland area fell to its lowest value during the disturbance, which can be
calculated by Equation 8.
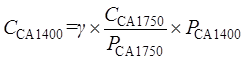 (8)
(8)
where CCA1400 refers to the total
cropland area in the five Central Asian countries in 1400 A.D. and ?? is the
percentage of conversion.
The Timurid
leaders continued the Mongol nomadism of Genghis Khan??s time and their
systematic means of destruction[49], with the intention of emulating
their ancestors. Therefore, this study concludes that the damage to the
cropland of five Central Asian countries during the Timurid period is
comparable to that of the Genghis Khan period, which means that ?? has the same value as ?? and is also taken as 1/5.
3.2 Methods for Allocating Historical
Cropland Area into Grid Cells
In
the gridded allocation of cropland area in the five Central Asian countries,
country-specific data are available for the cropland area in 1928 A.D. and 2000
A.D., so the ??study units?? used for the distribution of these two sections are
for each of the five Central Asian countries (which means there are five study
units). The total cropland area for the 1850 A.D. and earlier sections is only
available for the five Central Asian countries as a whole, so the ??study unit??
used for these sections is the five Central Asian countries as a whole (which
means there is only one study unit).
In this study, based on the gridded cultivatable land suitability
data calculated by Zhang et al.[51],
the gridded allocation of cropland was completed through the following steps.
(1) Creating 5¢´5¢ resolution grids covering five Central
Asian countries. The cropland fraction in 2000 A.D. calculated by Zhang et al.[52] was summed with
the fraction of ??Artificial Surface?? in the GlobeLand30 dataset in 2000 A.D. on
a 5¢´5¢ grid as the potential cropland fraction of the grids in 2000 A.D.
(Equation 9). The grids were ranked in order of potential cropland fraction
from higher to lower and then divided into 10 equal parts in the number of
grids covering the study units from higher to lower fraction.
 (9)
(9)
where
PotenFrac(i)2000 refers to the potential cropland fraction in the ith grid cell; CropFrac(i)2000 is the cropland fraction in the ith grid cell in 2000 A.D.;
and ArtfFrac(i)2000 is the
fraction of the artificial surface in the ith
grid cell.
(2) The area of a
grid with a resolution of 5¢´5¢ varies with latitude, so grids with
the same cropland fraction may actually have different cropland areas. To
eliminate the error introduced by this problem, the area of the grids in the
study units needed to be corrected by Equation 10.
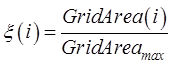 (10)
(10)
where
??(i) refers to the grid area correction
factor in the ith grid
cell; GridArea(i) refers to the grid
area in the ith grid cell;
and GridAreamax refers to
the largest grid area in the study unit to which the ith grid cell belongs.
(3) In this study,
the percentage of cultivable land for a 5¢´5¢ resolution grid cell was assumed to be
90%. Allocated the cropland area in the first decile grids according to
Equation 11 and set the percentage of cultivable land of the first decile grids
at 9%.
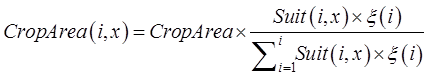 (11)
(11)
where CropArea(i,x) refers to the
cropland area that has been allocated in the ith grid cell in allocation unit x; CropArea is the total
area of cropland in the study unit; Suit(i,x)
refers to the gridded cultivatable land suitability data in the ith grid cell in allocation
unit x; and??(i) refers to the grid area correction factor in the ith grid cell.
(4) If at the end
of the allocation for the first decile girds there was still a surplus of
cropland area, the allocation for the second decile grids began in accordance
with Equation 11 with the percentage of cultivable land at 9%, and at the same
time the allocation for the first decile girds continued in accordance with
Equation 11 with the percentage of cultivable land at 18%. Following the above
rules, the cropland could be allocated to all deciles by iteration. If all the
cropland area of the study unit was allocated, the allocation stopped, and if
there was still a surplus of cropland area in the study unit at the end of the
allocation in the 10th decile girds, the remaining cropland area was allocated
throughout the study units in accordance with Equation 11.
(5) Cropland
fraction calculation (Equation 12).
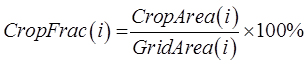 (12)
(12)
where
CropFrac(i) refers to the cropland fraction of the ith grid; CropArea(i) is the cropland area of the ith grid; and GridArea(i) is the area of the ith grid.
(6) Correction
of oversaturated grids.
1) This study considered water bodies and bare land
to be noncultivable land, whereas the extent of modern nascent water (mostly
reservoirs) could be regarded as historically cultivable land; therefore, the
arable land fraction in the grid could be calculated by Equation 13.
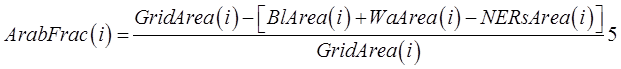 (13)
(13)
where
ArabFrac(i) refers to the arable
land fraction in the ith
grid; GridArea(i) refers to the area of the ith grid, BlArea(i) refers to the bare land area in the ith grid, WaArea(i) refers to the water body area in the ith grid and NERsArea(i) refers to the modern nascent water area in the ith grid obtained from
natural earth data.
2) Combining the
percentage of cultivable land for a 5¢´5¢ resolution grid cell (90% in this
study) and the arable land fraction in the grid (Equation 13), the maximum
cropland fraction in the grids could be calculated by Equation 14.
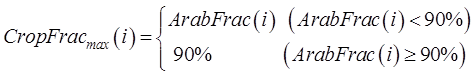 (14)
(14)
where
CropFracmax(i) refers
to the maximum cropland fraction in the ith
grid and ArabFrac(i) refers to the arable land fraction in the ith grid.
For the grids
where CropFrac(i) exceeded CropFracmax(i), CropFracmax(i) was directly assigned
as their CropFrac(i) and summed up all the excess grids??
cropland area and reallocated them to the grids that did not reach their CropFracmax(i) according to Equation 11. This step was
repeated several times until all grids?? CropFrac(i) values were lower than CropFracmax(i), and the correction ended.
4 Data Results and Validation
4.1 Data Composition
The
reconstruction dataset of cropland change in Five Central Asian countries over
the Last Millennium (1000-2000)
contains the total cropland area of five Central Asian countries during 1000-2000 A.D. and the 5¢´5¢ gridded cropland fraction of five Central
Asian countries during 1000-2000 A.D.
The cropland area for 25 time sections include 2 tables of the total cropland
area of five Central Asian countries during 1000-2000 and the cropland area of each of the five Central Asian
countries during 1928-2000,
which are archived in.xlsx data formats. The gridded cropland fraction with a
spatial resolution of 5¢´5¢ includes 8 time sections (1000 A.D.,
1200 A.D., 1400 A.D., 1500 A.D., 1750 A.D., 1850 A.D., 1928 A.D., 2000 A.D.),
which are archived in .img data formats.
4.2 Data Products
Changes
in total cropland area in five Central Asian countries during 1000-2000 A.D. are shown in Figure 1. The change in cropland area over
the last millennium in the five Central Asian countries can be divided into
three phases: a smooth phase with fluctuations from 1000 A.D. to 1750 A.D., a
rapid increase from 1750 A.D. to 1992 A.D., and a decline from 1992 A.D. to
2000 A.D.
The total
cropland area in the five Central Asian countries was 9,617.46 km2 in 1750 A.D., before which the total cropland area did not change much,
and the cropland area increased slowly with population growth. However, there
were fluctuations in cropland area caused by warfare in the early 13th and late
14th centuries, causing the cropland area to fall to 1,229.57 km2 in
1400 A.D. and to 1,137.98 km2 in 1229 A.D.
Cropland in
Central Asia grew rapidly between 1750 A.D. and 1992 A.D. In particular, the
cropland area increased from 41,329.87 km2 to 439,780 km2 between 1850 A.D. and
1992 A.D., which represented a nearly tenfold increase
over more than 100 years. This was the result of Tsarist Russia??s large-scale
land reclamation in Central Asia, especially in Kazakhstan.
Between 1992
A.D. and 2000 A.D., the cropland area decreased significantly from 439,780 km2
in 1992 A.D. to 394,323 km2 in 2000 A.D. This is due to the
destruction of agriculture as a result of the change in policy regimes in five
Central Asian countries after the dissolution of the Soviet Union[58].
Particularly in Kazakhstan, the loss of a large number of farmers and capital
from the countryside has led to large-scale abandonment of cropland.
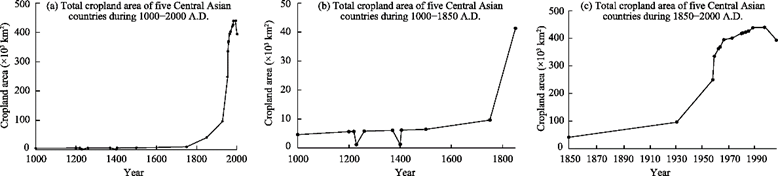
Figure
1 Total cropland
area of five Central Asian countries during 1000-2000 A.D.
The 5¢´5¢ gridded cropland fraction in Central
Asia during 1000-2000 A.D. is shown in Figure 2. The
cropland was mainly distributed in oases around the Amu Darya and Syr Darya in
southern Central Asia, such as the Khorezm Oasis, Fergana basin in Transoxiana,
Zeravshan River valley oases, which nourish Samarkand and Bukhara, and Merv
Oasis and Akhal Oasis in Turkmenistan. Cropland was also distributed in the Talas
River basin, the Chu River basin, and the Zhetysu region. One of the
distinctive features of the distribution of cropland in Central Asia was the
distribution along rivers. This is due to the aridity and lack of rainfall in
Central Asia, where rivers are an important source of irrigation water. In Central
Asia, agriculture can be developed only when water sources and irrigation
systems are available.
Over time, there
has been a tendency for cropland to expand outwards from the oasis. Especially
since 1750 A.D., there has been a rapid increase in cropland area and a marked
increase in the extent of expansion. Selecting 1850 A.D. as a turning point,
the distribution of cropland in Kazakhstan changed significantly. With the
invasion of Tsarist Russia, large-scale migration and reclamation activities in
northern Kazakhstan led to a rapid expansion of the cropland from north to
south. Kazakhstan was transformed from a pastoralist country to an agricultural
power in just 100 years, and it finally became the breadbasket of the Soviet
Union.
5 Discussion and Conclusion
This study reconstructed the total
cropland area and 5¢´5¢ gridded cropland fraction in five
Central Asian countries during 1000-2000 A.D.
The main conclusions are as follows: (1) The change in cropland area in five
Central Asian countries between 1000 A.D. and 2000 A.D. had three phases of
??steady with fluctuations-growth-decline??. (2) Cropland was
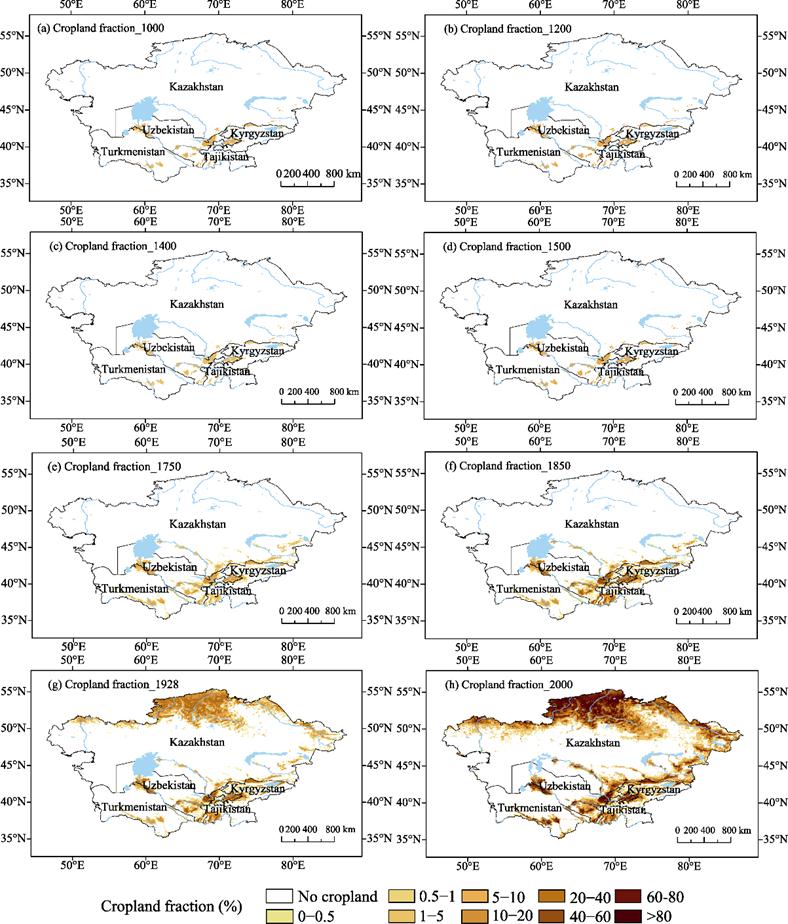
Figure
2 The 5¢´5¢
gridded cropland fraction in Central Asia during 1000-2000 A.D.
mainly
located in oases along the rivers and tends to expand outwards over time. After
1850 A.D., the increase in cropland area occurred mainly in the northern part
of Kazakhstan. The reconstruction of cropland cover change in five Central
Asian countries in the last millennium can provide ideas for the reconstruction
in nonmajor farming regions where data sources are less available and help to
compare the spatial and temporal characteristics of cropland development in
major farming regions and the region else.
Author Contributions
Ye, Y. and Fang, X. Q.
designed the algorithms of the dataset. Jiang C. contributed to the processing
and analysis of the cropland area. Zhang C. P. designed the gridded allocation
algorithm. Zhang C. P. and Zhang, D. Y. provided guidance and advice on the gridded
allocation algorithm. Jiang C. wrote the data paper.
Conflicts of Interest
The
authors declare no conflicts of interest.
References
[1]
Ruddiman, W. The anthropogenic
greenhouse era began thousands of years ago [J]. Climatic Change, 2003, 61(3): 261‒293.
[2]
Pielke, R., Pitman, A., Niyogi,
D., et al. Land use/land cover
changes and climate: modeling analysis and observational evidence [J]. WIREs Climate Change, 2011, 2(6):
828‒850.
[3]
Zhang, X., Wang, W., Fang, X., et al. Agriculture development-induced
surface albedo changes and climatic implications across northeastern China [J].
Chinese Geographical Science, 2012,
22(3): 264‒277.
[4]
Crossman, N., Bryan, B., de
Groot, R., et al. Land science
contributions to ecosystem services [J]. Current
Opinion in Environmental Sustainability, 2013, 5(5): 509‒514.
[5]
Gaillard, M., Morrison, K.,
Madella, M., et al. Past land-use and
land-cover change: the challenge of quantification at the subcontinental to
global scales [J]. Past Global Change
Magazine, 2018, 26(1): 3.
[6]
Houghton, R., Hobbie, J.,
Metillo, J. Changes in the carbon content of terrestrial biota and soils
between 1860 and 1980: a net release of CO2 to the atmosphere [J]. Ecological Monographs, 1983, 53(3):
235‒262.
[7]
Ramankutty, N., Foley, J.
Estimated historical changes in global land cover: croplands from 1700 to 1992
[J]. Global Biogeochemical Cycles,
1999, 13(4): 997‒1027.
[8]
Klein Goldewijk, K., Beusen,
A., Doelman, J., et al. Anthropogenic
land use estimates for the Holocene??HYDE 3.2 [J]. Earth System Science Data, 2017, 9(2): 927‒953.
[9]
Pongratz, J., Reick, C.,
Raddatz, T., et al. A reconstruction
of global agricultural areas and land cover for the last millennium [J]. Global biogeochemical cycles, 2008,
22(3): GB3018.
[10]
Hurtt, G., Chini, L., Frolking,
S., et al. Harmonization of land-use
scenarios for the period 1500?C2100: 600 years of global gridded annual
land-use transitions, wood harvest, and resulting secondary lands [J]. Climatic Change, 2011, 109(1): 117‒161.
[11]
Kaplan, J., Krumhardt, K.,
Ellis, E., et al. Holocene carbon
emissions as a result of anthropogenic land cover change [J]. Holocene, 2011, 21(5): 775‒791.
[12]
Fang, X., Ye, Y., Zhang, C., et al. Cropland cover change and its
environmental impacts in the history of China[J]. Journal of Palaeogeography, 2019, 21(1): 160‒173.
[13]
Ge, Q., Dai, J., He, F., et al. Change of the amount of cropland
resource and analysis of driving forces in partial provinces in China during
the past 300 years [J]. Progress in
Natural Science, 2003, 13(8): 825‒832.
[14]
Lin, S., Zheng, J., He, F. The
approach for gridding data derived from historical cropland records of the
traditional cultivated region in China [J]. Acta
Geographica Sinica, 2008, 63(1): 83‒92.
[15]
Ye, Y., Fang, X., Ren, Y., et al. Cropland cover change in
Northeast China during the past 300 years [J]. Scientia Sinica Terrae, 2009, 39(3): 340‒350.
[16]
Wei, X., Ye, Y., Zhang, Q., et al. Reconstruction of cropland change
over the past 300 years in the Jing-Jin-Ji area, China [J]. Regional Environmental Change, 2016,
176(8): 1‒13.
[17]
Bork, H., Bork, H., Dalchow,
C., et al. Landschaftsentwicklung in
Mitteleuropa [M]. Wirkungen des Menschen auf Landschaften. Gotham: Klett, 1998.
[18]
Haase, D., Walz, U., Neubert,
M., et al. Changes to Central
European landscapes??analysing historical maps to approach current environmental
issues, examples from Saxony, Central Germany [J]. Land Use Policy, 2007, 24(1): 248‒263.
[19]
Jansen, F., Zerbe, S., Succow,
M. Changes in landscape naturalness derived from a historical land register??a
case study from NE Germany [J]. Landscape
Ecology, 2008, 24(2): 185‒198.
[20]
Girel, J., Vautier, F., Peiry,
J. Biodiversity and Land Use History of the Alpine Riparian Landscapes (The
Example of the Isere River Valley, France) [M]//Multifunctional Landscapes, Vol.
III: Continuity and Change. Southampton (eds. Mander, Ü., Antrop, M.). Wit Press,
2003: 167?C200.
[21]
Delile, H., Schmitt, L.,
Jacob-Rousseau, N., et al. Headwater
valley response to climate and land use changes during the Little Ice Age in
the Massif Central (Yzeron basin, France) [J]. Geomorphology, 2016, 257: 179‒197.
[22]
Etter, A., McAlpine, C.,
Possingham, H. Historical patterns and drivers of landscape change in Colombia
since 1500: a regionalized spatial approach [J]. Annals of the Association of American Geographers, 2008, 98(1):
2‒23.
[23]
Stroyev, ??. ??. Physical
Geography of the USSR [M]. Beijing: The Commercial Press, 1960.
[24]
Qu, C., Zhang, Z. Overview of
agricultural development in Kazakhstan [J]. World
Agriculture, 2014(2): 145‒148.
[25]
Jiang,
C., Ye, Y., Fang, X., et al.
Reconstruction dataset of cropland change in five Central Asian countries over
the last millennium (1000-2000) [J/DB/OL]. Digital Journal of Global Change Data Repository, 2022. https://doi.org/10.3974/geodb.2022.04.10.V1. https://cstr.escience.org.cn/CSTR:20146.11.2022.04.10.V1.
[26]
GCdataPR Editorial Office.
GCdataPR data sharing policy [OL]. https://doi.org/10.3974/dp.policy. 2014.05
(Updated 2017).
[27]
FAO. FAOSTAT [EB/OL].
2001[2020-11-17]. http://www.fao.org/faostat/en/.
[28]
Institute
of Central Asian Studies of Xinjiang Academy of Social Sciences. Compilation of
Economic Statistics of the Five Soviet Central Asian Republics [M]. Urumqi:
Xinjiang Academy of Social Sciences, 1983.
[29]
Editorial Department of
Statistics Press. Statistical Yearbook of the National Economy of the USSR 1956
[M]. Beijing: Statistics Press, 1957.
[30]
Li, R. Compilation of Soviet
Agricultural Statistics [M]. Beijing: Agriculture Press, 1981.
[31]
Central Bureau of Statistics of
the Council of Ministers of the Soviet Union. Sixty Years of Soviet National
Economy [M]. Beijing: SDX Joint Publishing Company, 1979.
[32]
McEvedy, C., Jones, R. Atlas of
World Population History [M]. Beijing: The Eastern Publishing, 1992.
[33]
Wu, H. Study of Population
Issues in Central Asia [M]. Beijing: Minzu University of China Press, 2004.
[34]
Ivanov, P. Outline of central
Asia history [J]. Central Asia Series,
1983, 1:15‒124.
[35]
Ma, D., Feng, X. Outline
History of Five Central Asian Countries [M]. Urumqi: Xinjiang Peoples??s Rublishing
House, 2005.
[36]
Wang, Z. General History of
Central Asia (Volume of Ancient ??) [M]. Beijing: Peoples??s Rublishing House, 2010.
[37]
Wang, Z. General History of
Central Asia (Volume of Modern Times) [M]. Beijing: Peoples??s Rublishing House,
2010.
[38]
Lan, Q., Liu, R. History of
Central Asia (Volume 3) [M]. Beijing: The Commercial Press, 2018.
[39]
Lan, Q., Liu, G. History of
Central Asia (Volume 4) [M]. Beijing: The Commercial Press, 2018.
[40]
Lan, Q. History of Central Asia
(Volume 5) [M]. Beijing: The Commercial Press, 2018.
[41]
Adle, C., Habib, I. History of
Civilizations of Central Asia (Volume 5: Development in Contrast, from the
Sixteenth to the Mid-nineteenth Century) [M]. Beijing: China Translation &
Publishing Corporation, 2006.
[42] Terentyev, M. History of the Conquest
of Central Asia (Volume 3) [M]. Beijing: The Commercial Press, 1986.
[43]
Wu, Z. A History of the Tsarist
Russia Conquest of Central Asia [M]. Guiyang: Guizhou Educational Publishing
House, 1996.
[44]
Zhang, B. Soviet Exploitation
of Central Asia and Kazakhstan [M]. Urumqi: Xinjiang Peoples??s Rublishing
House, 1989.
[45] Meng, N. Study of the Policy of Russian
Rule in Central Asia [M]. Urumqi: Xinjiang University Press, 2000.
[46]
Barthold, V. Brief History of
Central Asia [M]. Beijing: Zhonghua Book Company, 2005.
[47]
Juvaini. History of the World
Conquer [M]. Hohhot: Inner Mongolia Peoples??s Rublishing House, 1980.
[48] Barthold, V. Turkestan Down to the
Mongol Invasion [M]. Shanghai: Shanghai Classics Publishing House, 2011.
[49]
Grousset, R. The Empire of the
Steppes [M]. Beijing: The Commercial Press, 1999.
[50]
Abul-Ghazi, B. Turkic Lineage
[M]. Beijing: Zhonghua Book Company, 2005.
[51]
Zhang, C. P., Ye, Y., Fang, X.
Q. Global cultivatable land suitability dataset based on physical-geographic factors
[J/DB/OL]. Digital Journal of Global
Change Data Repository, 2022. https://doi.org/10.3974/geodb. 2022.04.01.V1.
https://cstr.escience.org.cn/CSTR:20146.11.2022.04.01.V1.
[52]
Zhang, C. P., Ye, Y., Fang, X.
Q., et al. Synergistic modern global
1 km cropland dataset derived from multi-sets of land cover products [J]. Remote Sensing, 2019, 11(19): 2250‒2268.
[53]
Zhang, B. How Kazakhstan was
turned into a Soviet breadbasket [J]. World
Agriculture, 1983(3): 53‒55.
[54]
Bregel, Y. An Historical Atlas
of Central Asia [M]. Boston: Brill, 2003.
[55]
Wang, Z. Modern History of
Central Asia: 16-19 Century [M]. Lanzhou: Lanzhou
University Press, 1989.
[56]
Hu, Y. A preliminary study of
the relations between the Khohan Khanate and the Kyrgyz in the eighteenth and
nineteenth centuries [J]. Journal of
Lanzhou University, 1991(2): 54‒61.
[57]
Chen, G. On the two Muslim
statesmen of the West during the Mongol rule: Yalavachi and Maskhut [J]. North West Ethno-national Studies, 1995,
(1): 137‒145.
[58] Li, Z. Agriculture in Central Asia:
reality and future [J]. Former Soviet
Union and Eastern Europe Today, 1993, (3): 34‒36.