Scattered Dataset of Global Ocean Temperature and Salinity
Profiles from the International Argo Program
Liu,
Z. H.1,2* Li, Z. Q.1,2 Lu, S. L.1,2 Wu, X. F.1,2 Sun, C. H.1,2 Xu, J. P.1,2
1. State Key
Laboratory of Satellite Ocean Environment Dynamics, Second Institute of
Oceanography, Ministry of Natural Resources of P. R. China, Hangzhou 310012,
China;
2. Observation and Research Station of Global Ocean Argo
System (Hangzhou), Ministry of Natural Resources, Hangzhou 310012, China
Abstract: By the end of 2020, the
International Argo Program had collected more than 2.3 million temperature and
salinity (TS) profiles throughout the global ocean. Although the Argo Data
Assembly Centers (DACs) of various countries conduct quality controls on each
TS profile, the data quality that DACs submit is uneven because of differences
in decoding software, float technical faults and selected thresholds in the
quality control procedures. In addition, Argo datasets are becoming
increasingly complicated, which introduces difficulty when users read and make
use of them. To facilitate the usage of Argo datasets, the China Argo Real-Time
Data Center (CARDC) has started to reconstruct TS data through the use of
strict post-quality control measures. The dataset is archived in .dat format
and comprises 2,244,712 data files with a data size of 41.1 GB (compressed to
18 files of 7.56 GB).
Keywords: Argo; temperature; salinity; global ocean
DOI: https://doi.org/10.3974/geodp.2021.03.09
CSTR: https://cstr.escience.org.cn/CSTR:20146.14.2021.03.09
Dataset Availability Statement:
The
dataset supporting this paper was published and is accessible through the Digital Journal of
Global Change Data Repository at: https://doi.org/10.3974/geodb.2021.06.05.V1 or https://cstr.escience.org.cn/CSTR:20146.11.2021.06.05.V1.
1 Introduction
Ocean
and atmospheric scientists from the United States, Australia, France and Japan
formally proposed the ??Array for Real-time Geostrophic Oceanography (Argo)??, or
the International Argo Program[1?C3] in 1998, with the aim to build
an observation network comprising 3,000 autonomous profiling floats in the
ice-free regions of the world ocean within 5?C7 yrs. With this network,
temperature and salinity profiles in the global ocean (0 to 2,000 m water
depth) were collected with the intention to improve the accuracy of climate
forecasts and more effectively mitigate against hazards caused by global
climate change, such as hurricanes, tornadoes, floods and droughts. Many
coastal countries quickly responded to the program since its release. The
United States and Australia first deployed two batches of autonomous profiling
floats in 2000 in the Atlantic Ocean, southeastern Pacific Ocean and the
eastern Indian Ocean, marking the comprehensive initiation of the global Argo
network. As of November 2007, an observation network comprising 3,000 floats,
known as ??core Argo?? that records seawater temperature and
conductivity/salinity only had been officially established under the combined
efforts of nearly 30 countries. Furthermore, about 800?C1,000 floats were
planned for deployment every year to maintain the normal operation of the
observation network. As an important component of the Global Ocean Observing
System (GOOS), the Argo network is a revolution in oceanographic observations because
it is the most effective method for obtaining temperature and salinity profiles
in the middle and upper layers of the global ocean[4,5].
Autonomous profiling
floats were used as observation equipment in the global Argo network, termed
??Argo profiling floats??. In general, an Argo float can dive to 1,000 m by
changing its own buoyancy after being deployed by a ship or aircraft, and drift
freely with the ocean current at this depth for about 9 days. Then, the float
dives another 1,000 m. After reaching 2,000 m, the float ascends to the surface
at a speed of about 10 cm/s. During the ascent, temperature, conductivity
(automatically converted to salinity) and pressure (104 Pa is
roughly equal to 1 m in shallow water) are measured by a mounted conductivity?C temperature?Cdepth
(CTD) sensor. When the float reaches the sea surface, the top-mounted satellite
antenna obtains positioning information and then transmits the observation data
and float technical information. After all of the data are sent, the float dives
again to start the next mission cycle[2,3,6,7]. The International
Argo Program collected one million temperature and salinity profiles over the
global ocean in 14 yrs (1999 to 2013). As of September 2018, up to two million
temperatures and salinity profiles had been collected, which far exceeds the
volume of data obtained through ship-borne CTD, expendable
bathythermograph (XBT) and moored buoys. Currently, the International Argo
Program is expanding into the deep water, polar regions, marginal seas and
various biogeochemical variables with the goal of building a truly global,
full-depth and multi-disciplinary integrated ocean observation network
comprising 4,700 floats, including 2,500 core Argo floats, 1,200 deep Argo
floats and 1,000 biogeochemical Argo floats[8].
To ensure the quality
of Argo float observation data, the International Argo Program developed
real-time/delayed mode quality control methods and unified data storage
specifications and formats at the initial stage of implementation. Additionally,
it required the various Data Assembly Centers (DACs) from different countries
to conform to those methods. Moreover, the Argo Data Management Team (ADMT) was
also established to oversee any improvements in quality control methods and
revision criteria[9?C12]. Two Global Argo DACs (GDACs), located in
France and the United States, also conduct quality inspections on each
temperature and salinity profile to aggregate the Argo data submitted by
various countries. If problems are found, these GDACs send reminders to the
affiliated data centers and ask that the quality control operators re-test the
data. An individual Argo float is an expendable marine observation instrument
that operates continuously at sea for about 3?C5 yrs after deployment. They can
be affected by seawater corrosion, biological fouling and biocide leakage into
the conductivity cells, which may lead to sensor drift in the conductivity
sensor; once noted, this needs to be corrected to prevent systematic errors in
the conductivity/salinity observation profiles[13]. Therefore, ADMT
organized technicians to develop a delayed-mode quality control method for
float observation data. Specifically, float salinity is corrected with a
historical high-quality shipboard CTD dataset near the float as a reference[14].
In general, the first delayed-mode quality control is carried out within 6?C12
months after a float deployment. Nevertheless, conducting this on profiling
data from the global ocean is time-consuming and laborious and requires
judgments from skilled personnel. Further, the different human resources
invested by DACs lead to different progress in delayed-mode quality control.
Hence, quality problems can still be found in the global ocean Argo dataset,
and it is suggested that users conduct careful post-quality control for
ensuring high-quality data. The China Argo Real-Time Data Center (CARDC)
developed a set of Argo temperature and salinity post-quality control methods
in 2019 that are operated automatically. They can quickly detect data problems such
as sensor drift or offset, satisfying the needs of users in pursuit of
high-quality Argo data.
2 Metadata of the Dataset
The
metadata of the Scattered dataset of global ocean temperature and salinity
profiles from the International Argo Program is summarized in Table 1. It
includes the dataset full name, short name, authors, year of the dataset, data
format, data size, data files, data publisher, and data sharing policy, etc.[15].
3 Data Coverage and Composition
3.1 Spatio-temporal Data
Coverage
The
float observation profiles collected by the global ocean Argo temperature and
salinity profiling scattered dataset cover from July 1997 to December 2020. The
spatial range was 90??S?C90??N to 180??W?C180??E and incorporated the Pacific,
Indian, Atlantic and Arctic oceans and major marginal seas. Data coverage and
density are shown in Figure 1.
3.2 Data Composition
Each
Argo temperature?Csalinity profile was saved as a data file (.dat). The whole
dataset comprises 2,244,712 data files, and each set of data files comprises
header information and observational data. More precisely, the header
information includes the World Meteorological Organization (WMO) number of the
float, cycle number, affiliated project, principal investigator (PI), float
model, float serial number, communication system, positioning system, sampling
direction, data mode, observation time and satellite positioning information.
The observation data contains pressure (104 Pa), corrected pressure
(104 Pa), temperature (??C), corrected temperature (??C), salinity
(PSU), corrected salinity (PSU) and the quality control flags of three elements
(Table 2). The file is named XXXXXXX_NNN.dat. In this, XXXXXXX refers to the
WMO number (unique identification code) of the float, and NNN is the cycle
number of the float.
Table 1 Metadata summary of the Scattered dataset of global ocean
temperature and salinity profiles from the International Argo Program
|
Items
|
Descriptions
|
|
Dataset
name
|
Scattered
dataset of global ocean temperature and salinity profiles from the
International Argo Program
|
|
Dataset
Short name
|
GlobalOceanTemSalinityArgo
|
|
Authors
|
Liu,
Z. H. M-9975-2015, Second Institute of Oceanography, Ministry of Natural
Resources, liuzenghong@139.com
Li,
Z. Q. AAJ-4021-2021, Second Institute of Oceanography, Ministry of Natural
Resources, lizhaoqin@sio.org.cn
Lu,
S. L. AAJ-7419-2021, Second Institute of Oceanography, Ministry of Natural
Resources, lsl324004@163.com
Wu,
X. F. J-2546-2016, Second Institute of Oceanography, Ministry of Natural
Resources, wuxiaofen83@163.com
Sun,
C. H. AAK-6331-2021, Second Institute of Oceanography, Ministry of Natural
Resources, siosun@163.com
Xu,
J. P., Second Institute of Oceanography, Ministry of Natural Resources,
sioxjp@139.com
|
|
Geographic
area
|
Oceans
(including marginal seas such as the Gulf of Mexico, Japan Sea, Bering Sea,
Mediterranean Sea, South China Sea, Red Sea, and Black Sea, etc.) in the
globe
|
|
Year
|
1997?C2020
|
|
Data
format
|
.dat
|
|
Data
size
|
7.56
GB (compressed)
|
|
Dataset
files
|
Global
ocean Argo temperature and salinity profile data
|
|
Foundations
|
Ministry
of Science and Technology of P. R. China (2012FY112300); Scientific Research
Fund of the Second Institute of Oceanography, MNR (JG1709, JG1812); Zhejiang
Natural Science Foundation (LQY18D060001); National Natural Science
Foundation of China (U1811464)
|
|
Data Computing Environment
|
Linux
version 3.10.0-693.el7.x86_64, MATLAB R2018b 64bit
|
|
Data
publisher
|
Global Change Research Data Publishing &
Repository, http://www.geodoi.ac.cn
|
|
|
Address
|
No.
11A, Datun Road, Chaoyang District, Beijing 100101, China
|
|
|
Data
sharing policy
|
Data from
the Global Change Research Data Publishing & Repository includes metadata, datasets
(in the Digital Journal of Global Change Data Repository), and
publications (in the Journal of Global Change Data & Discovery). Data sharing policy
includes: (1) Data are openly available and can be free downloaded via the
Internet; (2) End users are encouraged to use Data subject to
citation; (3) Users, who are by definition also value-added service
providers, are welcome to redistribute Data subject to written permission
from the GCdataPR Editorial Office and the issuance of a Data redistribution
license; and (4) If Data are used to compile new
datasets, the ??ten per cent principal?? should be followed such that Data
records utilized should not surpass 10% of the new dataset contents, while
sources should be clearly noted in suitable places in the new dataset[16]
|
|
Communication and searchable system
|
DOI,
CSTR, Crossref, DCI, CSCD, CNKI, SciEngine, WDS/ISC, GEOSS
|
|
|
|
|
|
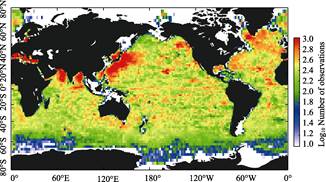
Figure
1 Profile
density distribution of global Argo temperature and salinity data from 1997 to
2020
4 Methods for Data Quality Control
|
Table 2 Description of quality control symbols
|
|
Quality control
flags
|
Description
|
|
0
|
Without quality control
|
|
1
|
Good data
|
|
2
|
Possibly good data
|
|
3
|
Bad data that are correctable
|
|
4
|
Bad data
|
|
8
|
Interpolated data
|
|
9
|
Missing data
|
Argo temperature and salinity profiles from various floats
over the global ocean were obtained from GDAC. Data might vary in quality for a
number of reasons, although real-time quality control has been performed on all
profiles according to the Argo real-time quality control manual with
delayed-mode quality control also conducted on some data[14]. To
improve the dataset quality, the post-quality control method established by
CARDC was adopted to perform rigorous screening and quality control over all
profile data. Moreover, temperature and salinity observation data of various
floats were mapped for manual review, thereby generating a set of high-quality
global ocean Argo temperature and salinity profile scatter datasets[15].
4.1 Post-quality Control
Methods
Specifically, the post-quality control technical scheme for
Argo temperature-salinity profile is composed of a real-time quality control
manual specified by ADMT, and a set of special tests developed by CARC, which
include steps such as observation time, positioning position, drift speed,
abnormal temperature and salinity, density inversion and pressure anomaly, as
well as the MEDD test developed by the Coriolis Data Center (France) and the
climatology test developed by CARDC. In total, this can include up to 15 test
steps:
(1)
observation time. Data files with a profile observation time prior to 1 January
1996 or later than the current date (i.e., date of data processing) were
deleted;
(2)
longitude and latitude. When the longitude and latitude of the profile were
outside of the ranges (−180, 180) and (−90, 90), respectively, the quality
control flag of the position was marked as ??4??;
(3)
satellite positioning: The bathymetry was calculated from the Earth topography
five minute grid1 based on the profile positioning information. If
the bathymetry was greater than 0, the quality control flag of the position was
marked as ??4??; if the position was obtained after linear interpolation of the
current profile, the position quality flag was marked as ??8??;
(4)
float drift speed. The float drift speed is calculated according to the
latitude, longitude and time of the current and previous profiles. If the speed
was greater than 2 m/s, it was judged as failing the test, marking the quality
control flag of the position as ??4??;
(5)
global range test of variables. When the pressure was less than −2.5??104
Pa, the temperature was outside of −2.5?C40.0 ??C or the salinity was
outside 2.00?C41.00 PSU, the quality control flags of pressure, temperature and
salinity were marked as ??4??. Thus, when problems arose in the pressure range,
the associated temperature and salinity were also marked;
(6)
specific area. When a profile originated in the Red or Mediterranean seas, the
temperature and salinity ranges were 4.0?C21.7 ??C and 10.0?C40.0 PSU (Red
Sea) and 2.00?C41.00 ??C and 2.00?C41.00 PSU (Mediterranean Sea). If the
temperature or salinity was out of this range, the quality control flag was
marked as ??4??;
1 etopo5.
http://iridl.ldeo.columbia.edu/SOURCES/.NOAA/.NGDC/.ETOPO5/ datasetdatafiles.html.
(7) increasing
pressure. If the observed pressure does not increase uniformly, the
corresponding pressure and its adjacent pressure were marked as ??4??, as were
the associated temperature and salinity;
(8) profile spike. The
test first detected whether a spike was present in the temperature and salinity
profile. If yes, the quality control flage was marked as ??4??;
(9) profile gradient.
Detection was performed according to the corresponding gradient thresholds of
temperature and salinity in different pressure ranges. If the calculated
gradient was greater than the corresponding threshold, the quality control flag
was marked as ??4??;
|
Table
3 Threshold
settings of the MEDD method
|
|
Pressure
(MPa)
|
Temperature
(??C ) threshold
|
Salinity
(PSU) threshold
|
|
<0.6
|
5.0
|
1.0
|
|
0.6?C1.5
|
3.5
|
1.0
|
|
1.5?C5
|
0.5
|
0.08
|
|
5?C10
|
0.15
|
0.02
|
|
10?C21
|
0.05
|
0.004
|
|
>21
|
0.004
|
0.000,2
|
(10) MEDD. This method
was proposed by Dr. D. Dobler (Coriolis Data Center) at the 20th
ADMT meeting (Villefranche-sur-Mer, France, 2019), and the relevant program
scripts were distributed to DACs for shared application. The MEDD method first
sets temperature and salinity change thresholds for different depths (see Table
3), obtains the vertical sliding median value and data boundary and finally
calculates the distance between the observation value and the median value of
the corresponding depth to detect a spike together with the density profile.
After testing, this method can effectively detect continuous and obvious spike
abnormalities (Figure 2);
|
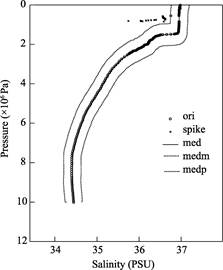
Figure 2 MEDD
test example using the 163th salinity profile from float 3901496
(Note: The open circles represent the original data, ??´?? indicates detected abnormal data, and the solid line is the
median value obtained from the MEDD method with dotted lines representing the
left and right boundaries.)
|
(11) digit rollover.
There is a problem caused by insufficient float data (or code) storage, which
leads to large data differences in adjacent levels. If the temperature
difference between two adjacent observation levels was greater than 10 ??C or
the salinity difference was greater than 5 PSU, its quality flag was marked as
??4??;
(12) frozen profile. If
all temperatures or salinities in the observation profile were equal to the
same value, its quality control flag was marked as ??4??;
(13) density inversion.
A universal seawater toolkit was used to calculate the water density from
shallow to deep. If the density of the current layer minus the density of the
next layer was greater than 0.03 kg/m3, both temperature and
salinity of the two layers were marked as ??4??. Conversely, from deep to
shallow, if the density of the current layer minus the density of the next
layer was less than −0.03 kg/m3, the temperature and salinity of
these two layers were also marked as ??4??;
(14) deepest pressure:
If the pressure was greater than 1.1 times the maximum pre-set observation
depth of the float, then the corresponding pressure, temperature and salinity
values were all marked as ??4??;
(15) climatology. The
test searches for nearby historical CTD data (or historical Argo data, Figure
3) provided by the Coriolis Data Center for Argo delayed-mode quality control
based on the position of each profile; they calculated the standard deviation
of temperature and salinity at different depths. When the temperature or
salinity value of the float was outside of the range of ??6.5 times the standard
deviation, its quality was marked as ??3?? (i.e., suspicious data). When a
profile had more than 33% of its data (temperature or salinity) marked as ??3??,
all of the data from the whole profile were marked as ??3??.
Figure 4 displays the
climatology test results of a salinity profile (No. 93) of a float (No.
2902581). The salinity below 463??104 Pa falls outside ??6.5 times the
historical CTD standard deviation, demonstrating that the salinity profile may
have drifted. In this case, delayed-mode quality control (salinity correction)
or additional input from personnel with professional knowledge would be
required.
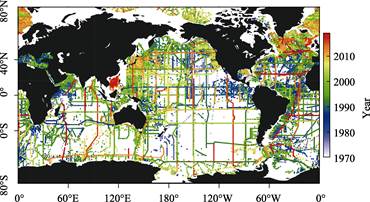
Figure 3 Geographical distribution of historical
CTD data for Argo delayed-mode quality control
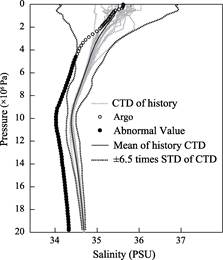
Figure
4 Example
of the climatology test (the 93th salinity profile from float
2902581)
(Note: The gray
dotted lines indicate historical CTD data, the black dotted lines represent ??6.5 times the standard
deviation calculated by historical CTD data and the solid black line is the
average calculated by historical CTD data. The open circles represent Argo
salinity data falling within ??6.5 times the standard deviation and the filled
circles represent Argo salinity data falling outside the range of ??6.5 times
the standard deviation.)
5 Data Results and Verification
5.1 Data Results
Overall,
2,373,923 temperature and salinity profile files were obtained from GDAC from
July 1997 to December 2020, and, of these, about 2,244,712 files were retained
after the post-quality control procedure[17], accounting for about 94.5%
of the total profiles (Figure 5). With the addition of new Argo floats and the
increase in float lifetimes, more than 100,000 temperature and salinity
profiling files have been received each year from the observation network since
2008. By the end of 2020, the global Argo network constituted about 4,000
active floats that can obtain at least 150,000 temperature and salinity profile
files annually. In other words, the current global Argo network can obtain one
million temperature and salinity profile files in less than 7 yrs.
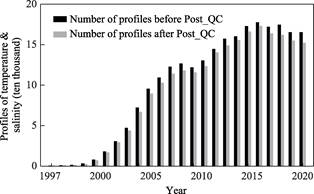
Figure
5 Statistics
of temperature and salinity profiles provided by the global Argo real-time
ocean observation network from 1997 to 2020
5.2 Evaluation of Data Accuracy
At
present, Argo floats are normally equipped with SBE41 or SBE41CP CTD sensors
(Sea Bird Inc.), with a laboratory calibration accuracy of pressure of ??2.0?? 104
Pa, temperature of ??0.002 ??C and conductivity of ??0.0003 S/m (equivalent to
salinity of ??0.0035 PSU). It should be noted that this level of accuracy cannot
be reached in actual observations. In particular, the Argo float is an
expendable instrument, which cannot re-calibrate the CTD sensor after recovery,
unlike shipboard CTD instruments or underwater gliders. Wong et al. (2020)[12] analyzed
the results of 10,048 floats and found that less than 10% required salinity
corrections through delayed-mode quality control after 2 yrs of deployment.
However, about 40% of floats required salinity correction after the float
observed 280 profiles. Undoubtedly, there have been batches of pressure and
conductivity sensor technology problems in the implementation of the
International Argo Program, leading to large errors in the data. Some of these
errors cannot be corrected via the delayed mode. In this case, the ADMT placed
these floats into a gray list and gave uniform quality control flags to the
observational elements where problems arose (see Table 2).
The International Argo
Program proposed an observation accuracy targeted at a pressure of ??2.4??104
Pa, temperature of ??0.005 ??C and salinity of ??0.01 PSU at the
initial implementation stage. In general, the temperature sensor is more stable
and accurate and could more easily meet the accuracy requirement, whereas
pressure and salinity had more difficulty in meeting the observation accuracy
requirements. To assess the observation accuracy of the global Argo dataset
over the past two decades, Wong et al.
(2020)[12] paired the global ocean transect data of GO-SHIP and
adjacent Argo salinity profiles and found that pressure and salinity values in
the global ocean Argo dataset reached the target observation accuracy of
pressure and salinity upon application of delayed-mode quality control
measures. Thus, Argo data of reliable quality are backed by the global ocean
Argo temperature and salinity profile scattered dataset made by CARDC using the
post-quality control method.
6 Discussion and Conclusion
The
International Argo Program has been deployed more than 16,000 Argo profiling
floats in the global ocean, it obtained at least 2.3 million temperature and
salinity data profiles. It is one of the most successful global ocean
observation systems. The data have been widely used in operational forecasting
for the ocean, atmosphere and climate. Although strict Argo data quality controls
are in place, various data quality problems have resulted from the profiling
floats themselves as well as their hosted CTD sensors, which can be affected by
sea surface oil pollution, biological fouling and electronic device aging,
limiting the promotion and application of Argo data in basic research.
In 2019, CARDC
developed and implemented a global Argo data fast access and post-quality
control system that used the quality controls of ADMT and combined them with
the practices and improved techniques and methods proposed by DACs and their
data quality control technicians. With this new system, global ocean Argo
temperature and salinity profiling scattered datasets at various time periods
can be regularly or irregularly reorganized and provided based on user needs
and made freely available through the network.
The global ocean Argo
temperature and salinity profile scattered dataset compiled from 1997 to 2020
were originally from GDAC, and processed by CARDC under strict post-quality
control operations. The post-quality control method is performed automatically
by a computer, and can quickly identify profiles that have drifted or are
offset in the conductivity sensor without delayed-mode quality control. It
appears that the dataset quality is superior to the Argo profile data that are
open and shared on the GDAC website, which aids user demands for high-quality
Argo data.
Author
Contributions
Liu,
Z. H. was responsible for developing the systems and algorithms; Xu, J. P. was
in charge of the post-quality control and manual review methods of the dataset;
Li, Z. Q. collected and reorganized the dataset as well as oversaw the manual
review; Wu, X. F. was responsible for conducting delayed-mode quality control
for all Argo float observation data in the Argo observation network in China;
Lu, S. L. verified the data; Sun, C. H. conducted the information statistics of
the dataset.
Acknowledgements
We thank Sev Kender, PhD, from Liwen Bianji (Edanz) (www.liwenbianji.cn/),
for editing the English text of a draft of this manuscript.
Conflicts
of Interest
The authors declare no
conflicts of interest.
References
[1]
Argo
Steering Team. On the design and Implementation of Argo??an initial plan for the
global array of profiling floats [R]. International CLIVAR Project Office
Report 21, GODAE Report 5, GODAE International Project Office, Melbourne,
Australia, 1998: 32.
[2]
Roemmich,
D. H., Davis, R. E., Riser, S. C., et al.
The Argo project: global ocean observations for understanding and prediction of
climate variability [J]. Oceanography,
2000, 13(2): 45‒50.
[3]
Xu, J. P.
Studies of Global Argo Ocean Observation [M]. Beijng: Ocean Press, 2002.
[4]
Riser, S.
C., Freeland, H. J., Roemmich, D., et al.
Fifteen years of ocean observations with the global Argo array [J]. Nature Climate Change, 2016, 6(2): 145‒153.
[5]
Liu, Z. H.,
Wu, X. F., Xu, J. P., et al. China
Argo project: progress in China Argo ocean observations and data applications [J].
Acta Oceanologica Sinica, 2017,
36(6): 1‒11.
[6]
Oka, E.,
Ando, K. Stability of temperature and conductivity sensors of Argo Profiling
Floats [J]. Journal of Oceanography,
2004, 60(2): 253‒258.
[7]
Liu, Z. H.,
Zhu, B. K., Guo, M., et al. The test
and deployment of Argo profiling float [J]. Ocean
Technology, 2002, 2: 13‒24.
[8]
Bushinsky,
S. M., Takeshita, Y., Williams, N. L. Observing changes in ocean carbonate
chemistry: our autonomous future [J]. Current
Climate Change Reports, 2019, 5: 207‒220.
[9]
Wong, A.,
Keeley, R., Carval, T., et al. Argo
quality control manual for CTD and trajectory data V3.3 [Z]. 2020. DOI: 10.13155/33951.
[10]
Kobayashi,
T., Minato, S. Importance of reference dataset improvements for Argo
delayed-mode quality control [J]. Journal
of Oceanography, 2005, 61(6): 995‒1009.
[11]
Lu, S. L., Liu, Z. H., Sun, C. H. Application of improved Argo salinity
delayed-mode quality control method [J].
Journal of PLA University of Science and Technology (Natural Science Edition), 2016, 17(2): 43‒52.
[12]
Wong, A.,
Wijffels, S. E., Riser, S. C., et al.
Argo data 1999?C2019: two million temperature-salinity profiles and subsurface
velocity observations from a global array of profiling floats [J]. Frontiers in Marine Science, 2020, 7:
700. DOI: 10.3389/fmars.2020.00700.
[13]
Owens, W.
B., Wong, A. P. S. An improved calibration method for the drift of the
conductivity sensor on autonomous CTD profiling floats by theta-S climatology
[J]. Deep Sea Research, 2009, 56(3): 450‒457.
[14]
Bohme, L.,
Send, U. Objective analyses of hydrographic data for referencing profiling
float salinities in highly variable environments [J]. Deep Sea Research, 2005, 52(3/4): 651‒664.
[15]
Liu, Z. H.,
Li, Z. Q., Lu, S. L., et al.
Scattered dataset of global ocean temperature and salinity profiles from the
International Argo Program [J/DB/OL]. Digital
Journal of Global Change Data
Repository, 2021. https://doi.org/10.3974/geodb.2021.06.05.V1. https://cstr.escience.org.cn/CSTR:20146.11.2021.06.05.V1.
[16]
GCdataPR
Editorial Office. GCdataPR data sharing policy [OL].
https://doi.org/10.3974/dp.policy.2014.05 (Updated 2017).
[17]
Li, Z. Q.,
Liu, Z. H., Lu, S. L. Global Argo data fast receiving and
post-quality-control-system [C]. IOP Conference Series: Earth and Environmental
Science, 2020, 502: 012012. DOI: 10.1088/1755‒1315/ 502/1/012012.