Dataset
Development on Vegetation Resilience of Urban Green Spaces in Shanghai
(2001?C2022)
Sun, D. Q.1 Sun, W. R.1 Cheng, X. Y.2 Wang, J.2* Cheng, F. Y.3
1. Industry Development and Planning Institute,
National Forestry and Grassland Administration, Beijing
100010, China;
2. Shanghai Gardening-Landscaping Construction Co.,
Ltd., Shanghai 200335, China;
3. National
Key Laboratory for Development and Utilization of Forest Food Resources,
College of Forestry and Biotechnology, Zhejiang A&F University, Hangzhou
311300, China
Abstract:
Vegetation resilience is a key factor in determining the ability of vegetation
to adapt to climate change. Although some studies have comprehensively assessed
global vegetation, research on the local scale remains limited. Furthermore,
the assessment results from different methods exhibit significant uncertainty.
In this study, we developed a vegetation resilience dataset for urban green
spaces in Shanghai based on the theory of critical slowing down. Using MODIS
NDVI data??with a 250-m resolution??from 2001 to 2022, we processed time series
data through seasonal and trend decomposition methods based on a locally
weighted regression, along with a moving average and harmonic analysis.
Vegetation resilience was assessed using variance or first-order autocorrelation
coefficients. The dataset included 3 resilience assessment outcomes, which
demonstrated a high level of consistency, indicating the dataset??s reliability
and stability. This dataset provides the spatial distribution of green spaces
in Shanghai and 3 distinct vegetation resilience assessment metrics spanning
the period from 2001 to 2022. The green space distribution and vegetation
resilience assessment data are archived in .tif format with a spatial
resolution of 250 m, while the study area boundary is provided as vector data
in .shp format. The dataset consists of 28 data files with data size of 812 KB
(Compressed into one file with 726 KB).
Keywords: resilience; critical slowing down theory; green space;
climate adaptability; vegetation resilience
DOI: https://doi.org/10.3974/geodp.2025.01.07
Dataset Availability Statement:
The dataset
supporting this paper was published and is accessible through the Digital Journal of Global Change Data
Repository at:
https://doi.org/10.3974/geodb.2024.12.04.V1.
1 Introduction
The
increase in extreme climate changes and anthropogenic disturbances have caused
global vegetation degradation and loss. Despite the enhancement and
implementation of numerous projects aimed at vegetation restoration and
rehabilitation, fundamentally reversing the ongoing trend of vegetation
degradation remains difficult[1]. This issue is especially prominent
in urban ecosystems, where landscape plants require significant manpower and
resources to maintain them. Disturbances, such as extreme climate events, have
already had a noticeable impact on green spaces in urban landscapes[2].
Vegetation resilience is a critical indicator that quantifies the capacity of
vegetation to recover to equilibrium states following disturbances. Assessing
the resilience of urban green spaces provides a fundamental basis for
understanding how these areas respond to external perturbations. In recent
years, the theory of critical slowing down has captured increasing attention
among assessors of vegetation resilience. This theory evaluates vegetation
resilience by examining fluctuations in functional indicators and the slowed
recovery rate following a disturbance[3]. Vegetation resilience
estimated using the critical slowing down theory is typically derived from a
long series of continuous spatial data. This approach is widely applicable. It
effectively addresses the cumulative effects of disturbances and provides quantitative
assessment results[4]. For example, methods based on this theory
often use the variance or first-order autocorrelation coefficient (Auto-Regressive
(model) of order 1, AR(1)) to measure system resilience[3].
However, vegetation resilience data derived from this theory are considerably
uncertain, primarily due to variations in the methods used to eliminate linear
and seasonal trends in time series data across different studies. Given that
both variance and AR(1) yield consistent results in resilience assessments
based on the theory of critical slowing down, the aim of this study was to
quantify the uncertainty in the assessment results by examining the deviation
between these two indicators[5]. In addition, due to the complexity
of detrending time series data, we selected a simplified detrending algorithm
with higher computational efficiency[6]. The reliability of this
algorithm was assessed by comparing its results with those obtained from
conventional algorithms. In summary, to comprehensively assess and compare the
performance of different methods, we estimated the vegetation resilience dataset
for urban green spaces in Shanghai using MODIS NDVI data at 250-m resolution
from 2001 to 2022, employing multiple methods based on the theory of critical
slowing down.
2 Metadata of the Dataset
The
metadata of the Vegetation resilience dataset for urban green spaces in
Shanghai (2001?C2022, V1.0)[7] is summarized in Table 1. It includes
the dataset full name, short name, authors, year of the dataset, spatial
resolution, data format, data size, data files, data publisher, and data
sharing policy, etc.
3 Methods
3.1 Data Sources
This study utilized the Normalized Difference Vegetation Index (NDVI)
data from 2001 to 2022 to assess vegetation resilience. The NDVI data were
obtained from the MOD13Q1 Version 6 product from
NASA??s Terra satellite, captured by the MODIS sensor. The dataset consists of
16-day composites with a spatial resolution of 250 m. Reliable data were
filtered through the ??pixel reliability??
and ??NDVI quality?? bands of the MOD13Q1 data product,
Table 1 Metadata summary of the Vegetation
resilience dataset for urban green spaces in Shanghai (2001?C2022, V1.0)
|
Items
|
Description
|
|
Dataset full name
|
Vegetation resilience dataset for urban
green spaces in Shanghai (2001?C2022, V1.0)
|
|
Dataset short name
|
SH_Green_Resilience_1.0
|
|
Authors
|
Sun, D. Q., National Forestry and Grassland
Administration, 15501298321@163.com
Sun, W. R., National Forestry and Grassland Administration,
15501023599@163.com
Cheng, X. Y., Shanghai Gardening-Landscaping Construction Co., Ltd.,
1160421734@qq.com
Wang, J., Shanghai Gardening-Landscaping Construction Co., Ltd.,
wjbear@126.com
Cheng, F. Y., Zhejiang A&F University, chengfangyan@zafu.edu.cn
|
|
Geographical region
|
Shanghai, China
|
|
Year
|
2001?C2022
|
|
Spatial resolution
|
250 m
|
|
Data format
|
.shp and.tif
|
|
|
|
Data size
|
726 KB (after compression)
|
|
|
|
Data files
|
Boundary of the study area; Spatial distribution of
green space coverage; Vegetation resilience based on STL_AR1, V2_AR1, V2_VAR
|
|
Foundations
|
Science and Technology Commission of Shanghai
Municipality (22dz1209403); Shanghai Construction Group Co., Ltd.
(24JCSF-24); Zhejiang A&F University (2024LFR069)
|
|
Data publisher
|
Global Change
Research Data Publishing & Repository, http://www.geodoi.ac.cn
|
|
Address
|
No. 11A, Datun Road, Chaoyang District,
Beijing 100101, China
|
|
Data sharing policy
|
(1) Data are openly available and
can be free downloaded via the Internet; (2) End users are encouraged to use Data
subject to citation; (3) Users, who are by definition also value-added
service providers, are welcome to redistribute Data subject to
written permission from the GCdataPR Editorial Office and the issuance of a Data
redistribution license; and (4) If Data are used to compile new
datasets, the ??ten percent principal?? should be followed such that Data
records utilized should not surpass 10% of the new dataset contents, while
sources should be clearly noted in suitable places in the new dataset[8]
|
|
Communication and
searchable system
|
DOI, CSTR, Crossref, DCI, CSCD,
CNKI, SciEngine, WDS, GEOSS, PubScholar, CKRSC
|
excluding areas with poor vegetation growth
conditions (i.e., regions with NDVI values consistently below 0.1). Land use
data were sourced from the Dynamic World global land environment dataset at a
10-m resolution. The study area encompasses Shanghai municipality, with
administrative boundaries derived from the 2024 national administrative
boundary map of China provided by Amap.
3.2 Algorithmic Principles
3.2.1 Extraction of Urban Green Spaces
To extract urban green spaces, a
reclassification analysis of the Dynamic World dataset was performed. First,
data from the past 10 years (2015?C2024) were filtered, and the most frequently
occurring land cover class for each image element was identified as its primary
land cover type. Next, land cover types dominated by green space were extracted
and included trees (label=1), shrub and scrub (label=5), and grass (label=2),
while all other land cover types were reclassified as ??other??. Finally, the map
of land cover types was reclassified to a resolution of 250 m.
3.2.2 Estimation of Vegetation Resilience
Three algorithms were employed to estimate
vegetation resilience, including two methods for calculating the AR(1) index
and one for calculating the VAR index. The first method utilized a simplified
STL (seasonal-trend decomposition using Loess) approach to process time series
data[6]. The detailed steps follow: (1) calculate the monthly mean
and multi-year monthly mean for the NDVI time series for each pixel; (2)
subtract the multi-year monthly mean from the monthly mean to remove the
seasonal trend; (3) perform a moving average on the seasonally detrended data
and subtract this moving average to remove the long-term trend; (4) compute the
AR(1) index using a sliding window (referred to as STL_AR1).
The second method combined the moving average and harmonic analysis to
process the NDVI time series[5]. (1) compute the mean NDVI using a
rolling window to capture the long-term trend; (2) subtract the rolling average
from the original NDVI data to obtain a detrended data series; (3) apply a
third-order harmonic analysis to the detrended data to model the seasonal
pattern; (4) subtract the fitted seasonal pattern from the detrended data to
obtain the residual series; (5) calculate AR(1) and variance (referred to as
V2_AR1 and V2_VAR) using a five-year sliding window (with a one-year step).
To ensure the reliability of the results, only data with a V2_AR1 to
V2_VAR ratio between 0.5 and 2.0 were selected[5]. The consistency
of trends between STL_AR1 and V2_AR1 was also assessed to validate the
reliability of the simplified resilience algorithm. Furthermore, since STL_AR1
employs an autoregressive model, negative values in this dataset represent
areas where this assessment method is unsuitable, and these negative-value
regions (accounting for 14% of the total statistical area) were excluded from
our analysis. The V2_AR1 data, which utilizes an autocorrelation approach,
indicates stronger ecosystem resilience when negative values are larger in
magnitude, reflecting faster recovery rates of vegetation to equilibrium
states. Similarly, the V2_VAR method based on variance analysis yields
comparable results to V2_AR1, with larger negative values signifying greater
vegetation resilience.
3.3 Technical Workflow
Based on the above methodology, NDVI data, land
use data, and administrative boundary data from the Amap were first collected
for preliminary data processing. Next, green space types from the land use data
were extracted, reclassified, and resampled to a resolution of 250 m. These
were combined with administrative boundary data to define the extent of green
spaces in Shanghai. Vegetation resilience was estimated using two methods: simplified
STL and a combination of the moving average and harmonic analysis, each
processing and analyzing NDVI time series data independently. Finally, the
results from the different methods were integrated and clipped to generate the
final vegetation resilience dataset for green spaces in Shanghai (Figure 1).
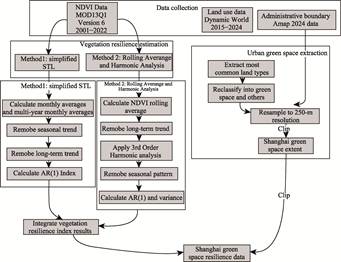
Figure 1 Flowchart
of the dataset processing
4 Data Results and
Validation
4.1 Dataset Composition
This dataset comprises 5 data layers: one
vector data layer delineating the study area boundary (.shp) and 4 raster data
layers with a spatial resolution of 250 m (GREEN_R, STL_AR1, V2_AR1, and
V2_VAR). The raster data layers are defined as follows: GREEN_R represents the
proportion of green space within each 250-m grid cell, derived from Dynamic
World data spanning 2015?C2024; STL_AR1 represents vegetation resilience data
quantified using the AR(1) index, derived from a simplified Seasonal and Trend
decomposition using Loess (STL) method; V2_AR1 represents vegetation resilience
data quantified using the AR(1) index, obtained through rolling average and
harmonic analysis processing; V2_VAR represents vegetation resilience data
quantified using the variance index, also obtained through rolling average and
harmonic analysis processing.
4.2 Data Results
Green spaces in Shanghai are mainly distributed
in the suburbs and peripheral areas, the proportion of green space in the city
center is relatively low. This distribution pattern reflects the typical green
space structure of a large city like Shanghai. The overall trends in vegetation
resilience, estimated using different methods, are consistent (Figures 2).
Spatially, green spaces in the suburbs and urban periphery generally show
higher vegetation resilience (e.g., such areas as the outskirts of Qingpu District
and Hengsha Island), while vegetation resilience in the city center is
relatively low. However, green spaces in coastal areas, such as Pudong New
Area, Jinshan District, and Fengxian District, also show relatively low
resilience, which may be linked to environmental stressors (e.g., strong winds
and salinity changes in coastal regions)[9]. The study results for
STL_AR1 were significantly higher than those for V2_AR1 and V2_VAR, possibly
because of the simplified algorithm used in STL_AR1 for data processing and
analysis, which could overlook minor differences in values across regions. In
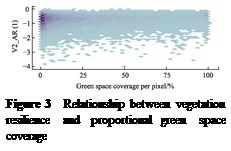
addition, no clear relationship was observed between the magnitude of
vegetation resilience per unit area and the proportion of green space (Figure 3),
with no discernible pattern in vegetation resilience distribution across
varying proportions of green space. Different vegetation types may have varying
levels of adaptability and recovery capacity, which could affect their overall
resilience performance[5].
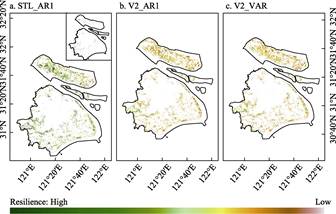
Figure 2 Vegetation resilience distribution maps
of Shanghai urban green space based on different methods
(Note: The black area in the inset of Figure 2a displays areas with
negative values, indicating regions where this modelling approach is not
applicable)
 4.3 Data Validation
The reliability of the
model results was evaluated by comparing vegetation resilience estimates
derived from different methods. Comparing the AR(1) index results calculated by
2 methods revealed that the overall estimates were consistent (Figure 4a). The
linear relationship between them (p<0.000,1)
was significant, though the correlation was weak (R2=0.09). This finding suggests that the simplified algorithm
(STL_AR1) can be a useful tool for assessing vegetation resilience, providing a
viable method for rapid evaluations. However, the simplification of time series
data processing in this method, while enhancing computational efficiency, may
lead to the oversight of subtle variations in the time series. As a result, its
outcomes could tend to be more concentrated and may not fully capture the
nuanced differences in vegetation resilience across different regions. In
contrast, more complex methods (e.g., V2_AR1) are capable of processing time
series data with greater precision, capturing more detailed changes, and
offering a more comprehensive and potentially more accurate assessment of
vegetation resilience. In addition, the results of the 2 resilience indices
(AR(1) and variance indices) estimated using the same moving average and
harmonic analysis were highly consistent (Figure 4b). Many sample points were
concentrated near the 1:1 reference baseline, indicating that this method is
stable and consistent.
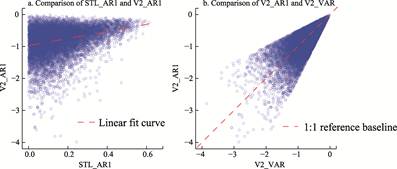
Figure 4 Uncertainty analysis of vegetation
resilience estimates based on different algorithms
5 Discussion and Conclusion
In
this study, we developed a vegetation resilience dataset for urban green spaces
in Shanghai using MODIS NDVI data from 2001 to 2022; the basis was the theory
of critical slowing down and the use of multiple methods. The assessment
results across various indicators in this dataset had a high degree of
consistency and aligned with theoretical expectations, demonstrating both
stability and reliability.
Throughout our
analysis, we identified 2 notable phenomena in specific regions: negative STL_AR1
coefficients and inconsistencies between AR(1) and variance trends. These
anomalies were predominantly observed in tropical rainforests and high-latitude
northern regions, potentially attributable to multiple factors. First, data
quality limitations, including remote sensing signal saturation, noise
interference, and resolution constraints, particularly in high-biomass areas
and regions with frequent cloud cover. Second, the inherent complexity of
ecosystems, characterized by non-linear dynamics or unstable system states.
Third, external anthropogenic disturbances and extreme climate events that
modify ecosystem responses. Additionally, the fundamental assumptions of AR(1)
models?? predicated on linear stationarity??may not hold in ecosystems undergoing
rapid transformation or ecological transition phases. These observations
further highlight the sensitivity of current methodologies to short time-series
data and spatial resolution limitations. Given that negative values lack clear
ecological interpretation, and inconsistent AR(1)-variance trends suggest
potentially unreliable estimates, we designated these regions as
model-inapplicable and excluded them from subsequent analyses. Future research
directions should focus on developing non-linear or non-stationary time-series
approaches better suited to complex ecological systems, while integrating
multi-source data to enhance assessment reliability.
Based on the
constructed dataset, we found that green spaces in Shanghai are primarily
located in the suburbs and peripheral areas, with lower proportion of green
space in the city center. This pattern reflects the typical spatial
distribution of green spaces in large cities. Suburban and peripheral green
spaces generally have high vegetation resilience, while the resilience of green
spaces in the city center and certain coastal areas is relatively low. No
significant correlation between the proportion of green space and resilience
was observed, indicating that vegetation resilience may be influenced more by
vegetation type and environmental conditions than simply the extent of
coverage. This study provides an important scientific basis for the management and
ecological planning of urban green spaces in Shanghai. It offers a new
perspective for the quantitative assessment of vegetation resilience in urban
green spaces, which is significant for enhancing the sustainability and climate
adaptability of urban ecosystems.
Author Contributions
Sun, D. Q. and Wang, J.
designed the overall development of the dataset. Sun, W. R. and Cheng, X. Y.
collected and processed the data. Sun, D. Q., Sun, W. R. and Cheng, F. Y.
designed the models and algorithms. Sun, D. Q. and Cheng, F. Y. validated the data.
All authors contributed to write the data paper.
Conflicts of Interest
The
authors declare no conflicts of interest.
References
[1]
Overpeck, J. T., Breshears, D.
D. The growing challenge of vegetation change [J]. Science, 2021, 372(6544): 786?C787.
[2]
Vieira, J., Matos, P., Mexia,
T., et al. Green spaces are not all
the same for the provision of air purification and climate regulation services:
the case of urban parks [J]. Environmental
Research, 2018, 160: 306?C313.
[3]
Dakos, V., van Nes, E. H.,
D??Odorico, P., et al. Robustness of
variance and autocorrelation as indicators of critical slowing down [J]. Ecology, 2012, 93(2): 264?C271.
[4]
Majumder, S., Tamma, K.,
Ramaswamy, S., et al. Inferring
critical thresholds of ecosystem transitions from spatial data [J]. Ecology, 2019, 100(7): e02722.
[5]
Smith, T., Boers, N.
Reliability of vegetation resilience estimates depends on biomass density [J]. Nature Ecology & Evolution, 2023, 7(11): 1799?C1808.
[6]
Lenton,
T. M., Buxton, J. E., Armstrong McKay, D. I., et al. A resilience sensing system for the biosphere [J]. Philosophical Transactions
of the Royal Society B: Biological Sciences, 2022, 377(1857): 20210383.
[7]
Sun,
D. Q., Sun, W. R., Cheng, X. Y., et al.
Vegetation resilience dataset for urban green spaces inShanghai
(2001?C2022, V1.0) [J/DB/OL]. Digital
Journal of Global Change Data Repository, 2024.
https://doi.org/10.3974/geodb.2024.12.04.V1.
[8]
GCdataPR Editorial Office.
GCdataPR data sharing policy [OL]. https://doi.org/10.3974/dp.policy.2014.05
(Updated 2017).
[9]
O??Leary,
J. K., Micheli, F., Airoldi, L., et al. The resilience of marine
ecosystems to climatic disturbances [J]. BioScience, 2017, 67(3): 208?C20.