Coastline Datasets Cover the
Guangdong-Hong Kong-Macao, Tokyo and San Francisco Bays
(1980–2020)
Su,
Q. X. Li, Z. Q. *
Department of Ocean Technology, School of
Electronic and Information Engineering, Guangdong Ocean
University, Zhanjiang 524088,
China
Abstract: The coastline
datasets of the Guangdong-Hong Kong-Macao, Tokyo, and San Francisco Bays were
developed using Landsat remote sensing images from 1980 to 2020, and
high-resolution Google Earth images. The coastlines were defined by the mean
high-water line, and were divided into two categories, natural and artificial,
and seven sub-categories. Furthermore, the intensity of coastline length
change, type structure change, and utilization index were calculated.
Subsequently, the total coastline lengths of the Guangdong-Hong Kong-Macao Bay
Area, Tokyo Bay, and San Francisco Bay in 2020 were 2,243.17, 580.68, and
689.11 km, respectively, while the average annual change intensities of the
coastline length from 1980 to 2020 were 0.22%, 0.37%, and 0.09%, respectively;
furthermore, the proportion of artificial coastlines in 2020 were 57.62%,
95.87%, and 55.36%, respectively, while the coastline utilization indexes were
55.20%, 83.22%, and 57.70%, respectively. The datasets included data of the
three Bay Areas for the following: (1) spatial distribution of coastlines and
their types (.shp, .kmz), (2) coastline type structure (.xlsx), (3) coastline
length change intensity (.xlsx), and (4) coastline utilization index
(.xlsx).The datasets were archived in the .shp, .kmz and .xlsx format, and
consisted of 192 data files with a size of 146 MB (compressed to 69 MB in three
data files).
Keywords: bay area;
coastline; intensity of coastline length change; coastline type; utilization
index
DOI: https://doi.org/10.3974/geodp.2021.02.06
CSTR: https://cstr.escience.org.cn/CSTR:20146.14.2021.02.06
Dataset Availability Statement:
The dataset
supporting this paper was published and is accessible through the Digital Journal of Global Change Data
Repository at: https://doi.org/10.3974/geodb.2021.04.07.V1
or https://cstr.escience.org.cn/CSTR:20146.11.2021.04.07.V1;
https://doi.org/10.3974/geodb.2021.04.08.V1
or https://cstr.escience.org.cn/CSTR:20146.11.2021.04.08.V1;
https://doi.org/10.3974/geodb.2021.04.09.V1
or https://cstr.escience.org.cn/CSTR:20146.11.2021.04.09.V1.
1 Introduction
Due
to global warming, the global mean sea level has been increasing continuously,
thereby posing serious challenges to the survival and development of human
civilization. Due to the high degree of economic and social development, the
Bay Area has gained tremendous significance on the international socio-economic
map. Its coastal zone represents the most active site, which witnesses intense
human activity, however, it is severely affected by sea level rise, thus,
indicating an evident impact of climate change and human activities on coastal
resources[1,2]. Therefore, extracting information on the spatial
distribution, change intensity, and utilization index of the Bay Area
coastlines on a large temporal scale can assist in assessing the climate change
impacts on the coastal zone, protecting and restoring regional coastlines, and
providing a database for effective management and planning of the coastal
environment.
This study aimed to
extract the location and length of coastlines of the Guangdong-Hong Kong-Macao,
Tokyo and San Francisco bays from Landsat remote sensing images and
high-resolution Google Earth images for seven periods (1980, 1990, 2000, 2005,
2010, 2015, and 2020). Furthermore, the spatiotemporal distributions of the
coastlines in the three Bay Areas were acquired after calculating the intensity
of coastline length change, coastline structure change, and utilization index.
2 Metadata
of the Dataset
The metadata for the three datasets, including Coastline
types and their spatiotemporal variations in Guangdong, Hong Kong and Macao Bay
Area (1979–2020)[3], Coastline types and their
spatiotemporal variations in Tokyo Bay (1980–2020)[4] and Coastline types
and their spatiotemporal variations in San Francisco Bay (1980–2020)[5]
is summarized in Table 1.
3 Methods
Coastlines have multiple definitions and its selection
significantly influences the research results.
This study used mean high tide line to define coastlines[7]. The
Landsat multi-spectral images (1980–2020) downloaded from the United
States Geological Survey (http://glovis. usgs.gov/) were used as data sources
(Table 2). Images with less than 5% cloud coverage, and an imaging time from
October to March were selected. Moreover, images with a high spatial resolution
from Google Earth were used to correct the extracted coastlines.
According
to the types of basic functional plans of the national coasts, i.e., natural
state of the coastlines and coastlines for man-made utilization, the coastlines
in the selected study areas were divided into two categories: natural
coastlines and artificial coastlines. Natural coastlines were divided into
bedrock, gravel, muddy, and biological coastlines, whereas artificial
coastlines were divided into farmland aquaculture, port wharf, and other
artificial coastlines. Furthermore, the outer edge of the surface by the sea is
usually selected as the coastline position[8–10].
Based on the analysis of
different reflective spectral characteristics of the ground objects near the
coastlines, modified normalized difference water index (MNDWI), threshold
Table 1 Metadata summary
of the Coastline datasets of the Guangdong-Hong Kong-Macao, Tokyo and San
Francisco Bays (1980–2020)
|
Items
|
Description
|
|
Dataset full name/short name
|
Coastline
types and their spatiotemporal variations in Guangdong, Hong Kong and Macao
Bay Area (1979–2020)
/GHM_Coastline_1979-2020
Coastline
types and their spatiotemporal variations in Tokyo Bay (1980–2020) /TK_Coastline_1980-2020
Coastline
types and their spatiotemporal variations in San Francisco Bay (1980–2020) /SF_Coastline_1980-2020
|
|
Authors
|
Su,
Q. X. AAD-2930-2021, Department of Ocean Technology, School of Electronic and
Information Engineering, Guangdong Ocean University, qianxinsu77@163.com
Li,
Z. Q. 0000-0001-9139-9579, Department of Ocean Technology, School of
Electronic and Information Engineering, Guangdong Ocean University,
qiangzl1974@163.com
|
|
Geographical
region
|
Guangdong-Hong
Kong-Macao Bay Area, Tokyo Bay Area, and San Francisco Bay Area
|
|
Year
|
1980,
1990, 2000, 2005, 2010, 2015, and 2020
|
|
Temporal
resolution
|
Five
and ten years
|
Spatial
resolution
|
10 m
|
|
|
Data
format
|
.xlsx,
.shp, .kmz
|
Data
size
|
69 MB
|
|
Data
files
|
The
dataset comprises the spatial distribution of coastlines in the three Bay
Areas as follows: coastline type structure, intensity of coastline length
change, and coastline utilization index
|
|
Foundations
|
National
Natural Science Foundation of China (41676079) and Innovation Fund of
Guangdong Ocean University (Q18307)
|
|
Data
publisher
|
Global Change Research Data Publishing &
Repository, http://www.geodoi.ac.cn
|
|
Address
|
No.
11A, Datun Road, Chaoyang District, Beijing 100101, China
|
|
Data
sharing policy
|
Data from
the Global Change Research Data Publishing & Repository includes metadata, datasets
(in the Digital Journal of Global Change Data Repository), and
publications (in the Journal of Global Change Data & Discovery). Data sharing policy
includes: (1) Data are openly available and can be free downloaded via the
Internet; (2) End users are encouraged to use Data subject to
citation; (3) Users, who are by definition also value-added service
providers, are welcome to redistribute Data subject to written permission
from the GCdataPR Editorial Office and the issuance of a Data redistribution
license; and (4) If Data are used to compile new
datasets, the ??ten per cent principal?? should be followed such that Data
records utilized should not surpass 10% of the new dataset contents, while
sources should be clearly noted in suitable places in the new dataset[6]
|
|
Communication and searchable system
|
DOI,
CSTR, Crossref, DCI, CSCD, CNKI, SciEngine, WDS/ISC, GEOSS
|
|
|
|
|
|
|
|
Table 2 List of Landsat
series remote sensing image data used for data R&D
|
Location
|
Time (yyyy–mm–dd)
|
Location
|
Time (yyyy–mm–dd)
|
Location
|
Time (yyyy–mm–dd)
|
Sensor
|
|
Guangdong-Hong Kong-Macao Bay Area
|
1979–10–01
|
Tokyo Bay
|
1980–11–11
|
San Francisco Bay
|
1980–11–14
|
MSS (80 m)
|
|
1990–10–13
|
1990–12–07
|
1990–10–10
|
TM (30 m)
|
|
2000–01–27
|
2000–11–24
|
2000–12–16
|
|
2005–11–23
|
2005–03–19
|
2005–11–20
|
ETM (30 m)
|
|
2010–10–28
|
2010–01–20
|
2010–10–25
|
|
2015–10–18
|
2015–10–25
|
2015–12–26
|
|
2020–02–18
|
2020–02–09
|
2020–10–12
|
OLI (30 m)
|
segmentation
method, mathematical morphological method, and Sobel operator method were
comprehensively adopted to extract the coastline data for each period;
additionally, the position and type of the required coastlines were modified
based on visual interpretation[11].
3.1 Algorithm
Principle
Coastline
length change intensity is a measure of the difference in the coastline length
over time, and is calculated as follows[12].
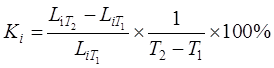 (1)
(1)
where,  is the length change intensity of a particular
coastline type from periods
is the length change intensity of a particular
coastline type from periods  to
to  , and
, and  and
and  indicate the lengths of the coastline during and .
The
changes in the coastline type structure indicate a proportional relationship of
various coastlines over a period of time, and is calculated as[12].
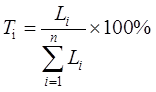 (2)
(2)
where,
 indicates the
proportion of the length of a particular coastline type to the total coastline
length,
indicates the
proportion of the length of a particular coastline type to the total coastline
length,  is the length of
the coastline type, and n is the
total number of coastline types. The evaluation method using the principal
degree of coastline development and utilization of China as proposed by Xiao[13]
was used to quantify the coastline structures in the study area. Subsequently,
the coastlines of most areas were in the form of a single main body, or a
binary or ternary structure. When the proportion of a particular coastline was
more than 45%, it represented a single main structure. Furthermore, if the
proportion of all the coastlines was less than 45%, and two or more coastlines
exhibited a proportion of more than 20%, they represented a binary or ternary
structure.
is the length of
the coastline type, and n is the
total number of coastline types. The evaluation method using the principal
degree of coastline development and utilization of China as proposed by Xiao[13]
was used to quantify the coastline structures in the study area. Subsequently,
the coastlines of most areas were in the form of a single main body, or a
binary or ternary structure. When the proportion of a particular coastline was
more than 45%, it represented a single main structure. Furthermore, if the
proportion of all the coastlines was less than 45%, and two or more coastlines
exhibited a proportion of more than 20%, they represented a binary or ternary
structure.
Based on the impact of various human activities
on coastlines, the grading coefficient is determined by using the expert
scoring method, and the coastline utilization index is calculated as follows[12]
:
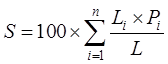 (3)
(3)
where,
S indicates the coastline utilization
index of the area in a particular year and  is the grading
coefficient for various coastlines based on the grading coefficient of the
coastline types in the Pearl River Estuary region given by Liu et al.[12]. According to the
characteristics and development utilization of the coastline type, the
coastlines were divided into four levels, among which the natural coastlines
were the least affected by humans; correspondingly, the grading coefficient was
the lowest (0.25). Conversely, the port wharf coastline and other artificial
coastlines were strongly affected by humans and could not be recovered;
subsequently, their grading coefficients were 0.85 and 0.9, respectively. Among
these, since the composition of other artificial coastlines was highly complex.
However, although the farmland aquaculture coastline was artificial, the
development utilization was relatively low; thus, the grading coefficient was
0.5.
is the grading
coefficient for various coastlines based on the grading coefficient of the
coastline types in the Pearl River Estuary region given by Liu et al.[12]. According to the
characteristics and development utilization of the coastline type, the
coastlines were divided into four levels, among which the natural coastlines
were the least affected by humans; correspondingly, the grading coefficient was
the lowest (0.25). Conversely, the port wharf coastline and other artificial
coastlines were strongly affected by humans and could not be recovered;
subsequently, their grading coefficients were 0.85 and 0.9, respectively. Among
these, since the composition of other artificial coastlines was highly complex.
However, although the farmland aquaculture coastline was artificial, the
development utilization was relatively low; thus, the grading coefficient was
0.5.
3.2
Technical Route
The
Landsat remote sensing images of the three Bay Areas were collected and
pre-processed, which included geometric correction and registration, band
synthesis, image mosaic, and cropping of study areas (Figure 1). Subsequently,
the classification system and interpretation signs of the coastlines in the
study area were established, and the spatial distribution of the Bay Area
coastlines was extracted using MNDWI, and gray threshold, mathematical
morphology, and Sobel operator methods. Furthermore, the accuracy of the
coastline results was verified on Google Earth. Later, the intensity, type
structure, and utilization index of the coastline length changes in the three
Bay Areas were calculated using the respective formulae. Additionally, the
degree of coastline changes in the three Bay Areas during 1980–2020 was
quantitatively analyzed.
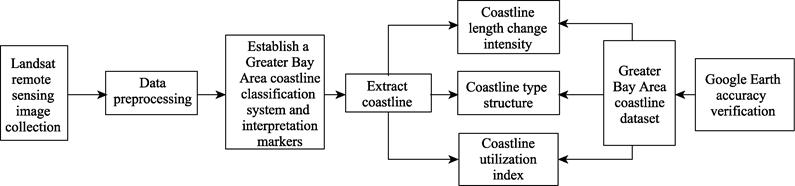
Figure 1 Technology roadmap of the
dataset development
4 Data Results
4.1
Data Composition
The acquired datasets of the spatial distribution map of
the three Bay Area coastlines mainly consisted of vector files (.shp and .kmz
formats), while the results of the changes in the coastline length change
intensity, type structure change, and utilization index calculated using the
relevant formulae were provided as a table file (.xlsx). The vector files of
the spatial distribution maps of the three Bay Area coastlines in 1980, 1990,
2000, 2005, 2010, 2015, and 2020 were derived from ArcGIS10.6. The data file
acronyms are given in Table 3. Results from the .shp data calculations and the
corresponding combination charts were conducted in Microsoft Excel. Further,
the datasets were compressed to 69 MB.
|
Table
3
Acronym comparison table
|
|
Location
|
Acronym
|
|
Guangdong-Hong Kong-Macao Greater Bay
Area
|
GHM
|
|
Tokyo Bay
|
TK
|
|
San Francisco
Bay
|
SF
|
4.2 Data
Results
The Landsat remote sensing images of the coastlines of the
seven periods from 1980 to 2020 were interpretated to acquire the distribution
of the coastline types in the three Bay Areas (Figure 2). Moreover, the length
percentages of different types of coastlines at different times on the Bay Area
Coast Zone scale were measured, and the coastline type structure was analyzed
(Figure 3). Subsequently, significant inter-annual and spatial differences were
observed in coastline types of the three Bay Areas. Furthermore, the proportion
of gravel, bedrock, and muddy coastlines in the total coastline length in the
three Bay Areas decreased continuously from 1980 to 2020, while the proportion
of artificial coastlines (farmland aquaculture, port wharf, and other
artificial) increased continuously. Additionally, the biological coastline
fluctuations in the Guangdong-Hong Kong-Macao Bay Area increased. In 2020, the
proportion of artificial coastlines in the three Bay Areas was over half,
reaching 57.62%, 95.87%, and 55.36%, respectively.
The intensity of
coastline changes in the seven periods in the three Bay Areas was calculated
using Equation (1) (Figure 4). Subsequently, the intensity of coastline length change
in the three Bay Areas fluctuated at each stage, with the largest change
observed in the Tokyo Bay, which was
followed by the Guangdong-Hong Kong-Macao Bay Area. The San Francisco Bay Area
was the most stable and exhibited the least fluctuations. The average annual
coastline length changes of the Guangdong-Hong Kong-Macao Bay Area, Tokyo Bay,
and San Francisco Bay during 1980–2020 were 0.22%, 0.37%, and 0.09%, respectively.
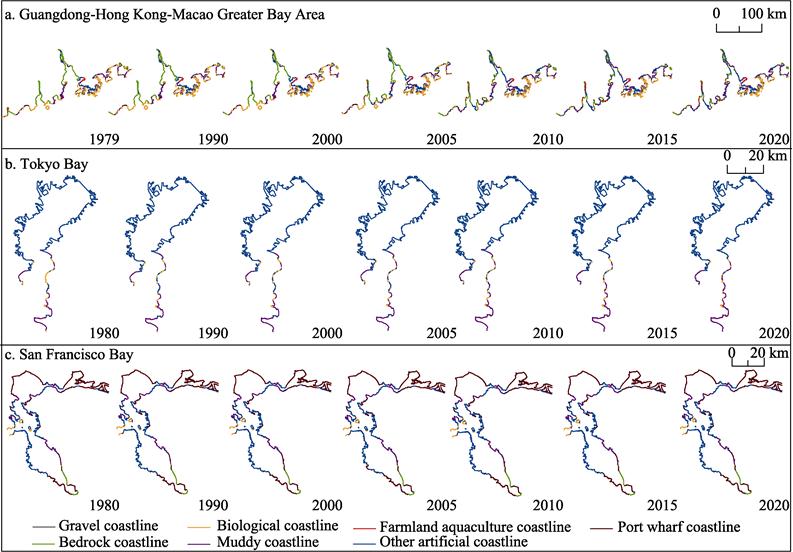
Figure 2 Spatial distribution of
different types of coastlines in the three Bay Areas from 1980 to 2020
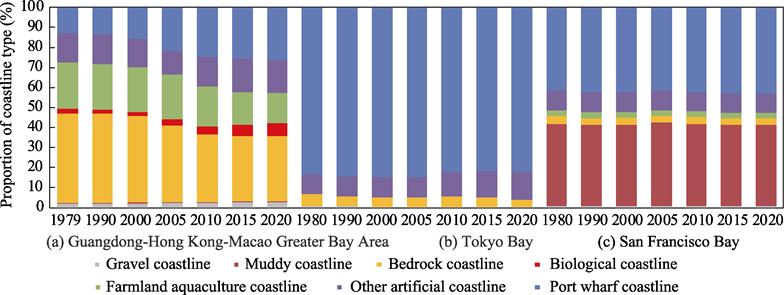
Figure 3 Coastline types
and their proportions in the three Bay Areas from 1980 to 2020
|
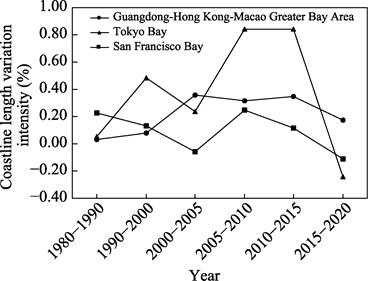
Figure 4 Intensity of
coastline length changes in the three Bay Areas from 1980 to 2020
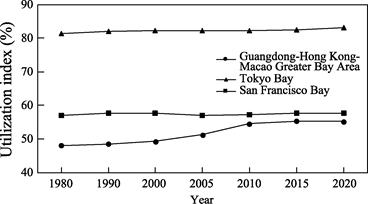
Figure 5 Coastline
utilization index of the three Bay Areas from 1980 to 2020
|
Furthermore, Equation (2) was used to
divide the main types of the three
Bay Area coastlines (Figure 3) to reflect
the changes in the coastline complexity in each Bay Area. Subsequently,
the Guangdong-Hong Kong-Macao Bay Area exhibited the most complex composition
and changes in the coastline types, which ranged from a binary structure
comprising bedrock and farmland aquaculture coastlines in 1979 to a ternary
structure comprising bedrock, farmland aqua-culture,
and port wharf coastlines in 2005, and further to a binary structure
comprising bedrock and port wharf coastlines in 2020. Contrastingly, the
coastline type of the San Francisco Bay exhibited a muddy and port wharf
coastline duality structure throughout the study period, while the coastline of
the Tokyo Bay was a single main structure of the port wharf coastline.
To investigate the impact of various human activities on
the coastlines, the coastline utilization index was calculated according to
Equation (3) and the grading coefficient. Figure 5 indicates that the coastline utilization index of the Guangdong-Hong
Kong-Macao Bay Area, Tokyo Bay Area, and San Francisco Bay Area increased from
1980 to 2020 by 7.09%, 1.81%, and 0.63%, respectively. Thus, the Guangdong-Hong
Kong-Macao Bay Area changed the most, with a notable ??steep slope?? observed
between 2005 and 2010. The order of the utilization indexes of the three Bay
Areas was Tokyo Bay (83.22%) > San Francisco Bay (57.70%) >
Guangdong-Hong Kong-Macao Bay Area (55.20%).
5
Conclusions
Using the Landsat remote sensing and Google Earth images,
the coastlines of the three Bay Areas were extracted for 1980, 1990, 2000,
2005, 2010, 2015, and 2020 at a spatial resolution of 10 m. The variations in
the length, type, and utilization of each Bay Area coastline were compared and
analyzed. Consequently, significant inter-annual and spatial differences were
observed between the three Bay Area coastline types from 1980 to 2020.
Furthermore, the average length change intensities of the coastlines in the Guangdong-Hong
Kong-Macao Bay Area, Tokyo Bay, and San Francisco Bay were 0.22%, 0.37%, and
0.09%, respectively. The composition and changes in the coastlines of the
Guangdong-Hong Kong-Macao Bay Area were the most complex. The proportion of the
farmland aquaculture coastline declined in 2020 and was converted to a binary
structure of bedrock and port wharf coastlines. Conversely, the Tokyo Bay
coastline remained as a single main structure composed of port wharf
coastlines, while the San Francisco Bay coastline exhibited a binary structure
comprising muddy and port wharf coastlines. In 2020, the proportion of
artificial coastlines of the Guangdong-Hong Kong-Macao Bay Area, Tokyo Bay, and
San Francisco Bay was over half, at 57.62%, 95.87%, and 55.36%, respectively,
and the utilization indexes were 55.20%, 83.22%, and 57.70%, respectively.
During 1980–2020, the Guangdong-Hong Kong-Macao Bay Area changed the most at
7.09%.
Existing coastline datasets are concentrated in islands and
areas with intensive human activities, and the Bay Area, as a representative of
global economy, includes detailed information regarding coastline changes.
Thus, the Bay Area coastline dataset plays an important role in studying the
coastline changes in the Pacific Coastal Bay Area and analyzing the changes of
regional landscape patterns and the degree of coastline development and
utilization. Therefore, the findings serve as a strong reference for rational
exploitation of coastal resources in the Bay Area and promotion of its
harmonious development with human civilization.
Author
Contributions
Li, Z. Q. designed the overall plan
and technical framework of this dataset. Su, Q. X. contributed to the data
processing, verification and analysis, and wrote the data paper.
Conflicts of Interest
The authors declare no conflicts of
interest.
References
[1]
Gao, S.
Regional differences in coastal zones and classification of Marine economic
potential: a land-sea perspective [J]. Democracy & Science, 2020(1): 29–31.
[2]
Zhang, J.
J., Su, Z. F., Zuo, X. L., et al.
Research on the spatial differentiation of coastal land development surrounding
South China Sea [J]. Acta Geographica Sinica, 2015, 70(2): 319–332.
[3]
Su, Q. X.,
Li, Z. Q. Coastline types and their spatiotemporal variations in Guangdong-Hong
Kong-Macao Bay Area (1979–2020) [J/DB/OL]. Digital
Journal of Global Change Data Repository, 2021. https://doi.org/10.3974/geodb.2021.04.07.V1.
https://cstr.escience.org.cn/CSTR:20146.11.2021.04.07.V1.
[4]
Su, Q. X.,
Li, Z. Q. Coastline types and their spatiotemporal variations in Tokyo Bay
(1980–2020) [J/DB/OL]. Digital Journal of
Global Change Data Repository, 2021. https://doi.org/10.3974/geodb.2021.04.08.V1.
https://cstr.escience.org.cn/CSTR:20146.11.2021.04.08.V1.
[5]
Su, Q. X.,
Li, Z. Q. Coastline types and their spatiotemporal variations in San Francisco
Bay (1980–2020) [J/DB/OL]. Digital Journal of Global Change Data Repository, 2021. https://doi.org/10.3974/geodb.2021.04.09.V1.
https://cstr.escience.org.cn/CSTR:20146.11.2021.04.09.V1.
[6]
GCdataPR
Editorial Office. GCdataPR data sharing policy [OL].
https://doi.org/10.3974/dp.policy.2014.05 (Updated 2017).
[7]
Hou, X. Y.,
Wu, T., Wang, Y. D., et al.
Extraction and accuracy evaluation of multi-temporal coastlines of mainland
China since 1940s [J]. Marine Sciences, 2014, 38(11): 66–73. DOI:
10.11759/hykx 20131217001.
[8]
Zhao, Y. L.
Remote sensing survey and proposal for protection of the natural resources in
Guangdong-Hong Kong-Macao, Greater Bay Area [J]. Remote Sensing for Land & Resources, 2018, 30(4):
139–147.
[9]
Liu, C.,
Shi, R. X., Zhang, Y. H., et al.
Global multi-scale shoreline dataset of land and sea based on Google Earth
remote sensing image (2015) [J/DB/OL]. Digital Journal of Global Change Data
Repository, 2019. https://doi.org/10.3974/geodb.2019.04.13.V1.
https://cstr.escience.org.cn/CSTR:20146.11.2019.04.13.V1.
[10] Chen, B. Q., Xiao, X. M., Li, X. P., et al. Spatial distribution data of
mangroves in China in 2015 [J/DB/OL]. Digital Journal of Global Change Data
Repository, 2017. https://doi.org/10.3974/geodb. 2017.03.06.V1.
[11] Gao, Z. Q., Liu, X. Y., Ning, J. C., et al. Analysis on changes in coastline
and reclamation area and its causes based on 30-year satellite data in China
[J]. Transactions of the Chinese Society of Agricultural Engineering,
2014, 30(12): 140–147.
[12] Liu, X. L., Deng, R. R., Xu, J. H., et al. Spatiotemporal evolution
characteristics of coastlines and driving force analysis of the Pearl River
estuary in the past 40 years [J]. Journal of Geo-information Science,
2017, 19(10): 1336–1345.
[13] Xiao, R. Analysis of change and driving force of
the coastline of mainland in nearly 35 years [D]. Shanghai: East China Normal
University, 2017.