Dataset
Development on Integrative Level and
Radiative Capacity of Urban Agglomerations in China (2006?C2019)
Qiu, S. Y.
School of Economics and
Management, Wuhan University, Wuhan 430062, China
Abstract: As
the main spatial carrier of regional economic development, urban agglomerations
should not only pay attention to their internal integrative level, but also
play a role in external radiative effects so as to promote high-quality
economic development. The spatial spillover effect of 284 cities?? factors in
China from 2006 to 2019 was decomposed using a production function embedded in
an endogenous spatio-temporal weight matrix, on the basis of which the
integrative level and radiative capacity of China??s 19 urban agglomerations
(2006?C2019) were measured. It is found that regions exhibiting a higher
integrative level and radiative capacity of urban agglomerations are mainly
concentrated in the southeastern coast. The integrative level and radiative
capacity of urban agglomerations show a significant positive relationship.
Meanwhile, this dataset elucidates the spatial and temporal evolution
characteristics of the integrative level and radiative capacity of 19 urban
agglomerations in China during the period from 2006 to 2019. This dataset
includes the following data from 2006 to 2019: (1) the spatial spillover effect
of urban factors for 284 cities in China; (2) the integrative level of the 19
urban agglomerations; and (3) the radiative capacity of the 19 urban
agglomerations. The dataset is archived in .xlsx format and consists of 1 data
file with a file size of 89.3 KB.
Keywords: spatial
spillover of factors; integration level; radiation capacity; urban
agglomerations
DOI: https://doi.org/10.3974/geodp.2025.01.02
Dataset Availability Statement:
The dataset
supporting this paper was published and is accessible through the Digital Journal of
Global Change Data Repository at: https://doi.org/10.3974/geodb.2024.11.01.V1.
1 Introduction
??Improving the mechanism of regional
integration and development, and promoting Beijing-Tianjin-Hebei, the Yangtze
River Delta and the Guangdong-Hong Kong-Macao Greater Bay Area to better fulfil
their roles as powerhouses of high-quality development?? is an important
development strategy of China. Improving the internal integrative level and
external radiative capacity of urban agglomerations is the economic
geographical embodiment of the aforementioned development tasks. The
prerequisite for improving the integrative level and radiative capacity of
urban agglomerations involves reasonably measure and analyse the integrative
level and radiative capacity of Chinese urban agglomerations[1].
particularly within the framework of the new development paradigm, how to
assess the internal factor flow pattern and external economic diffusion
capacity of urban agglomerations through the spatial spillover effect of
factors, and subsequently conduct an
accurate and effective analysis of their internal integrative development
status and external radiation-driven capacity has emerged as a pressing
scientific inquiry that must be addressed to facilitate the promotion of
Chinese modernization.
Existing
research predominantly measures the integrative level of urban agglomerations mainly by the indicator construction method, which
synthesises multi-dimensional indicators such as economic, cultural and
environmental indicators of urban agglomerations[2], but the
selection of indicators tends to be more subjective, with a lack of economic
significance. Moreover, the study area is often limited to to certain urban
agglomerations or specific regions such as the Yangtze River Economic Belt[3?C5].
The radiative capacity of urban agglomerations is measured by field strength
models or global spatial econometric models[6,7], which often lacks
rigorous statistical inference and comprehensive spatial and temporal weighting
matrices. In fact, a high degree of integration within urban agglomerations
often results in a ??physical reaction?? or ??chemical reaction?? that contributes
to the radiatve capacity of urban agglomerations by enhancing factor mobility
and total factor productivity. Therefore, further exploration and research are
needed to accurately measure the integrative level and radiative capacity of
urban agglomerations.
In summary, the
current methods for measuring the integrative level and radiative capacity of
urban agglomerations fail to consider the spatial spillover effects of factors.
Moreover, there are fewer studies related to urban agglomerations that align
with national policies in China. Therefore, this dataset utilizes a
multivariate city-level database and a Cobb-Douglas (CD) production function
integrated within a spatial econometric model to assess the urban Integrative
level and radiative capacity in China, which offering valuable data support for
the study of high-quality development for urban agglomerations in China.
2 Metadata of the Dataset
The
metadata of the Integrative level and radiative capacities dataset on urban
agglomerations of China (2006?C2019)[8] is summarized in Table 1. The
dataset encompasses the dataset full name, short name, authors, year of the
dataset, data format, data size, data files, data publisher, and data sharing
policy, etc.
3 Methods
3.1 Methodology
3.1.1 Measurement of
Spatial Spillover Effects of Factors
The CD production function is integrated with a general
nested spatial econometric model to decompose the spatial spillover effects of
capital and labor factors, as formulated below:
 (1)
(1)

 (2)
(2)
where  ,
,  and
and  represent output
(hundred million CNY), capital (hundred million CNY) and labour factors (ten
thousand people) respectively. ui is individual fixed
effects, and
represent output
(hundred million CNY), capital (hundred million CNY) and labour factors (ten
thousand people) respectively. ui is individual fixed
effects, and is a time fixed effect.
  and eit
are the random disturbance terms, where eit is an
and eit
are the random disturbance terms, where eit is an
Table
1 Metadata summary of Integrative level and
radiative capacities dataset on urban agglomerations of China (2006?C2019)
|
Items
|
Description
|
|
Dataset full name
|
Integrative
level and radiative capacities dataset on urban agglomerations of China
(2006?C2019)
|
|
Dataset short name
|
UrbanAggloIntgLevel&RadiCapacity
|
|
Author
|
Qiu, S. Y., School of Economics and Management, Wuhan University,
qsypure@qq.com
|
|
Geographical region
|
284 prefecture-level cities and above in China
|
|
Year
|
2006?C2019
|
|
Data format
|
.xlsx
|
|
Data size
|
89.3 KB
|
|
Data files
|
Spatial spillover of factors in 284 Chinese cities, 2006?C2019;
Integrative levels and radiative capacity of 19 urban agglomerations in
China, 2006?C2019
|
|
Foundation
|
Nanjing
Institute of Geography and Limnology, Chinese Academy of Sciences
(NIGLAS2022GS06)
|
|
Data computing
environment
|
Matlab
|
|
Data publisher
|
Global Change Research Data Publishing & Repository,
http://www.geodoi.ac.cn
|
|
Address
|
No. 11A, Datun Road, Chaoyang District, Beijing 100101, China
|
|
Data sharing policy
|
(1) Data are openly available and can be
free downloaded via the Internet; (2) End users are
encouraged to use Data subject to citation; (3) Users,
who are by definition also value-added
service providers,
are welcome to redistribute Data subject to written permission from the
GCdataPR Editorial Office and the issuance of a Data redistribution license; and (4)
If Data are used to compile new
datasets, the ??ten percent principal?? should be followed such that Data records utilized should not
surpass 10% of the new dataset contents, while sources should be clearly
noted in suitable places in the new dataset[9]
|
|
Communication and
searchable system
|
DOI, CSTR, Crossref, DCI, CSCD, CNKI, SciEngine, WDS, GEOSS,
PubScholar, CKRSC
|
independent and identically distributed random variable that
follows a normal distribution with zero mean and homoskedasticity, and t is the specific period of the sample. SWE is the spatio-temporal weight
matrix, which is the core of the spatial spillovers of the capital and labour
factors in this dataset.
3.1.2 Measurement of
the Integrative Level and Radiative Capacity of Urban Agglomerations
This dataset utilizes the spatial spillover effects of
factors within and outside the urban agglomeration to quantify the integrative
level and radiative capacity of the urban agglomeration. The specific measured
integrative level and radiative capacity of urban agglomeration are presented
in equations 3 and 4.
 (3)
(3)
 (4)
(4)
Where CIgt denotes the integrative level of
urban agglomeration g in period t, and SIgt denotes
the radiative capacity of urban agglomeration g in period t. It is
worth noting that in order to compare the gap between the integrative level and
radiative capacity of urban agglomeration, the range of integrative level and
radiative capacity of the measured urban agglomeration are all within the (0, 1).
Please refer to the literature[1] for details of the above specific
formulae.
3.2 Data Sources
Considering data availability and temporal completeness, the
sample of cities in this dataset is the 284 prefecture-level cities and above
in China from 2006 to 2019, and the sample of city clusters consists of the 19
urban agglomeration specified in the 14th Five-Year Plan. When measuring GDP,
capital stock, and labor force, the interpolation method is used to address the
cities with a few missing data. The data are sourced from the China Urban
Statistical Yearbook[10], the Development Research Center of the
State Council (DRCnet) Database
and the CEIC database.
4 Data Composition and Results
4.1 Dataset
Composition
The dataset consists of 3 parts: (1) the spatial spillover
effects of 284 urban factors in China from 2006 to 2019; (2) the integrative
level of 19 urban agglomerations in China from 2006 to 2019; and (3) the
radiative capacity of 19 urban agglomerations in China from 2006 to 2019. The dataset is archived
in .xlsx format, and consists of 1 data file.
4.2 Data Results
|
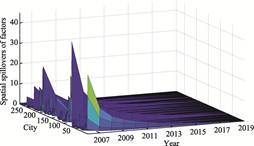
Figure 1 Spatial spillovers of
urban factors in China (2006?C2019)
|
Figure 1 shows the spatial spillover effect of
factors in Chinese cities from 2006 to 2019, which comprises the sum of the
spatial spillover effect of the capital factor and the spatial spillover
effects of the labour factor. The overall trend of spatial spillover effect of
factors has decreased from 2006 to 2019, which is attributed to the spatial
spillover effect of factors measured in this dataset integrates the dual
attributes of time and space, and as time progresses, the weaker the spillover
effect of factors become, which is in line with the characteristics of the
mobility and depreciation of the real labour and capital factor. The specific
reasons for this can be found in the literature[10]. From the
spatial dimension, the top ten cities in terms of spatial spillover effects in
2006 are Shanghai, Beijing, Shenzhen, Suzhou, Guangzhou, Dongguan, Tianjin,
Wuxi, Hangzhou and Nanjing. And the top ten cities in 2019 include Shanghai,
Beijing, Shenzhen, Chongqing, Guangzhou, Suzhou, Wuhan, Tianjin, Hangzhou and
Nanjing. It can be seen that Chinese cities with high spatial spillover effect
of factors are mainly concentrated in the Yangtze River Delta and Pearl River
Delta regions, while Chongqing and Wuhan have gradually risen to the top ten,
which have displaced the traditional manufacturing powerhouses such as Wuxi.
Meanwhile, the cities with lower spatial spillover effect of factors are
primarily located in the western and northeastern
regions, such as Qitaihe, Zhongwei and Jinchang, which have smaller
economic volumes and population sizes,
making it difficult for them to generate strong spatial spillover effect of factors. In summary, the spatial
distribution of spillover effects in Chinese cities is closely related to the
economic development of the cities, showing the characteristic of ??high in the
east and low in the west??.
The integrative level of China??s urban agglomerations from
2006 to 2019 is classified into 4 major segments according to the Statistical System and Classification Standard (16) developed by the
National Bureau of Statistics. The trend in the integrative level of the four major urban
agglomerations is illustrated in Figure 2. It can be seen that the integrative
level of the eastern urban agglomerations has consistently been the highest
throughout the period of 2006?C2019, particularly the integrative level of the
Yangtze River Delta urban agglomerations has consistently ranked at the top.
The western urban agglomerations, on the other hand, have always ranked at the back during the sample period. Meanwhile,
the integrative level of the central city cluster has gradually surpassed that
of the northeastern urban agglomerations since 2018, with the urban
agglomerations in the middle reaches of the Yangtze River playing a key role.
|
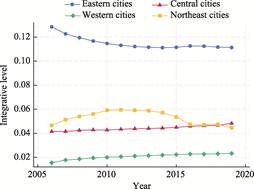
Figure 2
Integrative level of urban agglomerations in China (2006?C2019)
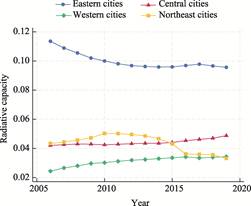
Figure 3
Radiative capacity of urban agglomerations in China (2006?C2019)
|
The trends in the radiative capacity of urban agglomerations
in China??s 4 major sectors from 2006 to 2019 are illustrated in Figure 3.
Figure 3 shows that there is a positive relationship between the radiative
capacity and the integrative level, indicating that urban agglomerations with a
higher level of integration exhibit a stronger radiative capacity, which is
closely linked to the industrial expansion and productivity gains resulting from
integration. However, in contrast to the trend in integration levels, the
radiative capacity of central urban agglomerations began to surpass that of
northeastern urban agglomerations after 2015, with the gap between the two
widening. This indicates that the central region has emerged as a significant
regional radiative hub, whereas the radiative capacity of the northeastern
region is gradually declining due to natural and historical reasons,
necessitating attention.
5 Discussion and Conclusion
Urban agglomerations are organic aggregates composed of
individual cities characterized by two attributes: internal collaboration and
external influence, and the integrative level and radiative capacity of urban
agglomerations serve as a more intuitive representation. This dataset
quantifies the spatial spillover effect of factors, internal integration and
external radiative capacity of Chinese cities by constructing a CD production
function embedded in a spatial econometric model, thereby mitigating the subjectivity
inherent in the indicator construction method and aligning with the reality of
increasingly interconnected factor flows between cities. Moreover, the results
of this paper align with the 19 urban agglomerations described in China??s 14th
Five-Year Plan, demonstrating a high level of data accuracy. This dataset
provides insights into the internal and external operational quality of China??s
urban agglomerations through the lens of spatial spillovers, thus offering
empirical references for the high-quality development of urban agglomerations
and the coordinated development of the region. The study finds:
(1) Spatial spillovers of factors are stronger in Yangtze
River Delta, Pearl River Delta and certain large cities in the central and
western parts of the country, while spatial spillover of factors are generally
weaker in western cities.
(2) The level of integration is higher
in the eastern urban agglomerations and weaker in the western urban
agglomerations. The level of integration of the central urban agglomeration is gradually rising and exceeding that of the north-eastern
urban agglomeration.
(3) The level of integration and radiative capacity of urban
agglomerations show a clear positive relationship, while the radiative capacity
of central urban agglomerations continues to strengthen and gradually widen the
gap with northeastern city clusters.
This dataset measures the integrative level and radiative
capacity of China??s 19 urban agglomerations through an advanced decomposition
of spatial spillover effects of factors. It provides data to enhance the
quality of urban agglomeration development, mitigating regional development
gaps, achieving regional economic convergence and securing Chinese modernisation. Future research can
utilize this data to examine the influencing factors of the integrative level
and radiative capacity of urban agglomerations through novel perspectives, new
technologies and new data.
Conflicts
of Interest
The
authors declare no conflicts of interest.
References
[1]
Qiu, S. Y., Sun, W. Measuring the integration
level and analysing the radiation capacity of urban agglomerations in China
[J]. Geography Research, 2024, 43(2):
303?C321.
[2]
Su, D., Fang, X., Wu, Q., et al. Exploring the spatiotemporal integration evolution of the
urban agglomeration through city networks [J]. Land, 2022, 11(4): 574.
[3]
Li, S. Q., Zhu, P. F. Exploration of indicators
for evaluation of Yangtze River Delta integration and its new findings [J]. Nanjing Social Science, 2017(7): 33?C40.
[4]
Chen, H. X., Xi, Q. M. Level measurement and
influential factors analysis of labour market integration in
Beijing-Tianjin-Hebei cities [J]. China
Soft Science, 2016(2): 81?C88.
[5]
Liu, Y. L., Zhang, X. H., Pan, X. Y., et al. The spatial integration and
coordinated industrial development of urban agglomerations in the Yangtze River
Economic Belt, China [J]. Cities,
2020, 104: 102801.
[6]
Yao, Z. F., Ye, K. H., Xiao, L. G., et al. Radiation effect of urban
agglomeration??s transportation network: evidence from Chengdu?CChongqing urban
agglomeration, China [J]. Land, 2021,
10(5): 520.
[7]
Han, D. Research on the nature and intensity of
economic radiation of central cities under the perspective of city clusters: a
comparative analysis based on Beijing-Tianjin-Hebei and Yangtze River Delta
[J]. Urban Development Research,
2020, 27(12): 12?C16.
[8]
Qiu, S. Y. Integrative level and radiative
capacities dataset on urban agglomerations of China (2006?C2019) [J/DB/OL]. Digital Journal of Global Change Data
Repository. https://doi.org/10.3974/geodb.2024. 11.01.V1.
[9]
GCdataPR Editorial Office. GCdataPR data sharing
policy [OL]. https://doi.org/10.3974/dp.policy.2014.05 (Updated 2017).
[10]
National Bureau of Statistics. Statistical
Yearbook of Chinese Cities (2000?C2017) [M]. Beijing: China Statistics Press,
2001?C2019.
[11]
Feng, X. H., Qiu, S. Y. Measurement of total
factor productivity and analysis of factor spatial spillover effects in Chinese
cities [J]. Geographical Science,
2024, 44(5): 775?C784.