Dataset
Development on Nitrogen and Phosphorus Flows in Agricultural System Affected by
Tourists in Wentang Town, Jiangxi Province of China (2018, 2020)
Chen, Q. Q.1*
Long, Z. D.2 Pang, A. P.3 Liu, Z. H.4 Xu, Y. Y.1, 5
1.
College of Life Science and Resources and Environment, Yichun University,
Yichun 336000, China;
2. Hunan Soil Fertilizer Research Institute, Changsha
410205, China; 3. Department of Public Management, Nanjing Academy of
Administration, Nanjing 210046, China; 4. Law enforcement brigade for
ecological environment protection comprehensive of Yuan Zhou, Yichun 336000,
China; 5. Law enforcement brigade for ecological environment protection
comprehensive of Jinzhong City, Jinzhong 030600, China
Abstract: Phosphorus
and nitrogen are critical indicators of water eutrophication, with
socio-economic activities being major contributing factors. This study area
located in Wentang Town, Jiangxi Province, China, by applying material balance
theory and nitrogen and phosphorus life cycle analysis to assess their flows
within the agricultural system (i.e. the System). The System was subdivided
into 5 subprocesses: cultivation, animal feeding, food processing, consumption,
and waste disposal. Data on phosphorus and nitrogen flows associated with
tourist consumption behaviors and the agricultural system were collected
through questionnaire surveys (conducted in December 2018 and March 2020) and
literature research. Activity levels and calculation coefficients were
identified and compiled to quantitatively assess the impact of tourist
consumption on phosphorus and nitrogen dynamics within the System. The dataset
includes: (1) geolocation of Wentang Town; (2)
underlying data of tourist consumption behaviors and typical agricultural economic system and calculated coefficient of N
and P; (3) the influence of tourist consumption behaviors on P and N flow in 5
subprocesses: cultivation, animal feeding, food processing, consumption and
disposal; (4) the influence of tourist consumption behaviors on P and N import
and export in typical agricultural economic system. The
dataset is archived in .shp and .xlsx data formats, and consists of 8 data
files with data size of 143 KB (compressed into one file with 135 KB).
Keywords: phosphorus;
nitrogen; agricultural activity; resident consumption; tourist consumption; tourism
DOI: https://doi.org/10.3974/geodp.2025.01.11
Dataset Availability Statement:
The dataset
supporting this paper was published and is accessible through the Digital Journal of
Global Change Data
Repository at: https://doi.org/10.3974/geodb.2025.01.03.V1.
1 Introduction
Phosphorus
and nitrogen are essential nutrients for biological processes, and which are
fundamental to human societal development. However, their extensive use has
caused significant environmental pollution and resource depletion[1,2]. Between 2016 and 2022, more than 81%?C99%
of phosphorus and 85%?C97% of nitrogen discharges
originated from domestic, agricultural, and centralized waste treatment sources. Material
balance theory underpins substance flow analysis,
which tracks and quantifies resource utilization[3] and
environmental impacts[4,5] by analyzing phosphorus and nitrogen
inputs, outputs, and storage across socio-economic and environmental systems.
Previous research has explored nutrient flows at global[6?C8],
national[5,9], and regional scales[10], primarily
focusing on socio- economic systems where urban and rural populations are the
primary consumers. These studies indicate that human activities??driven by
economic development, population growth, dietary shifts, and population density[5,10,11]??substantially
influence nitrogen and phosphorus fluxes.
Tourism has
emerged as a significant driver of environmental change, intensifying pollution
and resource depletion in destination areas. However, studies on the influence
of tourist consumption on nitrogen and phosphorus flows remain scarce. Most
prior research has focused on phosphorus and nitrogen flows associated with
urban and rural residents while neglecting the heightened metabolic intensity
introduced by tourists. This study addresses this gap by selecting Wentang
Town, an agriculturally driven economy in Jiangxi Province, as a study area. Using
material balance theory and substance flow analysis, phosphorus and nitrogen
activity levels associated with both tourist consumption and agricultural
activities (hereafter referred to as the ??System??) were systematically
compiled. A refined phosphorus and nitrogen flow model was developed to
quantitatively assess the impact of tourism-related consumption on nutrient
dynamics within the System and its subprocesses.
2 Metadata of the Dataset
Dataset
of nitrogen and phosphorus flow in agricultural system affected by tourists in Wentang Town of
Jiangxi Province of China (2018, 2020)[12] has been summarized in
Table 1. It includes the dataset full name, short name,
authors, year of the dataset, data format, data size, data files, data
publisher, and data sharing policy, etc.
3 Methods
3.1 Data Collection and
Processing
The study aimed to quantify
the impact
of tourist consumption on phosphorus
and nitrogen
Table
1 Metadata summary of Dataset
of nitrogen and phosphorus flow in agricultural system affected by tourists in
Wentang Town of Jiangxi Province of China (2018, 2020)
|
Items
|
Description
|
|
Dataset full name
|
Dataset of nitrogen and phosphorus flow in agricultural
system affected by tourists in Wentang Town of Jiangxi Province of China
(2018, 2020)
|
|
Dataset short name
|
N&P_Flow_WentangJX
|
|
Authors
|
Chen, Q. Q., College of Life Science and Resources
and Environment, Yichun University, chenqq@nju.edu.cn
Pang, A. P., Department of Public Management, Nanjing
Academy of Administration, qinglan231@163.com
Long, Z. D., Hunan Soil Fertilizer Research Institute,
longzd313@hunaas.cn
Liu, Z. H., Law enforcement brigade for ecological
environment protection comprehensive of Yuan Zhou, Yichun, 346381060@qq.com
Xu, Y. Y., Law enforcement brigade for ecological
environment protection comprehensive of Jinzhong City, 19581905174@163.com
|
|
Geographical region
|
Wentang Town of Jiangxi Province
|
|
Year
|
2018, 2020
|
|
Data format
|
.shp and .xlsx
|
|
|
|
Data size
|
143 KB, compressed to135 KB
|
|
|
|
Data files
|
Geolocation of Wentang Town; Underlying data on
tourist consumption behaviors and typical agricultural economic system and
calculated coefficient of N and P; The influence of tourist consumption
behaviors on P and N flow in 5 subprocesses, and the influence of tourist
consumption behaviors on P and N import and export in typical agricultural
economic systems
|
|
Foundations
|
Education Department of Jiangxi Province
(GJJ190845, GL21223)
|
|
Data publisher
|
Global Change
Research Data Publishing & Repository, http://www.geodoi.ac.cn
|
|
Address
|
No. 11A, Datun Road, Chaoyang District,
Beijing 100101, China
|
|
Data sharing policy
|
(1) Data
are openly available and can be free downloaded via the Internet; (2) End
users are encouraged to use Data
subject to citation; (3) Users, who are by definition also value-added
service providers, are welcome to redistribute Data subject to
written permission from the GCdataPR Editorial Office and the issuance of a Data redistribution license; and (4) If Data are used to compile new datasets, the ??ten percent
principal?? should be followed such that Data
records utilized should not surpass 10% of the new dataset contents, while
sources should be clearly noted in suitable places in the new dataset[13]
|
|
Communication and
searchable system
|
DOI, CSTR, Crossref, DCI, CSCD, CNKI, SciEngine, WDS,
GEOSS, PubScholar, CKRSC
|
flows
within a typical agricultural system. The methodology involved 3 key steps
(Figure 1). First, we reviewed existing literature to identify phosphorus and
nitrogen inputs, outputs, and stocks, determine activity levels, and establish model
parameters. This initial model considered only urban and rural residents as
consumers. Second, data sources??including statistical records, literature
reviews, and questionnaire surveys??were used to characterize phosphorus and
nitrogen flows associated with tourist consumption. This step enabled the
identification of inputs, outputs, and stocks specific to tourists, along with
the necessary activity level data and computational parameters. As a result, a
revised ??three-bodies?? (urban
residents, rural residents, and tourists) phosphorus and nitrogen flow model was
developed, incorporating urban residents, rural residents, and tourists.
Finally, we calculated and analyzed phosphorus and nitrogen fluxes under
scenarios with and without tourist consumption, allowing for a quantitative
evaluation of tourism??s impact on nutrient dynamics within the System.
This
study employed substance flow analysis (SFA) to develop a phosphorus and
nitrogen flow model for the agricultural system, we established a phosphorus
and nitrogen metabolism model, which integrates tourists as the third consumer group
within the agricultural economic system. The model??s spatial boundary
corresponded to Wentang Town??s administrative limits, with 2018 as the
reference year. The System was categorized into 5 subprocesses: cultivation, animal
feeding, food processing, consumption, and waste
disposal.
|
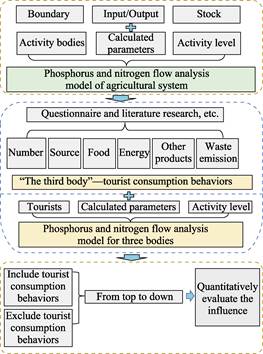
Figure 1 Flowchart of the dataset development
|
Cultivation
subprocess: this subprocess involved the
sowing and harvesting of crops from both cultivated farmland and landscaped
areas. Most agricultural products were directed to the food processing
subprocess, while a smaller portion was allocated as animal feed. No
significant phosphorus or nitrogen losses occurred within this
subprocess. The phosphorus and nitrogen balance followed the equation: input
(other subprocesses (intra-system circulation), import, environmental input) = output (other subprocesses, export,
environmental emissions) + stock.
Animal feeding subprocess: this subprocess encompassed livestock
rearing from juvenile stages to maturity before slaughter. No additional nutrient losses occurred. The phosphorus and
nitrogen balance were expressed as: input (other subprocesses (intra-system
circulation), import) = output (other
subprocesses, export, environmental emissions) + stock.
Food processing
subprocess: this referred to the initial processing of agricultural and
livestock products based on industrial practices. Unlike other subprocesses,
this stage experienced processing-related losses. Phosphorus and nitrogen
dynamics were described as: input (other subprocesses (intra-system))=output
(other subprocesses, export,
environmental emissions) + loss.
Consumption
subprocess: this encompassed the intake and metabolism of agricultural products
by urban residents, rural residents, and tourists, with partial stockpiling to
meet metabolic demands. Excluding local inhabitants who traveled as tourists,
visiting tourists were categorized into three groups based on their origin and
length of stay, they are domestic one-day tourists (610.36??104
person-times), domestic overnight tourists (395.36??104 person- times),
and international overnight visitors (7.72??104 person-times). The phosphorus and nitrogen flows
associated with tourists were aggregated across these three categories. The
phosphorus and nitrogen balance for this subprocess was: input (other
subprocesses (intra-system circulation), import) = output (other subprocesses, export, environmental emissions) + stock + loss.
Waste disposal
subprocess: this encompassed waste management for discarded materials from the cultivation,
animal feeding, food processing, and consumption subprocesses. No additional
losses occurred in this stage. The phosphorus and nitrogen balance for this
subprocess was: input (other subprocesses (intra-system circulation)) = output
(other subprocesses, export,
environmental emissions) + stock.
3.2 Data Sources
Data
for this study were collected through survey questionnaires, interviews, statistics,
and published literature. Information on cultivated land, crop yield, pesticide
and fertilizer usage, livestock stocking, slaughter rates, and animal product
yields was sourced from the ??2018 Rural Economic Statistical Yearbook of
Wentang Town, Yichun City??[14].
Phosphorus and
nitrogen consumption data for urban residents were derived from a combination
of questionnaire surveys conducted in December 2018 and statistical data. These
included household consumption of food, meat, vegetables, phosphorus-containing
chemical products, and waste generation, alongside basic demographic
information such as population size and lifespan. Rural residents?? phosphorus
and nitrogen consumption and waste discharge were primarily obtained from statistical
records. Tourist consumption data were gathered through survey questionnaires
and statistical reports. In December 2018, food consumption and waste emissions
from tourists were assessed via a survey of the catering industry and interviews
conducted in Wentang Town. A follow-up study in March 2020 provided
supplementary data on tourist consumption and waste discharge. Phosphorus and
nitrogen coefficients were primarily extracted from published literature and
technical standards and were adjusted based on the specific conditions of the
study area. To ensure accuracy, preference was given to sources from Yichun
City or Jiangxi Province, aligning with the local context of Wentang Town.
Respondents for
the questionnaire survey were selected primarily from central streets and
densely populated areas. Given the relatively high educational level among
urban residents, the survey was conducted anonymously and self-administered,
with researchers providing guidance as needed to ensure data quality.
All data and
parameters used in this study are detailed in the dataset Dataset of nitrogen
and phosphorus flow in agricultural system affected by tourists in Wentang Town
of Jiangxi Province of China (2018, 2020)[12]
4 Data Results and Validation
4.1 Dataset Composition
The dataset consists of the following
components: (1) geolocation of Wentang Town; (2) underlying data of tourist
consumption behaviors and typical agricultural economic system and calculated
coefficient of N and P; (3) the influence of tourist consumption behaviors on P
and N flow in 5 subprocesses: cultivation, animal feeding, food processing,
consumption and disposal; (4) the influence of tourist consumption behaviors on
P and N import and export in typical agricultural economic system. The dataset is
archived in .shp and .xlsx formats, with detailed
information of (2)?C(4) presented in Table 2.
4.2 Data Results
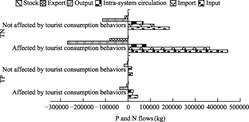
The cultivation subprocess
served as the starting point for phosphorus and nitrogen flows within the
agricultural system. Tourist consumption introduced additional input pathways
for phosphorus and nitrogen, leading to variations in input, output, and stock within
the cultivation subprocess (Figure 2). Specifically, tourist consumption
resulted in increased excrement and kitchen waste being returned to cultivated
land, raising intra-system circulation rates of phosphorus and nitrogen by 1,311.82
kg and 7,047.67 kg, respectively. However, phosphorus output remained
unaffected by tourist consumption behaviors.
While the overall output pathways of phosphorus were unchanged, the
volatilization and leaching of organic fertilizers (derived from tourist
excrement and kitchen waste) led to an increase in nitrogen output, with an
increment of 2,580.61 kg. The imbalance between
Table 2 Main sub-datasets
composition
|
No.
|
Sub-dataset
|
Data composition
|
|
1
|
Underlying data of tourist consumption behaviors and
typical agricultural economic system and calculated coefficient of N and P
|
Underlying data of tourist consumption behaviors and
typical agricultural economic system
Calculation coefficient of N and P
|
|
2
|
The influence of tourist consumption behaviors on P
and N flow in cultivation subprocess
|
The influence of tourist consumption behaviors on P
flow structure in cultivation subprocess
The P flow structure in cultivation subprocess without tourist consumption
behaviors
The influence of tourist consumption behaviors on N flow structure in
cultivation subprocess
The influence of tourist consumption behaviors on N environmental emission in
cultivation subprocess
The N flow structure in cultivation subprocess without tourist consumption
behaviors
The N environmental emission in cultivation subprocess without tourist
consumption behaviors
|
|
3
|
The influence of tourist consumption behaviors on P
and N flow in animal feeding subprocess
|
The influence of tourist consumption behaviors on P
flow structure in animal feeding subprocess
The P flow structure in animal feeding subprocess without tourist consumption
behaviors
The influence of tourist consumption behaviors on N flow structure in animal
feeding subprocess
The N flow structure in animal feeding subprocess without tourist consumption
behaviors
|
|
4
|
The influence of tourist consumption behaviors on P
and N flow in food processing subprocess
|
The influence of tourist consumption behaviors on P
flow structure in food processing subprocess
The P flow structure in food processing subprocess without tourist
consumption behaviors
The influence of tourist consumption behaviors on N flow structure in food
processing subprocess
The N flow structure in food processing subprocess without tourist
consumption behaviors
|
|
5
|
The influence of tourist consumption behaviors on P
and N flow in consumption subprocess
|
The P consumption structure of urban residents
The P consumption structure of rural residents
The P consumption structure of tourists
The influence of tourist consumption behaviors on P flow structure in
consumption subprocess
The P flow structure in consumption subprocess without tourist consumption
behaviors
The N consumption structure of urban residents
The N consumption structure of rural residents
The N consumption structure of tourists
The influence of tourist consumption behaviors on N flow structure in
consumption subprocess
The N flow structure in consumption subprocess without tourist consumption
behaviors
|
|
6
|
The influence of tourist consumption behaviors on P
and N flow in disposal subprocess
|
The influence of tourist consumption behaviors on P
flow structure in disposal subprocess
The P flow structure in disposal subprocess without tourist consumption
behaviors
The influence of tourist consumption behaviors on N flow structure in
disposal subprocess
The influence of tourist consumption behaviors on N environmental emission in
disposal subprocess
The N flow structure in disposal subprocess without tourist consumption
behaviors
The N environmental emission in disposal subprocess without tourist consumption
behaviors
|
|
7
|
The influence of tourist consumption behaviors on P
and N import and export in typical agricultural economic system
|
The influence of tourist consumption behaviors on P
and N import and export in typical agricultural economic system
|
phosphorus
and nitrogen inputs and outputs, driven by tourist consumption behaviors,
resulted in net increases in stock within the cultivation subprocess, amounting
to 1,311.82 kg for phosphorus and 4,467.06 kg for nitrogen.
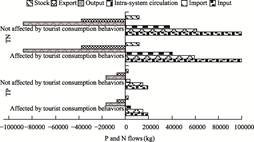
Tourist
consumption behaviors also influenced the input pathways of the animal feeding subprocess,
indirectly altering the balance between imports and intra-system phosphorus and
nitrogen circulation (Figure 3). The recycling of kitchen waste from tourists
as animal feed reduced the need for imported refined feed, decreasing phosphorus
and nitrogen imports by 43.64 kg and 2,269.47 kg, respectively. However,
statistical analysis indicated that tourist consumption had a minimal impact on
phosphorus and nitrogen outputs and stocks in the animal feeding subprocess,
rendering these changes statistically indistinguishable.
|
|
|
|
Figure 2 Influence of
tourist consumption behaviors on phosphorus and nitrogen flow in the
cultivation subprocess
(Positive values indicate inputs and stock
accumulation, while negative values represent outputs)
|
Figure 3 Influence of tourist consumption
behaviors on phosphorus and nitrogen flow in the animal feeding subprocess
(Positive
values indicate inputs and stock accumulation, while negative values
represent outputs)
|
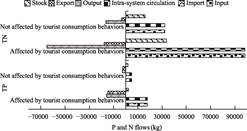
Field investigations revealed that the food processing subprocess
primarily performs preliminary processing of products originating from the cultivation and animal feeding
subprocesses. Consequently, tourist consumption indirectly influenced
phosphorus and nitrogen levels within the food processing subprocess (Figure
4). In the absence of tourist consumption, the food processing subprocess not
only met local residents?? food demands but also produced a surplus for export.
This surplus led to substantial increases in phosphorus and nitrogen levels,
with increments of 6,753.45 kg and 13,197.09 kg, corresponding to growth rates of
1,429.77% and 351.47%, respectively. However, when considering consumption by all ??three
bodies??, the entire food output of the food processing subprocess was
redirected to the consumption subprocess to fulfill local food demand.
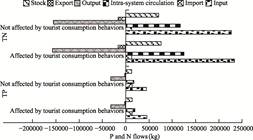
The integration
of tourist consumption into the consumption subprocess has shifted the system
from a ??two bodies?? (urban residents, rural residents) to a ??three bodies?? (urban residents, rural residents, and tourists) consumption
model, leading to considerable increases in phosphorus and nitrogen consumption
and output (Figure 5). The input, output, and export of phosphorus increased by
24,059.28 kg, 20,060.32 kg, and 3,726.98 kg,
respectively, corresponding to growth rates of 121.01%, 115.84%, and 138.52%. However,
phosphorus stock remained unchanged, unaffected by tourist consumption
behaviors. Similarly, nitrogen flows experienced substantial changes due to tourist
consumption, with input increasing by 261,140.33 kg
and output rising by 156,467.56 kg, including a 67,938.78 kg increase in exports. The corresponding growth rates were 141.80%, 137.68%, and 510.73%, respectively. However, nitrogen
stock showed no difference between the ??two bodies?? and
??three bodies?? consumption patterns.
Tourist consumption also heightened the
demand for phosphorus- and nitrogen-rich products such as crops, fruits,
vegetables, meat, and eggs. Despite full utilization of food produced by animal
feeding and food processing subprocesses, total output remains insufficient to
meet the combined needs of residents and tourists. This shortfall necessitates
substantial external imports, resulting in phosphorus and nitrogen import
increases of 795.60% and 213.82%, respectively.
|
|
|
|
Figure
4 Influence of tourist consumption
behaviors on phosphorus and nitrogen flow in the food processing subprocess
(Positive values indicate inputs and stock
accumulation, while negative values represent outputs)
|
Figure
5 Influence of tourist consumption
behaviors on phosphorus and nitrogen flow in the consumption subprocess
(Positive
values indicate inputs and stock accumulation, while negative values
represent outputs)
|
The phosphorus
and nitrogen consumption patterns of the ??three bodies?? are illustrated in
Figure 6. Phosphorus consumption per capita for urban residents, rural
residents, and tourists ranged from 0.86 kg/cap/a to 1.42 kg/cap/a, with
tourists exhibiting the highest consumption and rural residents the lowest. Food
phosphorus intake constituted the dominant form of phosphorus consumption,
accounting for at least 94% of the total, with per capita intake ranging from 0.85 kg/cap/a
to 1.33 kg/cap/a. Vegetable-based foods contributed over 85% of all food
phosphorus intake.
 Similarly, nitrogen
consumption per capita ranged from 8.10 kg/cap/a to 15.37 kg/cap/a, with
tourists consuming nearly twice as much nitrogen as urban and rural residents.
Rural residents had the lowest nitrogen intake, though their consumption levels
were comparable to those of urban residents. Food nitrogen intake accounted for
at least 51% of total nitrogen consumption, with per capita intake ranging from
4.12 kg/cap/a to 7.71 kg/cap/a. Tourists had the highest food nitrogen intake,
nearly double that of urban and rural residents. Vegetable-based foods were the
primary nitrogen source, accounting for 62% of food nitrogen among urban and
rural residents and 82% among tourists.
Similarly, nitrogen
consumption per capita ranged from 8.10 kg/cap/a to 15.37 kg/cap/a, with
tourists consuming nearly twice as much nitrogen as urban and rural residents.
Rural residents had the lowest nitrogen intake, though their consumption levels
were comparable to those of urban residents. Food nitrogen intake accounted for
at least 51% of total nitrogen consumption, with per capita intake ranging from
4.12 kg/cap/a to 7.71 kg/cap/a. Tourists had the highest food nitrogen intake,
nearly double that of urban and rural residents. Vegetable-based foods were the
primary nitrogen source, accounting for 62% of food nitrogen among urban and
rural residents and 82% among tourists.
The disposal
subprocess receives agricultural waste, domestic wastewater, and solid waste
generated by the cultivation, animal feeding, food processing, and consumption
subprocesses. The discharge of domestic sewage and solid waste from tourist
activities has significantly increased the burden on the waste disposal
subprocess (Figure 7). Consequently,
phosphorus input and stock increased by 281.07% and 21.65%, respectively.
Meanwhile, phosphorus emissions surged by 444.36%, with exports rising by
482.32%. Similarly, nitrogen requiring disposal increased by 205.98%, while nitrogen
emissions grew by 297.83%, including a 440.22% rise in exports. Additionally, nitrogen
stock increased by 111.99%.
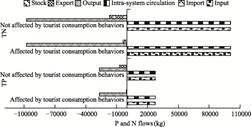
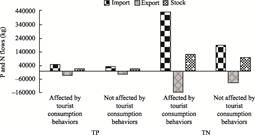
Tourist
consumption of food and industrial products, as well as increased waste
discharge and disposal, has led to a substantial rise in phosphorus and
nitrogen imports and exports within the agricultural system (Figure 8).
Phosphorus imports and exports increased by 17,262.19 kg and 9,232.55 kg, with
growth rates of 55.53% and 42.16%, respectively. Similarly, nitrogen imports and
exports rose by 129.45% and 79.18%, respectively, driven by the combined
effects of urban, rural, and tourist consumption.
|
|
|
|
Figure
7 Influence of tourist consumption
behaviors on phosphorus and nitrogen flows in the disposal subprocess
(Positive values indicate inputs and stock
accumulation, while negative values represent outputs)
|
Figure
8 Influence of tourist consumption
behaviors on phosphorus and nitrogen across typical agricultural systems
(Positive
values indicate inputs and stock accumulation, while negative values
represent outputs)
|
4.3 Data Validation
The
data and coefficients for nitrogen and phosphorus used in this study were
sourced from previous research[1?C11], primarily conducted around 2018
in local or nearby regions such as Yichun City, Xinyu City, and Jiangxi
Province. These studies were carefully selected to minimize the influence of
spatiotemporal variability on the calculated nitrogen and phosphorus fluxes.
However, limited research has examined the effects of tourist consumption
behaviors on phosphorus and nitrogen flows, necessitating further analysis of
the associated uncertainties and characterization parameters. Tourist
consumption behaviors essentially mirrors resident consumption in tourism areas,
exhibiting both similarities and differences compared to consumption patterns
in their place of residence. Based on regional distinctions and duration of
stay, tourists were classified into three categories: overnight international
tourists, overnight domestic tourists, and domestic one-day tourists (excluding
local residents). This classification was used to estimate nitrogen and
phosphorus consumption and output.
Niu[15] and Li et al.[16] categorized tourism
consumption into 6 major components: transportation and postal services,
catering, accommodation, shopping, sightseeing, and entertainment. Although
they used different models to assess environmental impacts, the nitrogen and
phosphorus carriers in tourist consumption??food consumption, industrial product use, energy consumption, and
waste generation??were consistent with our
study. Niu (2007) found that tourists consume substantially more food and
energy than local inhabitants[15]. Similarly, Li et
al. (2019)[17] reported that food
consumption during travel and dining out was approximately 1.7 times higher
than daily household consumption. Zhang et al. (2018)[18], in a study of 159 catering enterprises across Chengdu, Shanghai,
Beijing, and Lhasa, noted that per capita food waste among tourists exceeded
that of local residents. However, an investigation into the Beijing catering
industry found that local inhabitants consumed twice as much food as tourists[19]. In contrast, research in Lhasa showed that tourists had higher
food consumption than residents[20], while a 2011 study
reported the opposite trend[21]. These
discrepancies underscore significant variability in food consumption across
regions and studies, aligning with findings from our questionnaire survey.
Accordingly, the selected value for tourist food consumption in this study is
both scientifically justified and reasonable.
Regarding solid
waste, previous studies reported varying levels of waste generation among
tourists. For example, the solid waste output in the Nanyue Scenic Area was
higher than the values observed in our study[22].
Davenport, J. and Davenport, J. L. found that per capita solid waste generation
among tourists (3.5 kg/d) exceeded our survey results[23].
Additionally, the annual solid waste output per capita from one-day tourists
was 500 g/cap/a[24], which is also higher than our
study??s findings. However, Mateu-Sbert reported an average per-tourist solid
waste yield of 1.31 kg/cap/d, lower than that of local inhabitants (1.48 kg/cap/d)[25].
These variations indicate that the per capita waste generation values in
previous studies were both higher and lower than our findings. Therefore, the
final selected value in this study (0.4504 kg/cap/d) remains reasonable.
Meanwhile, the average consumption of industrial products[26,27] and energy[28] among Chinese residents was useful as a reference for estimating
tourist consumption in our study.
5 Discussion and Conclusion
Using
a material balance approach, this study employed a substance flow analysis
model to examine phosphorus and nitrogen flows within an agricultural system,
explicitly incorporating tourist consumption behaviors??an often overlooked factor in previous research. By integrating
these behaviors into the agricultural system, we quantitatively assessed their
impact on phosphorus and nitrogen fluxes along the supply chain, from food and
industrial product consumption to waste disposal. The study provides new insights
and data to inform mitigation strategies for phosphorus and nitrogen pollution.
An uncertainty analysis comparing our activity-level data and
phosphorus/nitrogen coefficients with previous studies confirmed the high
reliability of our dataset.
Key findings through
the dataset include the following: (1) Tourist consumption behaviors
significantly influence phosphorus and nitrogen flows within the agricultural
system and its subprocesses. Specifically, phosphorus import and export
increased by 55.53% and 42.16%, respectively, due
to tourism. Similarly, nitrogen import and export rose by 129.45% and 79.18%.
(2) Tourist consumption directly introduced new phosphorus and nitrogen
input pathways into cultivation and animal breeding, increasing phosphorus and
nitrogen fluxes in the cultivation subprocess by 2.98% and 3.12%,
respectively. (3) The food processing subprocess was indirectly affected by
tourist consumption, with phosphorus and nitrogen-related exports rising by 1,429.77%
and 351.47%, respectively. (4) The increased demand for food and industrial
products among tourists led to a greater reliance on imports from external
sources. Consequently, the consumption subprocess experienced a sharp rise in
phosphorus and nitrogen imports, increasing by 795.60% and 213.82%, respectively. Waste disposal also escalated proportionally to meet higher
waste discharge demands. (5) According to the Chinese Nutrition Society,
the average adult phosphorus requirement, recommended intake, and tolerable
intake are 0.219 kg/cap/a, 0.263 kg/cap/a, and 1.278 kg/cap/a, respectively[29]. The food phosphorus intake among inhabitants
exceeded the recommended level but remained below the tolerable limit, ensuring
adequate nutrition. In contrast, tourists?? food nitrogen intake slightly
exceeded the tolerable threshold, though their shorter stay duration mitigated
health risks. The per capita food nitrogen intake among both inhabitants and
tourists exceeded the minimum intake for healthy adults (3 kg/cap/a) and was
higher than China??s per capita food consumption (3.6 kg/cap/a). However, it
remained below the 6 kg/cap/a obesity risk threshold, ensuring adequate protein
intake without contributing to obesity[26]. (6) The waste disposal subprocess saw an increase of 281.07% and 205.98% in phosphorus and nitrogen inputs,
respectively, leading to heightened waste emissions. The growth rates for phosphorus and nitrogen discharge were 444.36% and 297.83%, respectively.
Author Contributions
Chen, Q. Q. designed the algorithms
of dataset. Liu, Z. H., Xu, Y. Y., Pang, A. P. and Long, Z. D. contributed to
the data processing and analysis. All authors wrote the data paper.
Conflicts of Interest
The
authors declare no conflicts of interest.
References
[1]
Du, C. L., Ren, X. Y., Du, Z.
J. Research on the reduction of total phosphorus pollution in the Yangtze River
Economic Zone based on substance flow analysis??take Hubei as an example [J]. Chinese
Journal of Environmental Management, 2021, 13(3): 136?C145.
[2]
Xu, Y. X., Wu, X., Lu, R., et
al. Total phosphorus pollution, countermeasures and suggestions of the
Yangtze River Economic Belt [J]. Chinese Journal of Environmental Management,
2018, 10(1): 70?C74.
[3]
Villalba, G., Liu, Y.,
Schroder., H., et al. Global phosphorus
flows in the industrial economy from a production perspective [J]. Journal of Industrial Ecology, 2008,
12(4): 557?C569.
[4]
Liu, Y., Villalba, G., Ayres,
R. U., et al. Global phosphorus flows
and environmental impacts from a consumption perspective [J]. Journal of Industrial Ecology, 2008,
12(2): 229?C247.
[5]
Liu, X., Sheng, H., Jiang, S.
Y., et al. Intensification of
phosphorus cycling in China since the 1600s [J]. Proceedings of the National Academy of Sciences, 2016, 113(10):
2609?C2614.
[6]
Cordell,
D., Drangert, J. O., White, S. The story of phosphorus: global food security
and food for thought [J]. Global Environmental Change, 2009,
19(2): 292?C305.
[7]
Cordell, D., White, S. Peak phosphorus:
clarifying the key issues of a vigorous debate about long-term phosphorus security
[J]. Sustainability, 2011, 3(10): 2027?C2049.
[8]
Chen, M., Graedel, T. E. A
half-century of global phosphorus flows, stocks, production, consumption,
recycling, and environmental impacts [J]. Global
Environmental Change, 2016, 36: 139?C152.
[9]
Ma, L., Velthof, G. L., Wang,
F. H., et al. Nitrogen and phosphorus
use efficiencies and losses in the food chain in China at regional scales in
1980 and 2005 [J]. Science of the Total
Environment, 2012, 434: 51?C61.
[10]
Ma, D. C., Hu, S. Y., Chen, D.
J., et al. Substance flow analysis as
a tool for the elucidation of anthropogenic phosphorus metabolism in China [J].
Journal of Cleaner Production, 2012,
29?C30(5): 188?C198.
[11]
Ma, D. C., Hu, S. Y., Chen, D.
J., et al. Change traits of phosphorous
consumption structure in China and their effects on environmental phosphorous loads
[J]. Environmental Science, 2012, 33(4): 1376?C1382.
[12]
Chen, Q. Q., Pang, A. P., Long,
Z. D., et al. Dataset of nitrogen and phosphorus flow in agricultural system
affected by tourists in Wentang Town of Jiangxi Province of China (2018, 2020) [J/DB/OL].
Digital Journal of Global Change Data Repository, 2025.
https://doi.org/10.3974/geodb.2025.01.03.V1.
[13]
GCdataPR Editorial Office.
GCdataPR data sharing policy [OL]. https://doi.org/10.3974/dp.policy.2014.05
(Updated 2017).
[14]
Economic Statistics Department
of Wentang Town Management Committee. 2018 Rural Economic Statistical Yearbook
of Wentang Town, Yichun City [Z]. Economic Statistics Department of Wentang
Town Management Committee, 2018.
[15]
Niu, Z. H. Model based on
quantitative estimation in scenic spots?? ecological footprint [D]. Zhengzhou:
Henan University, 2007.
[16]
Li, X. H., Shi, C. C., Wang, L.
M., et al. NOx emission measurement and grey correlation analysis of
energy consumption in inbound tourism [J]. Journal of Northwest Normal
University (Natural Science),
2021, 57(3): 104?C111.
[17]
Li, Y. Y., Wang, L. E., Cheng,
S. K., et al. Tourists?? food consumption characteristics and influencing
factors in tourism cities on the plateau: an empirical study of Lhasa [J]. Resources
Science, 2019, 41(3): 494?C508.
[18]
Zhang, P. P., Wang, L. E., Bai,
J. F., et al. The food waste behavior of catering consumers from a
tourism perspective [J]. Resources Science, 2018, 40(6): 1186?C1195.
[19]
Zhang,
D., Cheng, S. K., Gao, L. W., et al. Ecological footprint of catering
industry food waste in Beijing [J]. Resources
Science, 2016, 38(1): 10?C18.
[20]
Wang, L. E., Cheng, S. K.,
Zhong, L. S., et al. Quantitative analysis of catering food consumption
and its resources and environmental cost in tourist city??a case study in Lhasa
[J]. Journal of Natural Resources, 2016, 31(2): 215?C227.
[21]
Wang, L. E., Cheng, S. K., Mu,
S. L., et al. Empirical study on catering food consumption in Lhasa City
[J]. Research on Development, 2012(4): 147?C152. DOI:
10.13483/j.cnki.kfyj.2012.04.025.
[22]
Luo, J. H., Zou, J. P. Based on
ecological footprint component method ecological impact measurement of tourist
waste in Nanyue Scenic Area [J]. New Technology & New Products of China, 2022(7): 126?C129. DOI:
10.13612/j.cnki.cntp.2022.07.045.
[23]
Davenport, J., Davenport, J. L.
The impact of tourism and personal leisure transport on coastal environments: a
review [J]. Estuarine Coastal and Shelf Science, 2006, 67(1/2): 280?C292.
DOI: 10.1016/ S0370-2693(97)00806-X.
[24]
Chen, H., Zhang, C. P., Wen, J.
L., et al. Impact of tourism on Fuxian Lake water environment and its
countermeasures [J]. Journal of Yunnan Agricultural University (Natural
Science), 2014, 29(4): 597?C601.
[25]
Mateu-Sbert, J., Ricci-Cabello,
I., Villalonga-Olives, E., et al. The impact of tourism on municipal
solid waste generation: the case of Menorca Island (Spain) [J]. Waste
Management, 2013, 33(12): 2589?C2593. DOI: 10.1016/j.wasman.2013.08.007.
[26]
Gu, B. J. Nitrogen cycles of
coupled human and natural system??a case study of China [D]. Hangzhou: Zhejiang
University, 2011.
[27]
Office of the Leading Group of
the State Council for the Forth National Economic Census. The Forth Economic
Cersus, China Economic Cersus Yearbook, 2018 [M/OL]. Beijing: China
Statistics Press, Beijing INFO Press, 2020.
https://www.stats.gov.cn/sj/pcsj/jjpc/4jp/indexch.htm.
[28]
National Bureau of Statistics
of China. China Statistics Yearbook, 2020 [M/OL]. Beijing: China
Statistics Press, Beijing INFO Press, 2021. https://www.stats.gov.cn/sj/ndsj/2020/indexch.htm.
[29]
Chinese Nutrition Society.
Dietary Reference Intake for China residents (DRIs), 2023 Edition [M]. Beijing: People??s Medical
Publishing House, 2023.