Surface Water Level Change in the Lower
Reaches of Keriya River (2013?C2014)
Wang, J.1, 2, 3 Zhang, F.1, 2, 3 * Shi, Q. D.1, 2, 3
1. College of
Geography and Remote sensing Sciences, Xinjiang University, Urumqi 830046,
China;
2. Xinjiang
Key Laboratory of Oasis Ecology, Urumqi 830046, China;
3. Key
Laboratory of Smart City and Evironment Modelling of Higher Education
Institute, Urumqi 830046, China
Abstract: Daliyaboyi, in the lower
reaches of the Keriya River, is the largest primitive animal husbandry oasis in
the hinterland of the Taklimakan Desert. The water utilization contradiction is
severe between the oasis ecological irrigation in Daliyaboyi and its upstream
cultivation in Yutian. From August 2013 to March 2014, a water level gauge
developed in this study was set up in Qigekuoyigan in the lower reaches of the
Keriya River, and the dynamic data for the daily water level were recorded. In
Daliyaboyi well No. 1, the groundwater pressure and pressure during the same
period were measured using a HOBO water level gauge, and surface water level
and groundwater depth datasets for the lower reaches of the Keriya River from
2013 to 2014 were obtained. The datasets included the following measurement
data from August 2013 to March 2014: (1) the location of the measurement
points; (2) the daily variations in and the average value of the surface water
level at the Qigekuoyigan observation point; (3) the diurnal variations in and
daily average values of the burial depth of the groundwater; and (4) the daily
variations in the air pressure and water pressure during the groundwater depth
measurements. The unit of the surface water level was cm, and the unit of the
groundwater depth was m. The data formats were .shp and .xls, and the data size
was 267 KB (compressed to one 255 KB file).
Keywords: Keriya River; Daliyaboyi; Yutian; oasis; surface water; water level;
dynamic variations
DOI: https://doi.org/10.3974/geodp.2023.01.03
CSTR: https://cstr.escience.org.cn/CSTR:20146.14.2023.01.03
Dataset Availability Statement:
The dataset supporting this paper
was published and is accessible through the Digital
Journal of Global Change Data Repository at: https://doi.org/10.3974/geodb.2022.01.08.V1
or https://cstr.escience.org.cn/CSTR:20146.11.2022.01.08.V1.
1 Introduction
Daliyaboyi,
in the lower reaches of the Keriya River, is the largest primitive animal husbandry
oasis in the hinterland of the Taklimakan Desert, covering an area of 340 km2,
with more than 1,500 residents grazing animals for a living[1?C4]. Its upstream area is the Yutian modern cultivation oasis, with an
area of 1,716 km2[5].
From Daliyaboyi to Yutian, a desert riparian forest ecosystem has developed
along the banks of the Keriya River, which is mainly composed of Populus euphratica, Tamarix chinensis, Phragmites
communis, and other dominant species, forming a 250 km long green
ecological promenade in the interior of the desert[6]. There is a
prominent contradiction between the ecological water use in the Daliyaboyi
Oasis and the irrigation water use in Yutian. Located in the desert, the
Daliyaboyi oasis and Yutian are both facing severe ecological degradation
problems, such as desertification, and the population-land contradiction is
extremely prominent[7]. This area is a very typical oasis for
ecological security research in the arid region of western China.
In 2013, the Jiyin Reservoir was built in the
mountainous area in the middle reaches of the Keriya River. It has a planned
storage capacity of 0.82 ?? 108 m3, which is close to 1/10 of the
total annual runoff of the Keriya River[8]. The reservoir began to
store water in September 2016. The Keriya River Basin is facing new
exploitation of water and land resources, and the upstream and downstream water
supply is facing adjustments. This poses the following question: what impact
will this have on the ecological environment of the lower reaches of the Keriya
River? The lower reaches of the Keriya River are deep in the desert, and travel
to this region is extremely inconvenient. Early research on Daliyaboyi focused
on investigations and some discontinuous observations, and basic data that can
be used for research, especially the long time series dynamic observation data,
are almost completely lacking. In August 2013, a self-designed photographic
water level observation instrument was set up for the first time in
Qigekuoyigan (37??31??N, 81??23??E). It recorded the dynamic variations in the
water level from August 2013 to March 2014. The data obtained can be used to
study hydrology and oasis ecology in the lower reaches of the Keriya River. In
October 2012, a groundwater observation well was constructed in the hinterland
of the oasis to record the groundwater depth in the hinterland of the
Daliyaboyi oasis[9]. The data obtained can be used to verify the
reliability of the surface water level observations.
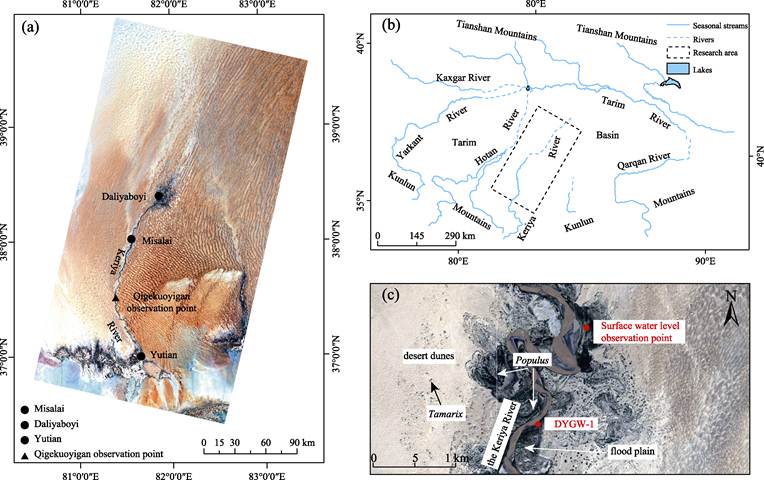
Figure 1 The location of the Qigekuoyigan surface water level
observation point in the lower reaches of the Keriya River
2 Metadata of the Dataset
The In situ dataset of surface and groundwater in lower reaches of
Keriya River (2013?C2014) [10] is summarized in Table 1. It includes the dataset full name, short name,
authors, year of the dataset, data format, data size, data files, data
publisher, and data sharing policy, etc.
Table 1 Metadata summary of the In situ dataset of surface and groundwater in lower reaches of
Keriya River (2013?C2014)
|
Items
|
Description
|
|
Dataset full name
|
In
situ dataset of surface
and groundwater in lower reaches of Keriya River (2013?C2014)
|
|
Dataset short
name
|
KR_QG_SW_2013
|
|
Authors
|
Wang J. ABH-1549-2020,
Key Laboratory of Oasis Ecology (Xinjiang University) Ministry of Education,
1282509830@qq.com
Zhang F.
ABH-1946-2020, Key Laboratory of Oasis Ecology (Xinjiang University) Ministry
of Education, zhang-f-eng@sohu.com
Shi Q. D.
ABH-2101-2020, Key Laboratory of Oasis Ecology (Xinjiang University) Ministry
of Education, shiqd@xju.edu.cn
|
|
Geographical region
|
Qigekuoyigan,
Yutian county, Xinjiang Uygur autonomous region (37??31??N, 81??23??E)
|
|
Year
|
August 3, 2013,
to March 28, 2014
|
|
Data format
|
.xls, .shp
|
|
|
|
Data size
|
267 KB
|
|
|
|
Data files
|
The dataset
consists of two files: (1) location data for the surface water observation
point and the groundwater observation point; (2) daily variations in and
daily mean of the surface water level in Qigekuoyigan (Tab. 1), Raw
groundwater depth observation data (Tab. 2), and daily average groundwater
depth data (Tab. 3)
|
|
Foundation
|
National Natural
Science Foundation of China-Xinjiang United fund (U1178303,
U1503381)
|
|
Data publisher
|
Global Change Research Data Publishing & Repository,
http://www.geodoi.ac.cn
|
|
Address
|
No. 11A, Datun
Road, Chaoyang District, Beijing 100101, China
|
|
Data sharing
policy
|
Data from
the Global Change Research Data Publishing & Repository includes metadata, datasets
(in the Digital Journal of Global Change Data Repository), and
publications (in the Journal of Global Change Data & Discovery). Data sharing policy
includes: (1) Data are openly available and can be free downloaded via the
Internet; (2) End users are encouraged to use Data subject to
citation; (3) Users, who are by definition also value-added service
providers, are welcome to redistribute Data subject to written permission
from the GCdataPR Editorial Office and the issuance of a Data redistribution
license; and (4) If Data are used to compile new
datasets, the ??ten per cent principal?? should be followed such that Data
records utilized should not surpass 10% of the new dataset contents, while
sources should be clearly noted in suitable places in the new dataset [11]
|
|
Communication
and searchable system
|
DOI, CSTR, Crossref, DCI,
CSCD, CNKI, SciEngine, WDS/ISC, GEOSS
|
|
|
|
|
|
|
|
|
3 Methods
3.1 Principle
3.1.1 Surface Water Level
The
scale of the water base-level on the gauge was directly read from the photo.
Then, 197 days of surface-level variation data recorded every 3 hours during
238 days from August 3, 2013, to March 28, 2014, were obtained. For a few days
in winter, the river water was frozen, and the river water level datum during
this period was estimated visually in equal proportion with reference to the
water gauge.
On February 2,
2014, ice gradually formed around the water gauge. From 1:00 on February 21,
2014, to 16:00 on March 1, 2014, the water surrounding the gauge was frozen,
but the surface of the river was not. The diurnal variations in the water level
during this period were visually estimated.
The water gauge
was fully thawed at 19:00 on March 1, 2014, but abrasion made the scale on the
gauge appear fuzzy. The image of the abraded part was estimated in equal
proportion according to the water gauge??s scale, and the variation in the water
level was recorded every 3 hours.
By calculating
the average value of the surface level variations every 3 hours recorded every
day, we obtained the daily average. The photo files for 12 days between August
2013 and March 2014 were lost, leading to missing observation data.
3.1.2 Groundwater Depth
The
formula for calculating the groundwater depth in the monitoring well is as
follows:
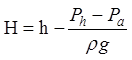 (1)
(1)
where
h is the distance from the HOBO water
level gauge to the ground surface. Ph is the groundwater pressure. Pa is the air pressure. r is
the density. g is the acceleration due to gravity (9.8 N/kg)[9].
The average value of the diurnal variations in the groundwater depth was
obtained from the diurnal variations in the groundwater depth at each time
point[9].
3.2 Technical Routes
An
industrial CCD camera was installed on the bank of the river, and the camera
shutter was connected to a timing flash device to ensure that it could capture
the scale at night (Figure 2a). We also made sure that the water gauge and the
water surface were both in the camera??s view window. We installed the water
gauge on August 3, 2013, and the initial water level scale reading was 10 cm.
The camera started taking pictures at 1:00, and the camera was programmed to
take a picture every 3 h to obtain dynamic surface water level observation data
recorded 8 times a day.
Well No. 1 was
constructed in the hinterland of the Daliyaboyi Oasis and was located 5 m from
the riverbank. The main reason for setting up the observation well here was
that at the location of the observation well, there was no surface water supply
from other sources in the Daliyaboyi Oasis, which controlled the source and
flow of the surface water in the Daliyaboyi oasis. A HOBO groundwater level
meter was placed in the well to ensure that the water level gauge was below the
surface of the shallow groundwater, and it was used to measure water pressure
(Figure 2b). An identical HOBO water level gauge was placed outside the well to
measure the atmospheric pressure[9].
The water level gauge was programmed to collect pressure and temperature data
every 4 h.
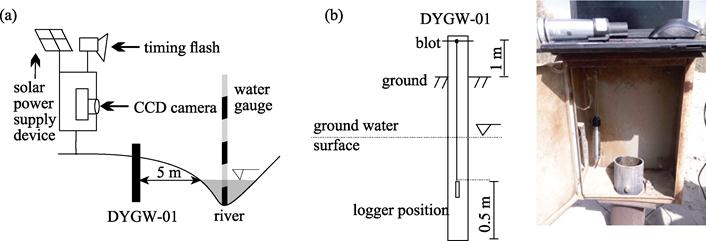
Figure 2 (a) Surface water level observation system and (b) groundwater
level observation system[9]
4 Data Results and Validation
4.1 Data Composition
The
data results include two data files: a dataset file in .xls format and a
location data file in .shp format. The data include (1) location data for the
Qigekuoyigan observation point and Daliyaboyi well No. 1 (.shp); and (2)
surface water level data logged every 3 hours at the Qigekuoyigan observation
point from August 3, 2013, to March 28, 2014, and the average value of the
daily surface water level variations during this period (Tab. 1), raw data for
the observations of the groundwater depth in Daliyaboyi well No. 1 (Tab. 2),
and the average daily variations in the groundwater depth during the study
period (Tab. 3).
4.2 Data Products
The
changes in the surface water level represent the change in the amount of water
flowing from the Keriya River through Yutian to the Daliyaboyi Oasis. From
August 2013 to March 2014, the daily surface water variations in the lower
reaches of the Keriya River were not significant. The lowest water level during
the year was 0 cm in August 2013, and the highest water level reached 142 cm in
February, with a range of 142 cm. There were at least two peaks in summer and winter.
The summer peak was narrow, and it rose and fell rapidly. The winter peak was
wide, and it rose and fell gently. The curve of the mean 8-month diurnal
variation series was generally continuous (Figure 3c). The variation trend of
the groundwater burial depth was relatively consistent with the variation trend
of the surface water level, with two peaks in summer and winter, and the
variation sequence was generally continuous (Figure 3c).
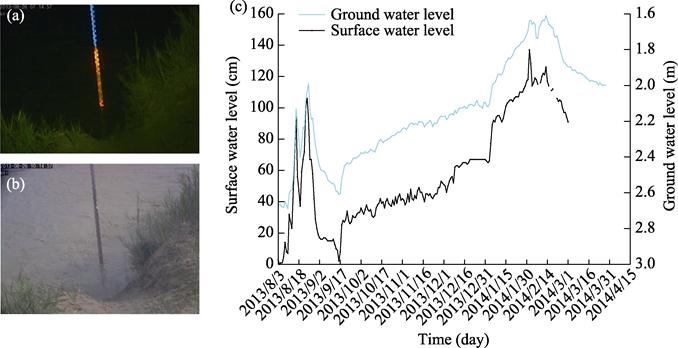
Figure
3 Shooting effect of surface water level observation system:
(a) at night, (b) during the day, and
(c) average diurnal variations in the surface water
level and groundwater depth from August 3, 2013, to March 28, 2014
4.3 Data Validation
Data
spanning 197 days (from August 3, 2013, to February 18, 2014) were obtained
through visual means. The water gauge scale was mostly submerged, which ensured
a reliable determination. There were 29 days of data missing (the 36 days from
February 21, 2014, to March 28, 2014) because the water gauge scale wore out.
Because the distance between the water gauge and the camera remained unchanged
during the shooting period, the shooting parameters also remained unchanged,
and the missing water levels were read out according to the submerged
proportion of the water gauge. Although these data were read from photos, they
were measured proportionally. The date are reliable. The dynamic variations in
the groundwater level during the same period recorded using the HOBO groundwater
level gauge exhibit good consistency (Figure 3c).
5 Discussion and Conclusion
The
dynamic changes in the surface water level recorded at the Qigekuoyigan
observation point suggest that the water quantity changed in the downstream
region of the Keriya River after flowing through Yutian county. Two flood peaks
in winter and summer exhibited clear characteristics. The Keriya River has the
characteristics of a Chinese northwestern river, but the data show that its
summer peak is not significant; this suggests that a portion of the river water
is intercepted in the upstream area. The broad peaks in winter reflect the
upstream water discharge during the slack season, and multiple sources such as
groundwater recharge and snowmelt may be involved. The data indicate that the
fluctuation in the downstream water was due to seasonal changes in the upstream
irrigation. These data also provide a reference for the scientific allocation
of water resources in the upstream and downstream oases where the seeds of
plants such as Populus euphratica and
Salix euphratica germinate under
flood irrigation in summer.
Author Contributions
Wang,
J. contributed to the data analysis and writing. Zhang, F. and Shi, Q. D.
designed the overall dataset development. Zhang, F. designed the photographic water level monitoring device and set it up in the
field.
Conflicts of Interest
The
authors declare no conflicts of interest.
References
[1]
Zhu, Z. D., Lu, J. H., Jiang,
W. Z. Study on formation and development of aeolian landformand trend of environmental
change at lower reach of the Keriya River, Taklimakan Desert [J]. Journal of Desert Research, 1988, 8(2):
1?C10.
[2]
Tian, Y. Z. Tugayi in the delte
the lower reaches of the Keriya River: a natural complex reflecting ecological
degradation [J]. Journal of Desert
Research, 1988, 8(2): 11?C25.
[3]
Zhou, X. J., Li, B. S., Zhu,
F., et al. The research on the
development and evolution of the oasis of Keriya River in the Tarim Basin of
Xinjiang [J]. Yunnan Geographic
Environment Research, 1996, 8(2): 44?C57.
[4]
Yang, X. P. The relationship
between oases evolution and natural as well as human factors??evidences from the
lower reaches of the Kerya River, Southern Xinjiang, China [J]. Earth Science Frontiers, 2001, 8(1):
83?C89.
[5]
Zhou, X. J., Huang, X. J., Chen
F., et al. Formation, evolution and
management of Keliyahe oasis [J]. Journal
of Arid Land Resources and Environment, 1995, 9(3): 65?C73.
[6]
Fan, Z. L., Ji, F. The changes
of natural environment and the green corridor protection in middle-lower
reaches of the Keriya River [J]. Arid
Zone Research, 1989, 6(3): 16?C24.
[7]
Shi, Q. D., Guo, Y. C., Zhou,
X. L., et al. Mechanism of the
influence of surface water and groundwater on vegetation pattern in Daliyaboyi
Oasis at the delta of Keriya River in Taklamakan Desert [J]. Journal of Xinjiang University (Natural Science Edition), 2019, 36(3):
253?C259.
[8]
Liang, W. Analysis and
countermeasures of problems in construction supervision of Jiyin Reservoir in
Xinjiang [J]. Shanxi Water Resources,
2019(4): 175?C176.
[9]
Tang, M., Zhang, F., Shi, Q. D.
Characteristic variations in the groundwater table depth of the Daliyaboyi
oasis, Keriya River, China [J]. Arid Land
Geography, 2021,.44(1): 80-88.
[10]
Wang,
J., Zhang, F., Shi, Q. D. In situ
dataset of surface and groundwater in lower reaches of Keriya River (2013?C2014)
[DB/OL]. Digital Journal of Global Change
Data Repository, 2022. https://doi.org/10.3974/ geodb.2022.01.08.V1.
https://cstr.escience.org.cn/CSTR:20146.11.2022.01.08.V1.
[11]
GCdataPR Editorial Office.
GCdataPR data sharing policy [OL]. https://doi.org/10.3974/dp.policy.2014.05
(Updated 2017).