Development of the Simulation Dataset on Livestock Systems in Four Soums of Northern Mongolia
(2022?C2050)
Xu, Z. R.1* Wang, J. L.1 Zhang, B.2 Davaadorj, D.3 Xian, Y. F.1
1. Institute of Geographic Sciences and Natural Resources
Research, Chinese Academy of Sciences, Beijing 100101, China;
2. Baotou Teachers?? College,
Baotou 014030, China;
3. National University of
Mongolia, Ulaanbaatar 210646, Mongolia
Abstract: Climate change and rapid increase in livestock have
considerably degraded the ecosystem in Northern Mongolia, thereby threatening
regional sustainable development. Based on socio-economic statistics, land
cover data, and Net Primary Productivity (NPP) data from 2015 to 2022, and in
combination with future land cover and NPP data under the SSP-RCP scenarios of
the CMIP6 framework, the author used Vensim DSS to construct a system dynamics
model of the grassland-livestock system in four soums (Tumurbulag,
Khutag-Undur, Zuunburen, and Orkhon) located in the Selenge River Basin in
northern Mongolia. The model projected the dynamics of livestock under 3
socio-economic-climate scenarios: SSP1-RCP2.6, SSP2-RCP4.5, and SSP5-RCP8.5. As
a result, a dataset for the simulated and projected development of grasslands
and livestock in the 4 Soums was obtained, covering the period from 2022 to
2050. The dataset includes: (1) boundaries of the study area and (2) estimated
forage production, carrying capacity, livestock inventory and livestock output
under the 3 socioeconomic?Cclimate scenarios such as SSP1−RCP2.6, SSP2−RCP4.5
and SSP5−RCP8.5. The dataset is archived in the .shp and .xlsx formats and
comprises 9 data files of 142 KB (compressed into one file of
113 KB).
Keywords: forage
production; carrying capacity; livestock inventory; livestock output; Mongolia
DOI: https://doi.org/10.3974/geodp.2025.01.03
Dataset Availability Statement:
The dataset
supporting this paper was published and is accessible through the Digital
Journal of Global Change Data Repository
at: https://doi.org/10.3974/geodb.2024.10.03.V1.
1 Introduction
The Mongolian Plateau,
located at the eastern edge of the Eurasian temperate grasslands, belongs to the temperate
arid and semi-arid ecological fragile zone[1]. Overgrazing and climate
change have increased the area of high ecological risk zones on the Mongolian
Plateau by 30% between 2001 and 2020[2]. Moreover, ecological
degradation[3] and sandstorms have threatened the ecological
security and sustainable development of the country and East Asia[4].
Livestock husbandry has been the traditional pillar industry in Mongolia[5],
and the number of livestock has increased rapidly from 55.98 million in 2015 to
71.12 million in 2022[6].
Grassland overloading occurred in the desert steppe of southwest, central and
northern Mongolia[7].
The Selenga River Basin (SRB) in northern Mongolia
is the upstream area of Lake Baikal, which is the world??s largest freshwater
lake. The basin is predominantly characterised by temperate grasslands and
forests that cover 66% and 29% of its total area, respectively[8]. The SRB is the main pastoral area of Mongolia,
providing more than 60% of its livestock products. However, over the past 30
years, extreme climate events, overgrazing, and population growth have
intensified desertification, threatening regional ecological security and
sustainable development[9]. Herein, four typical Soums in the SRB, including Tumurbulag in the
upstream area, Khutag-Undur in the midstream, Zuunburen along the downstream
mainstream and Orkhon in the downstream tributaries, were studied (Figure 1).
By integrating socioeconomic statistics, spatial data, and field survey data,
future development scenarios of livestock husbandry in these Soums over the
next 30 years were simulated using Vensim DSS. Results provided support for the
coordinated development of livestock husbandry and ecological conservation.
2 Metadata of the Dataset
The metadata of Simulation
dataset of livestock system in four soums in Northern Mongolia (2022?C2050)[10]
is summarized in Table 1. It includes the dataset full name, short name, year
of the dataset, temporal resolution, data format, data size, data files, etc.
3 Methodology
3.1 Data Sources
Statistical data on
livestock inventory, survival of young animals, number of herder households,
average household income and expenditure and forage prices in the four typical
Soums of Tumurbulag, Khutag-Undur, Zuunburen and Orkhon in the SRB of Northern
Mongolia since 2015[6] were collected. Land cover data from 2015 to
2022 were derived from MCD12Q1[12], whereas future land cover[13]
and NPP[14?C16] were referenced from the CMIP6 SSP-RCP dataset.
ANPP/NPP ratio, grass edible ratio (EGR) and supplementary rate were obtained
from field surveys conducted during 2023?C2024, respectively. The system
dynamics process was simulated using Vensim DSS to predict livestock scenarios
over the next 30 years.
3.2 Technical Route
A resilient grassland livestock system has 3 subsystems: primary
production, secondary livestock production and pastoralism. The primary
production subsystem includes variables
Table 1 Metadata summary of Simulation dataset of
livestock system in four soums in Northern Mongolia (2022?C2050)
|
Items
|
Description
|
|
Dataset full name
|
Simulation
dataset of livestock system in four soums in Northern Mongolia (2022?C2050)
|
|
Dataset short name
|
LivestockSoumsMongolia2022?C2050
|
|
Authors
|
Xu, Z. R., Institute of
Geographic Sciences and Natural Resources Research, Chinese Academy of
Sciences, xuzr@igsnrr.ac.cn
Wang, J. L., Institute of
Geographic Sciences and Natural Resources Research, Chinese Academy of
Sciences, wangjl@igsnrr.ac.cn
Zhang, B., Baotou
Teachers?? College, zhangb8010@126.com
Davaadorj, D., National
University of Mongolia, davaadorjd@gmail.com
Xian, Y. F., Institute of
Geographic Sciences and Natural Resources Research, Chinese Academy of
Sciences, a326376678@outlook.com
|
|
Geographical region
|
4 soums in Northern Mongolia
|
|
Year
|
2022?C2050
|
|
Temporal resolution
|
Year
|
|
Data format
|
.shp, .xlsx
|
|
Data size
|
142 KB
|
|
Data files
|
Variables of Tumurbulag,
Khutag-Undur, Zuunburen and Orkhon soums from 2022 to 2050: forage
production, carrying capacity, livestock inventory and livestock output
|
|
Foundations
|
National Natural Science
Foundation of China (32161143025, 42371283); Ministry of Science and
Technology of P. R. China (2022YFE0119200, 2019QZKK0603)
|
|
Computing environment
|
Vensim DSS version10.2.2
|
|
Data publisher
|
Global Change Research
Data Publishing & Repository http://www.geodoi.ac.cn
|
|
Address
|
No. 11A, Datun Road,
Chaoyang District, Beijing 100101, China
|
|
Data sharing policy
|
(1) Data are openly available and can be free
downloaded via the Internet; (2) End users are encouraged to use Data
subject to citation; (3) Users, who are by definition also value-added service providers,
are welcome to redistribute Data subject to written permission from
the GCdataPR Editorial Office and the issuance of a Data
redistribution license; and (4) If Data are used to compile new
datasets, the ??ten percent principal?? should be followed such that Data
records utilized should not surpass 10% of the new dataset contents, while
sources should be clearly noted in suitable places in the new dataset[11]
|
|
Communication and
searchable system
|
DOI, CSTR, Crossref, DCI,
CSCD, CNKI, SciEngine, WDS, GEOSS, PubScholar, CKRSC
|
such as grassland area,
forage production and carrying capacity. The secondary production subsystem
contains variables such as livestock population, newborn numbers and output.
The pastoralism subsystem comprises variables such as the number of herding households,
income, expenditure and supplementary feeding[17]. The causal
relationships among these variables were analysed, and a stock-flow diagram
among variables was constructed using Vensim DSS (Figure 2). These multi-source
data were used for simulating the dynamic processes of grassland livestock
systems. The predictive accuracy of the model was validated using historical
data. The main variable equations are expressed as follows:
Forage
production=NPP??ANPP/NPP ratio??Grass edible ratio??Available grassland area (1)
Carrying capacity=Carrying capacity of grassland+Carrying
capacity via supplement=
(Forage
production+Supplementary feeding)/CONSUME PER sheep unit (SU) (2)
Livestock=INTEG
(Survival of young animals?CLivestock output, Initial value) (3)
Livestock output=Livestock−Carrying capacity (4)
where, the units for each variable
are: Available grassland area, ha; Forage
production, Supplementary feeding, t; Carrying
capacity, sheep unit??SU; Livestock, Survival of
young animals, Livestock output, SU; CONSUME PER sheep unit, t/SU.
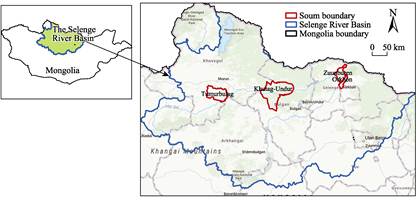
Figure 1 Geo-location map of 4 soums in Northern
Mongolia
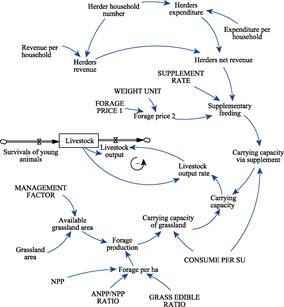
Figure 2 Stock?Cflow diagram of the pastoral system dynamics
model
(Note: the capitalized terms in
the diagram are constants)
4 Data Results and
Validation
4.1 Dataset
Composition
The simulation dataset of
livestock systems in four soums in Northern Mongolia (2022?C2050) contains 4
variables such as forage production, carrying capacity, livestock inventory,
and livestock output from 2022 to 2050 for Tumurbulag, Khutag−Undur, Zuunburen,
and Orkhon.
4.2 Data Results
4.2.1 Forage Production
The IPCC Coupled Model Intercomparison Project
Phase 6 (CMIP6) provides coupled socioeconomic-climate system scenarios (SSP-RCPs)[18]
that integrates future socioeconomic pathways (SSPs)[18] with
representative concentration pathways (RCP)[19]. Among them, SSP1-RCP2.6
(SSP126), SSP2-RCP4.5 (SSP245) and SSP5-RCP8.5 (SSP585) represent the scenarios
of sustainable development, intermediate pathway and economic growth priority,
respectively[20]. From 2022 to 2050, the annual forage production of
grasslands in Tumurbulag, Khutag-Undur, Zuunburen
and Orkhon fluctuates under various scenarios. The greatest fluctuations in
forage production are observed under SSP5-RCP8.5, whereas SSP1-RCP2.6 and SSP2-RCP4.5
shows relatively low inter-annual fluctuations in forage production and high
system stability (Figure 3 and Table 2), which are more rational scenarios.
Over the next 30 years, the average annual forage production under SSP1-RCP2.6
in Tumurbulag and Khutag-Undur is projected to be 190,260 ?? 61,785 t and
458,577 ?? 95,749 t, respectively, and that in Zuunburen and Orkhon under
SSP2-RCP4.5 scenario are 93,400 ??
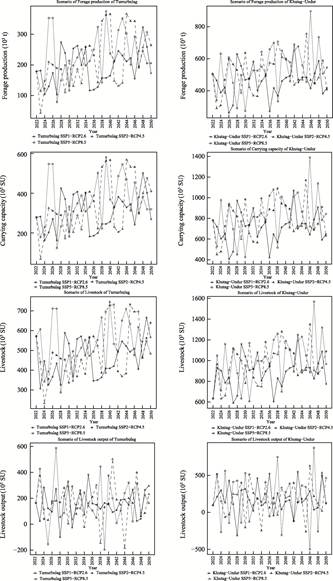
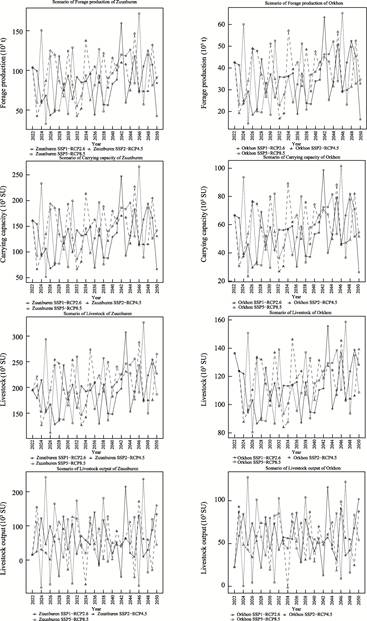
Figure 3 Forage production, carrying capacity,
livestock inventory and livestock output in 4 soums of Northern Mongolia
(2022?C2050)
27,899 t and 37,578??11,173 t,
respectively. Under SSP1−RCP2.6 or SSP2-RCP4.5, forage production across all
Soums increases, but the growth rate decreases from upstream to downstream. The
average annual forage production increases by 2,420 t, 1,560 t, 570 t and 200 t for Tumurbulag,
Khutag-Undur, Zuunburen and Orkhon, respectively.
4.2.2
Livestock Inventory
Livestock inventory increases with fluctuations
under different scenarios during 2022?C2050. The average annual livestock
inventories in Tumurbulag and Khutag-Undur for the next 30 years under SSP1-RCP2.6
are 464,989??97,400 SU and 886,259??155,052 SU and those in Zuunburen
and Orkhon are 205,509??43,018 SU and 117,018??17,589 SU under SSP2- RCP4.5,
respectively (Table 2). Under future rational scenarios, the average annual
livestock population in Tumurbulag, Khutag-Undur, Zuunburen and Orkhon are projected
to increase by 4,100 SU, 4,900 SU, 1,060 SU and 220 SU,
respectively.
4.2.3
Livestock Output
Livestock output varies
with years under different scenarios during 2022?C2050 (Figure 3). Over the next 30 years, the average annual
livestock outputs in Tumurbulag and Khutag-Undur are projected to be 169,373??122,082
SU and 191,782??195,890 SU under SSP1-RCP2.6 and those in Zuunburen and Orkhon
are 59,738??63,366 SU and 56,427??26,318 SU under SSP2−RCP4.5, respectively
(Table 2).
4.2.4 Carrying
Capacity
Considering both forage from
natural grassland and supplementary feeding, carrying capacity slightly
increases from 2022 to 2050 (Figure 3).
In the next 30 years, the annual carrying capacities for Tumurbulag and Khutag-Undur
under SSP1−RCP2.6 are 296,133??95,348 SU and 710,306??147,760 SU, and for Zuunburen and Orkhon are
145,127??43,057 SU and 58,953?? 17,243 SU under SSP2-RCP4.5, respectively. In
future rational scenarios, the average annual carrying capacities for
Tumurbulag, Khutag-Undur, Zuunburen and Orkhon will increase by 1,820, 2,650,
110 and 10 SU, respectively (Table 2). The steady increase in future carrying capacity
is primarily because the simulation system is a dynamic self-regulating system
based on grass-livestock balance. Moreover, future climate change, variations
in primary productivity, and improvements in supplementary feeding considerably
influence the carrying capacity.
Table 2 Productivity,
stability and sustainability of 4 soums in Mongolia from 2022 to 2050
|
Variable
|
Scenarios
|
Tumurbulag
|
Khutag-Undur
|
|
Mean
|
StDev
|
MV
|
SV
|
TV
|
Mean
|
StDev
|
MV
|
SV
|
TV
|
|
Forage production (t)
|
SSP126
|
190,260
|
61,785
|
−1
|
1
|
0
|
458,577
|
95,749
|
−1
|
1
|
0
|
|
SSP245
|
219,591
|
89,172
|
0
|
−1
|
−1
|
508,202
|
113,803
|
0
|
0
|
0
|
|
SSP585
|
232,255
|
78,684
|
1
|
0
|
1
|
533,437
|
139,112
|
1
|
−1
|
0
|
|
Carrying capacity (SU)
|
SSP126
|
296,133
|
95,348
|
−1
|
1
|
0
|
710,306
|
147,760
|
−1
|
1
|
0
|
|
SSP245
|
341,398
|
137,610
|
0
|
−1
|
−1
|
786,889
|
175,621
|
0
|
0
|
0
|
|
SSP585
|
360,941
|
121,426
|
1
|
0
|
1
|
825,832
|
214,680
|
1
|
−1
|
0
|
|
Livestock inventory (SU)
|
SSP126
|
464,989
|
97,400
|
−1
|
1
|
0
|
886,259
|
155,052
|
−1
|
1
|
0
|
|
SSP245
|
505,415
|
137,582
|
0
|
−1
|
−1
|
963,438
|
184,251
|
0
|
0
|
0
|
|
SSP585
|
528,047
|
121,461
|
1
|
0
|
1
|
995,015
|
225,605
|
1
|
−1
|
0
|
|
Livestock output (SU)
|
SSP126
|
169,373
|
122,082
|
1
|
1
|
2
|
191,782
|
195,890
|
1
|
1
|
2
|
|
SSP245
|
159,574
|
147,885
|
−1
|
0
|
−1
|
184,978
|
225,530
|
−1
|
0
|
−1
|
|
SSP585
|
165,001
|
169,971
|
0
|
−1
|
−1
|
189,844
|
334,522
|
0
|
−1
|
−1
|
|
Livestock output rate
|
SSP126
|
0.343,1
|
0.233,7
|
1
|
1
|
2
|
0.194,0
|
0.208,5
|
1
|
1
|
2
|
|
SSP245
|
0.295,5
|
0.288,1
|
0
|
−1
|
−1
|
0.170,6
|
0.221,5
|
0
|
0
|
0
|
|
SSP585
|
0.278,5
|
0.286,3
|
−1
|
0
|
−1
|
0.138,5
|
0.324,6
|
−1
|
−1
|
−2
|
|
Sustainability scores
|
SSP126
|
|
|
−1
|
5
|
4
|
|
|
−1
|
5
|
4
|
|
SSP245
|
|
|
−1
|
−4
|
−5
|
|
|
−1
|
0
|
−1
|
|
SSP585
|
|
|
2
|
−1
|
1
|
|
|
2
|
−5
|
−3
|
(To be continued on the next page)
(Continued)
|
Variable
|
Scenarios
|
Zuunburen
|
Orkhon
|
|
Mean
|
StDev
|
MV
|
SV
|
TV
|
Mean
|
StDev
|
MV
|
SV
|
TV
|
|
Forage production (t)
|
SSP126
|
82,712
|
27,552
|
−1
|
1
|
0
|
34,090
|
11,097
|
−1
|
1
|
0
|
|
SSP245
|
93,400
|
27,899
|
1
|
0
|
1
|
37,578
|
11,173
|
1
|
0
|
1
|
|
SSP585
|
89,911
|
34,513
|
0
|
−1
|
−1
|
36,210
|
13,532
|
0
|
−1
|
−1
|
|
Carrying capacity (SU)
|
SSP126
|
128,638
|
42,528
|
−1
|
1
|
0
|
53,570
|
17,124
|
−1
|
1
|
0
|
|
SSP245
|
145,127
|
43,057
|
1
|
0
|
1
|
58,953
|
17,243
|
1
|
0
|
1
|
|
SSP585
|
139,732
|
53,253
|
0
|
−1
|
−1
|
56,843
|
20,883
|
0
|
−1
|
−1
|
|
Livestock inventory (SU)
|
SSP126
|
191,230
|
40,808
|
−1
|
1
|
0
|
112,505
|
16,925
|
−1
|
1
|
0
|
|
SSP245
|
205,509
|
43,018
|
1
|
0
|
1
|
117,018
|
17,589
|
1
|
0
|
1
|
|
SSP585
|
199,733
|
53,265
|
0
|
−1
|
−1
|
114,804
|
21,286
|
0
|
−1
|
−1
|
|
Livestock output (SU)
|
SSP126
|
64,681
|
62,781
|
1
|
1
|
2
|
58,394
|
24,053
|
1
|
1
|
2
|
|
SSP245
|
59,738
|
63,366
|
−1
|
0
|
−1
|
56,427
|
26,318
|
−1
|
0
|
−1
|
|
SSP585
|
62,308
|
88,827
|
0
|
−1
|
−1
|
57,407
|
34,821
|
0
|
−1
|
−1
|
|
Livestock output rate
|
SSP126
|
0.301,3
|
0.276,4
|
1
|
1
|
2
|
0.511,9
|
0.166,1
|
1
|
1
|
2
|
|
SSP245
|
0.257,6
|
0.290,5
|
0
|
0
|
0
|
0.474,3
|
0.191,1
|
0
|
0
|
0
|
|
SSP585
|
0.232,2
|
0.403,1
|
−1
|
−1
|
−2
|
0.474,2
|
0.238,8
|
−1
|
−1
|
−2
|
|
Sustainability scores
|
SSP126
|
|
|
−1
|
5
|
4
|
|
|
−1
|
5
|
4
|
|
SSP245
|
|
|
2
|
0
|
2
|
|
|
2
|
0
|
2
|
|
SSP585
|
|
|
−1
|
−5
|
−6
|
|
|
−1
|
−5
|
−6
|
Table 3 Environmental and economic performance of pastoral
systems during the historical and projected periods (2015?C2050)
|
Soums
|
Period
|
Forage (kg/ha)
|
Carrying capacity (SU)
|
Livestock inventory (SU)
|
Stocking rate
|
Livestock output (SU)
|
Livestock output rate
|
|
Tumurbulag
|
2015?C2022
|
880
|
339,773
|
495,822
|
1.46
|
155,993
|
0.31
|
|
2022?C2050
|
764
|
300,824
|
464,989
|
1.55
|
169,373
|
0.36
|
|
Khutag-Undur
|
2015?C2022
|
935
|
768,670
|
560,087
|
0.73
|
110,293
|
0.20
|
|
2022?C2050
|
868
|
710,306
|
886,259
|
1.25
|
191,782
|
0.22
|
|
Zuunburen
|
2015?C2022
|
868
|
155,231
|
166,225
|
1.07
|
37,288
|
0.22
|
|
2022?C2050
|
800
|
145,127
|
205,509
|
1.42
|
59,738
|
0.29
|
|
Orkhon
|
2015?C2022
|
920
|
63,494
|
117,215
|
1.85
|
36,134
|
0.31
|
|
2022?C2050
|
832
|
58,953
|
117,018
|
1.98
|
56,427
|
0.48
|
4.3 Data Validation
Using livestock inventory as the validation
metric, a comparative analysis was conducted between the estimated values of
the model for 2015?C2022 and the historical statistical values (Table 3). The
analysis revealed strong agreement between the estimated and statistical trends
(Figure 4). Moreover, the Pearson correlation coefficient between the forecast
and statistical livestock numbers ranges from 0.11 to 0.62. With the exception
of Khutag-Undur, no significant difference (?? = 0.05) was observed between the
estimated and statistical livestock numbers for most Soums (Table 4). This
indicates that the predictive accuracy was acceptable on the medium and long-term
time scales.
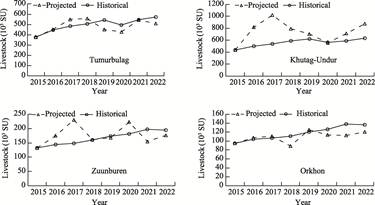
Figure 4 Comparison of the estimated and
statistical values of livestock inventory (2015?C2022)
Table 4 Mean difference t-test between the forecast and statistical livestock
numbers
|
|
Tumurbulag
|
Khutag-Undur
|
Zuunburen
|
Orkhon
|
|
(Predicted − Historical value)/
Historical value
|
−2.3%
|
32.2%
|
6.7%
|
−6.9%
|
|
Pearson correlation coefficient
|
0.615,8
|
0.419,0
|
0.105,1
|
0.621,6
|
|
T ?? t (two-tailed)
|
0.578,8
|
0.018,5
|
0.442,1
|
0.111,5
|
5 Discussion and
Conclusion
The simulation data of livestock system in four soums
in Northern Mongolia (2022?C2050) shows the future pathways of forage
production, carrying capacity, livestock inventory and livestock output in each
soums under three scenarios: SSP1-RCP2.6 (sustainable development), SSP2-RCP4.5
(intermediate pathway) and SSP5-RCP8.5 (economic growth priority). Compared
with historical data, future rational scenarios reveals decreased forage production
of 13.2%, 7.2%, 7.8% and 9.6%, as well as decreased carrying capacity of 11.5%,
7.4%, 6.5% and 7.2% for Tumurbulag, Khutag-Undur, Zuunburen and Orkhon,
respectively, in the SRB. However, the livestock inventory in the basin is
projected to increase by 1/4, thereby increasing the stocking rates across the
SRB as well as the pressure on the grassland while threatening the security of
grassland ecosystems.
Based on the historical status of grassland, livestock and pastoralists
in typical Soums of Northern Mongolia from 2015?C2022, the dataset integrated
statistical data, spatial data and field survey data. Then, a system dynamics
model of the livestock system was developed. It interfaced the natural
ecological subsystem with the socioeconomic subsystem and linked the history
and current situation to predict the future scenarios of key variables of the
livestock system in 2022?C2050. These predictions can provide reliable
methodological and data support for the synergistic management of livestock and
the environment.
Author Contributions
Wang,
J. L. did the overall design of the dataset development; Xu, Z. R. designed the
algorithms of dataset; Davaasuren, D. collected the field survey data; Zhang, B.
performed data validation; and Xian, Y. F. wrote the data paper.
Conflicts of Interest
The
authors declare no conflicts of interest.
References
[1]
Joly, F., Sabatier, R., Hubert,
B. Modelling interacting plant and livestock renewal dynamics helps disentangle
equilibrium and nonequilibrium aspects in a Mongolian pastoral system [J]. Science
of the Total Environment, 2018, 625: 1390‒1404.
[2]
Guo, J. P., Shen, B. B., Li, H.
X., et al. Past dynamics and future prediction of the impacts of land
use cover change and climate change on landscape ecological risk across the
Mongolian Plateau [J]. Journal of Environmental Management, 2024, 355:
120365.
[3]
Zhang, Y. Z., Wang, Q., Wang,
Z. Q., et al. Impact of human activities and climate change on the
grassland dynamics under different regime policies in the Mongolian Plateau
[J]. Science of the Total Environment, 2020, 698: 134304.
[4]
Cai, Q. Y., Chen, W., Chen, S.
F., et al. Recent pronounced warming on the Mongolian Plateau boosted by
internal climate variability [J]. Nature Geoscience, 2024, 17(3): 1‒8.
[5]
Tang,
H. P., Chen, J., Fang, F. Grassland resource management system of main countries
in the world and the enlightenments to our country [J]. Land and Resources Information, 2014(10): 9‒17.
[6]
National Statistics Office of
Mongolia. Mongolian Statistical Information Service [M]. Ulaanbaatar, 2024.
[7]
Mclaughlin, K. Exploding demand
for cashmere wool is ruining Mongolia??s grasslands [J]. Science, 2019.
https://www.science.org/content/article/exploding-demand-cashmere-wool-ruining-mongolia-s-grasslands.
[8]
Wang, J. L., Wei, H. S., Cheng,
K., et al. Updatable dataset revealing decade changes in land cover
types in Mongolia [J]. Geoscience Data Journal, 2022, 9(2): 341‒354.
[9]
Xu, S. X., Wang, J. L.,
Altansukh, O., et al. Spatial-temporal pattern of desertification in the
Selenge River Basin of Mongolia from 1990 to 2020 [J]. Frontiers in
Environmental Science, 2023(11): 1125583.
[10]
Xu,
Z. R., Wang, J. L., Zhang, B., et al.
Simulation dataset of livestock system in four soums in Northern Mongolia
(2022?C2050) [J/DB/OL]. Digital
Journal of Global Change Data Repository, 2024.
https://doi.org/10.3974/geodb.2024.10.03.V1.
[11]
GCdataPR
Editorial Office. GCdataPR data sharing policy [OL].
https://doi.org/10.3974/dp.policy.2014.05 (Updated 2017).
[12]
Friedl, M., Sulla Menashe, D.
MCD12Q1 MODIS/Terra+Aqua Land Cover Type Yearly L3 Global 500 m SIN Grid V006
[M]. Washington: NASA EOSDIS Land Processes Distributed Active Archive Center,
2019.
[13]
Hou, H. Y., Zhou, B. B., Pei,
F. S., et al. Future land use/land cover change has nontrivial and
potentially dominant impact on global gross primary productivity [J]. Earth??s
Future, 2022, 10(9): e2021EF002628.
[14]
Xin, X. G., Wu, T. W., Shi, X. L., et al. BCC BCC-CSM2MR model output prepared for CMIP6 ScenarioMIP
ssp245 [DB/OL]. World Data Center for Climate (WDCC) at DKRZ, 2019.
https://doi.org/10.22033/ESGF/CMIP6.3030.
[15]
Xin, X. G., Wu, T. W., Shi, X. L., et al. BCC BCC-CSM2MR model output
prepared for CMIP6 ScenarioMIP ssp585 [DB/OL]. Earth
System Grid Federation, 2019. https://doi.org/10.22033/ESGF/CMIP6.3050.
[16]
Xin,
X. G., Wu, T. W., Shi, X. L., et al.
BCC BCC-CSM2MR model output prepared for CMIP6 ScenarioMIP
ssp126 [DB/OL]. Earth System Grid Federation, 2019.
https://doi.org/10.22033/ESGF/CMIP6.3028.
[17]
Robinson, S., Petrick, M. Land
access and feeding strategies in post-Soviet livestock husbandry: evidence from
a rangeland system in Kazakhstan [J]. Agricultural
Systems, 2024, 219: 104011.
[18]
van Vuuren, D. P., Carter, T.
R. Climate and socio-economic scenarios for climate change research and assessment:
reconciling the new with the old [J]. Climatic
Change, 2014, 122(3): 415‒429.
[19]
van Vuuren, D. P., Edmonds, J.,
Kainuma, M., et al. The
representative concentration pathways: an overview [J]. Climatic Change, 2011, 109(1/2): 5‒31.
[20]
O??neill, B. C., Tebaldi, C., van Vuuren,
D. P., et al. The scenario model intercomparison
project (ScenarioMIP) for CMIP6 [J]. Geoscientific
Model Development, 2016, 9(9): 3461‒3482.