Quadrennial Series Dataset of Coastal Aquaculture
Distribution of China Based on Landsat Images (1990?C2022)
Yin, Y. M.1 Zhang, Y. H.1* Hu, Z. W.1 Xu, Y.2 Wang, J. Z.3 Wang, C.4 Shi, T. Z.1 Wu, G. F.1
1. MNR Key Laboratory for Geo-Environmental Monitoring of
Great Bay Area, Shenzhen University, Shenzhen 518060, China;
2. College of Urban and Environmental Sciences, Central
China Normal University, Wuhan 430079, China;
3. School of Artificial Intelligence, Shenzhen Polytechnic,
Shenzhen 518055, China;
4. Satellite Application Center for Ecology and
Environment, Ministry of Ecology and Environment of P. R. China, Beijing
100094, China
Abstract: Coastal aquaculture is a significant part of the economy in
China??s coastal regions; however, it raises ecological and environmental
concerns. In this study, the Google Earth Engine (GEE) cloud
computing platform was utilized to apply a multi-feature method to extract
coastal aquaculture areas using a long time series of dense remote sensing
images from 1990 to 2022. A spatial distribution dataset of coastal aquaculture
areas was acquired. The dataset covered the coastal region of China from 1990
to 2022, providing a spatial resolution of 30 m and a temporal resolution of
four years. The collection consisted of 99 files,
totaling 43.4 GB of data. The entire dataset was compressed into a single file
of only 75.6
MB.
Keywords: China; aquaculture
area; Landsat images; long time series
DOI: https://doi.org/10.3974/geodp.2023.02.10
CSTR: https://cstr.escience.org.cn/CSTR:20146.14. 2023.02.10
Dataset Availability Statement:
The dataset
supporting this paper was published and is accessible through the Digital Journal of
Global Change Data
Repository at: https://doi.org/10.3974/geodb.2023.09.01.V1 or https://cstr.escience.org.cn/CSTR:20146.11.2023.09.01.V1.
1
Introduction
Coastal
aquaculture, including land aquaculture ponds and marine aquaculture zones, is
an economic pillar in China??s coastal regions. In addition, it provides a
significant amount of food and is essential for improving human nutrition. The
Food and Agriculture Organization of the United Nations reported that the
contribution of aquaculture to fish production worldwide significantly
increased from 25.7% in 2000 to 46.0% in 2018[1,2]. However, the
rapid expansion of aquaculture has led to various challenges that threaten
sustainable development. These issues include the occurrence of red tides,
eutrophication of seawater, degradation of wetland resources, and excessive and
unjustifiable utilization of water resources[3,4]. Timely access
to dependable information regarding the spatial distribution and patterns of
aquaculture is of paramount importance to ensure the scientific management of
coastal zones and promote sustainable growth of the aquaculture industry.
Remote sensing technology offers several advantages over conventional field
surveys and statistical approaches. For example, it provides a wide detection
range, allowing for the observation of large areas. Additionally, it has a
rapid acquisition period, enabling data collection within a short timeframe.
Furthermore, remote sensing allows for continuous and dynamic observations,
thereby facilitating the monitoring of changes over time. Hence, remote sensing
technology is an efficient approach for dynamic monitoring of aquaculture
regions[5,6]. Optical imagery offers rich spectral information and broad spatial
coverage and has been widely employed to map coastal aquaculture activities[7].
Moreover, remote sensing data provide a long-term historical perspective,
allowing the analysis of dynamic changes in aquaculture[8].
Landsat data, which have provided optical remote sensing data since 1984, are
particularly valuable for observing dynamic changes in coastal aquaculture. To
facilitate the processing of massive and intensive long time-series data, the
Google Earth Engine (GEE) platform offers a wealth of remote sensing data along
with powerful algorithms and computational capabilities. This study aims to
generate a long-term series dataset of land aquaculture ponds and marine
aquaculture zones in China from 1990 to 2022 using the GEE platform. This
dataset will not only serve as a fundamental resource for policy development
and implementation but will also provide a theoretical framework for assessing
sustainable development in the aquaculture sector.
2 Metadata of the Dataset
The dataset of the Quadrennial
series dataset of coastal aquaculture distribution of China based on Landsat
images (1990-2022)[9] is summarized in
Table 1.
Table 1 Metadata summary of the Quadrennial
series dataset of coastal aquaculture distribution of China based on Landsat
images (1990-2022)
|
Items
|
Description
|
|
Dataset full name
|
Quadrennial
series dataset of coastal aquaculture distribution of China based on Landsat
images (1990-2022)
|
|
Dataset short
name
|
CAP_MA_China_1990_2022
|
|
Authors
|
Yin, Y. M.
AAC-1460-2022, MNR Key Laboratory for Geo-Environmental Monitoring of Great
Bay Area, Shenzhen University, yinyumeng2021@email.szu.edu.cn
Zhang, Y. H.
GYR-3820-2022, MNR Key Laboratory for Geo-Environmental Monitoring of Great
Bay Area, Shenzhen University, zyhui@szu.edu.cn
Hu, Z. W.
AAX-7567-2021, MNR Key Laboratory for Geo-Environmental Monitoring of Great
Bay Area, Shenzhen University, zwhoo@szu.edu.cn
|
(To be continued on the next page)
(Continued)
|
Items
|
Description
|
|
Authors
|
Xu, Y.
AAX-7694-2021, College of Urban and Environmental Sciences, Central China
Normal University, xuyue2022010474@mails.ccnu.edu.cn
Wang, J. Z.
Q-4555-2019, School of Artificial Intelligence, Shenzhen Polytechnic, jzwang@szpt.edu.cn
Wang, C.
AAX-7615-2021, Satellite Application Center for Ecology and Environment??Ministry of
Ecology and Environment of P. R. China, wangchen_ch@163.com
Shi, T. Z.
GBX-5637-2022, MNR Key Laboratory for Geo-Environmental Monitoring of Great Bay
Area, Shenzhen University, tiezhushi@szu.edu.cn
Wu, G. F.
B-8735-2018, MNR Key Laboratory for Geo-Environmental Monitoring of Great Bay
Area, Shenzhen University, guofeng.wu@szu.edu.cn
|
|
Geographical
region
|
Coastal zones of
China
|
|
Year
|
1990?C2022
|
|
Temporal
resolution
|
4 years
|
|
Spatial
resolution
|
30 m
|
|
Data format
|
.tif
|
|
|
|
Data size
|
75.6 MB
(compressed)
|
|
|
|
Data files
|
Four-yearly
coastal aquaculture maps 1990?C2022 (18 in total), including coastal land
aquaculture ponds (9) and marine aquaculture zones (9). The naming convention
for coastal land aquaculture ponds is CAP_China_year and for marine
aquaculture zones is MA_China_year, where the last four digits are the year
|
|
Foundations
|
Science,
Technology and Innovation Commission of Shenzhen Municipality
(JCYJ2022082018101617037);
National Natural Science Foundation of China (42201347)
|
|
Data publisher
|
Global Change Research Data Publishing & Repository,
http://www.geodoi.ac.cn
|
|
Address
|
No. 11A, Datun
Road, Chaoyang District, Beijing 100101, China
|
|
Data sharing policy
|
Data from the Global
Change Research Data Publishing & Repository includes metadata, datasets (in the Digital Journal of Global Change Data Repository), and
publications (in the Journal of Global Change Data & Discovery). Data sharing policy includes: (1) Data are openly
available and can be free downloaded via the Internet; (2) End users are
encouraged to use Data subject to citation; (3) Users, who are by definition
also value-added service providers, are welcome to redistribute Data
subject to written permission from the GCdataPR Editorial Office and the
issuance of a Data redistribution license; and (4) If Data are used to
compile new datasets, the ??ten percent principal?? should be followed such
that Data records utilized should not surpass 10% of the new
dataset contents, while sources should be clearly noted in suitable places in
the new dataset[10]
|
|
Communication and searchable system
|
DOI, CSTR, Crossref, DCI, CSCD, CNKI,
SciEngine, WDS/ISC, GEOSS
|
3 Data Processing
The dataset was
produced based on Landsat 5 and Landsat 8 imagery provided by the GEE from 1990
to 2022. The coastal aquaculture sample sites were manually collected using
Google image data.
The spectral, textural, and solar geometric
features of land aquaculture ponds and marine aquaculture zones were analyzed,
and key features were selected for classification. Supervised classification
based on the random forest algorithm was implemented using the GEE platform.
Finally, yearly data were obtained by synthesizing each classification result
in a year using multiple algorithms.
3.1 Study Area
Coastal aquaculture
is extensively distributed across coastal zones. The coastal zone of China
between the estuary of the Yalu River in the north and the estuary of the
Beilun River in the south (18.2??N?C40.5??N) was selected as the study area. The
study area covers 14 provinces, from north to south: Liaoning, Hebei, Tianjin,
Shandong, Jiangsu, Shanghai, Zhejiang, Fujian, Taiwan, Guangdong, Hong Kong,
Macao, Guangxi, and Hainan.
Offshore and onshore areas are defined as
the zone between a 20-km buffer line landward and seaward from the coastline,
which can cover all coastal aquaculture areas, based on a series of field
surveys and visual interpretation of the latest Google Earth images.
3.2 Algorithms
(1) Otsu method
The Otsu method[11] was
employed to automatically distinguish between waterbodies and non-water areas.
This method sets the threshold value as the maximum ratio of the interclass
variance to the intraclass variance. Subsequently, the pixels with water body
index values lower or higher than the determined threshold were classified as
non-water or water, respectively. This process ultimately enables the
extraction of water bodies.
(2) Random forest
algorithm
Features were first selected based on a random
forest algorithm according to their importance. Each feature value was
transformed into a random number that was used to calculate the impact of the
parameter on the accuracy of the model. Multiple calculations were performed,
resulting in an average decrease in the accuracy value, which was used to rank
features based on their importance. Subsequently, the aquaculture extraction
model was trained using a random forest algorithm. In this classification
algorithm, decision trees serve as the fundamental building blocks. For each
input sample, N trees were used to generate N classification results. The
random forest classifier analyses all classification voting results to
determine the category with the highest number of votes, which becomes the
final output category for the sample data[12]. The output of
the random forest method is affected by two crucial factors: the number of
decision trees that constitute the random forest algorithm and the number of
features employed in each decision tree.
(3) Plural
synthesis
The concept of plurality is used in the
classification process because of its association with the most frequent data
values in the dataset[13]. This approach reduces the risk of misclassifying a diverse range
of extractions. Plurality is advantageous because it is a straightforward
method that is not affected by extreme data values[14].
3.3 Technical Routes
Figure 1
illustrates the technological process employed to generate the long-term
coastal aquaculture dataset using the GEE platform for 1990 to 2022. Aquaculture was first extracted based on each clear image in the
year and the extraction results were synthesized using the plural method to
generate the annual results. For each image, the following four steps were
followed: (1) each image was pre-processed and spectral, texture, topographic,
and solar geometry features were extracted; (2) the Modified Normalized
Difference Waterbody Index (MNDWI) was used to automatically extract water body
areas, including coastal aquaculture; (3) samples were chosen from
high-resolution Google Earth images; and (4) feature selection was performed on
the extracted features and the top features were selected for random forest
classification to obtain the classification results of each image.
An accuracy evaluation was conducted using
high-resolution Google Earth images to verify the accuracy of the data.
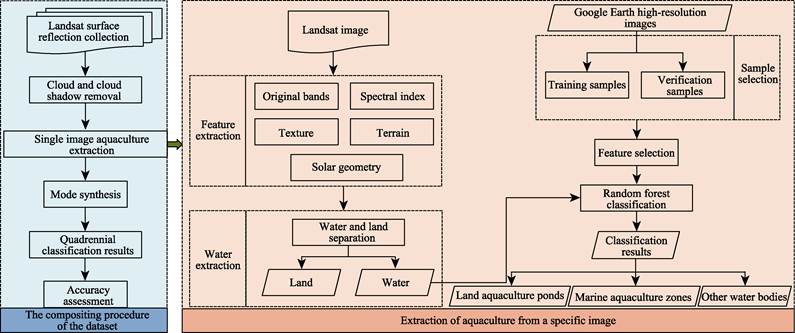
Figure 1 Datasets development flowchart of
classification algorithm.
(1) Data pre-processing and feature
extraction
This study employed Landsat surface reflectance
data obtained from the GEE. Landsat 5 images from 1990 to 2010 and Landsat 8
images from 2014 to 2022 were used. Landsat surface reflectance data contained
the QA_Pixel band generated using the mask function (CFMask) algorithm. This
band obtains quality information for each pixel, including land, water bodies,
clouds, and cloud shadows and retains high-quality observations[15].
Various features such as the vegetation index, water body index, building
index, soil index, texture features, and solar geometry features were computed,
as elaborated in the Appendix.
(2) Water body area extraction
To enhance the accuracy of the aquaculture
extraction, an aquatic land separation technique was employed to reduce the
influence of other feature classes. The water body index approach is
particularly effective for highlighting spectral distinctions between water and
non-water surfaces, making it widely used for water body extraction[16,17].
Several water body indices facilitate the discrimination between water and land
to extract water body regions, such as the normalized difference water body
index (NDWI), modified normalized difference water body index (MNDWI), two
automatically matched water body extraction indices (AWEInsh and AWEIsh), the
water index (WI2015), and the multi-band water index (MBWI). A comparative
analysis of these indices[18] revealed that MNDWI demonstrates the
highest stability. Therefore, MNDWI was used to accentuate the water bodies
that were subsequently extracted through a thresholding process using the Otsu
method.
(3) Sample selection
Previous research on the classification of
aquaculture areas[19,
20] and other pertinent information were
considered to develop a classification system consisting of two main
categories: water bodies and aquaculture areas. The aquaculture areas were
further divided into land aquaculture ponds and marine aquaculture zones and
the specific discriminatory signs are shown in Table 2.
To train the classifier, sample points were
selected from both the onshore and offshore study areas based on Landsat 5 and
Landsat 8 data. The number of sample points for each category is listed in
Tables 3 and 4.
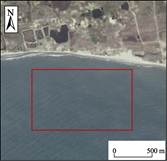
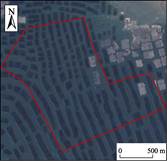
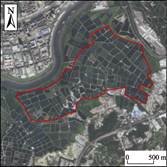
Table 2 Visual interpretation of discriminatory
signs
|
Feature
class
|
Description
|
Image
|
|
Water
|
Water
bodies include rivers, lakes, mudflat wetlands, and offshore waters
|
|
|
Marine
aquaculture zone
|
Marine aquaculture zones are
usually located in bays and near-shore marine waters and include both net-pen
aquaculture and raft aquaculture. Net-pen aquaculture areas in shallow marine
areas consist of aquatic plastic frames and suspended net-boxes, which are
concentrated and regularly rectangular in distribution. The net tank
aquaculture facilities are brighter in color in the images compared to the
water column. Raft aquaculture facilities consist of aquatic bamboo rafts
(for floating) and submerged thick ropes (for securing aquatic products). The
raft aquaculture area is characterized by dark grey stripes
|
|
|
Land
aquaculture pond
|
Land aquaculture ponds are
formed by reclaiming coastal wetlands or inland lakes, usually separated by
dykes and varying in size. They are regular and compact in shape, with clear
boundaries, displaying a regular texture, and the color of the pond is
consistent with the surrounding seawater
|
|
Table
3 Number of training samples for
aquaculture pond classification
|
Feature
class
|
Number
of samples of Landsat 5
|
Number
of samples of Landsat 8
|
|
Water
|
14,000
|
14,000
|
|
Land
aquaculture pond
|
20,372
|
20,000
|
Table
4 Number of training samples for the
classification of maritime aquaculture areas
|
Feature
class
|
Number
of samples of Landsat 5
|
Number
of samples of Landsat 8
|
|
Water
|
21,967
|
26,913
|
|
Marine
aquaculture zone
|
8,687
|
77,25
|
(4) Feature selection and aquaculture area
extraction
In classification tasks, the presence of
correlated features can lead to inefficiencies in processing, as well as
information redundancy, which ultimately decreases accuracy[21]. To
address these challenges, this study employs a random forest feature importance
ranking method to reduce the dimensionality of the data.
By leveraging the random forest algorithm,
a subset of key features of high importance was selected, enabling the
extraction of aquaculture areas based on these selected features. The random
forest model was constructed with 100 trees without imposing a maximum depth
constraint and with a minimum requirement of one sample per tree node. The
number of features per tree was set as the square root of the total number of
variables.
(5) Plural syntheses of the classification
results
The aquaculture zones were extracted from
each image for a year using a random forest classifier (Figure 2a). To
determine the final category, the frequency of occurrence of each category was
calculated by counting the pixels for each class (Figure 2b). Subsequently, the
category with the highest frequency was selected as the final classification
result for the year. This process is summarized in Figure 2.
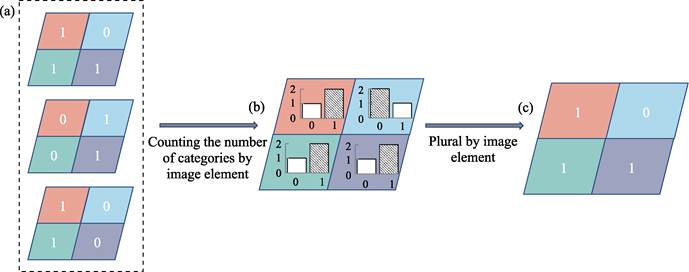
Figure 2 Schematic map of the synthesis of
multiple classification results: (a) classification results of dense time
series images, (b) number of category statistics results, and (c) final
classification results
(6) Accuracy evaluation
In this study, validation sample points
were randomly generated and interpreted using Google Earth images. The confusion
matrix was calculated by comparing the classification results of the validation
sample points with the visual interpretation results, and the overall accuracy
and kappa coefficient were used to evaluate the accuracy of the aquaculture
area extraction.
4 Data Results and Validation
4.1 Data Composition
The dataset
consists of national coastal aquaculture area data from 1990 to 2022 at 4-year intervals, containing land aquaculture ponds and marine
aquaculture zones. It has a spatial resolution of 30 m and is in .tif format.
4.2 Data Products
Over the past 32
years, the area of China??s coastal aquaculture initially increased and then
decreased. As shown in Figure 3a, from 1990 to 2014, the area of land
aquaculture ponds showed an overall increase from 13,140.19 to 16,650.04 km2,
with a net increase of 3,509.85 km2 (146.24 km2/year).
The largest increase occurred between 1994 and 1998 (2,892.07 km2,
723.02 km2/year). From 2014 to 2022, the total area of coastal land
aquaculture ponds in China continually declined from 16,650.04 to 13,763.29 km2,
with a net loss of 2,886.75 km2 (360.84 km2/year). The
largest decline occurred between 2018 and 2022 (1,862.24 km2, 465.56
km2/year).
As shown in Figure 3b, marine aquaculture
zones showed a continuously increasing trend from 1990 to 2022, increasing from
4,577.21 to 10,769.00 km2, a net increase of 6,191.78 km2
(193.49 km2/year), with the largest increase occurring between 1990
and 1994 (1,660.58 km2, 415.14 km2/year)
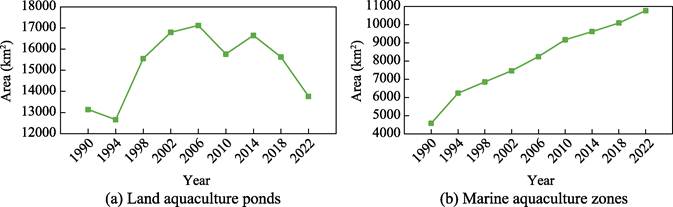
Figure 3 Changes in coastal aquaculture areas of
China from 1990?C2022
As shown in Figure 4a, Shandong had the
largest area of land aquaculture ponds in 2022 (22.95% of the total land
aquaculture pond area), followed by Liaoning (accounting for 15.55%), Guangdong
(accounting for 14.80%), Hebei (accounting for 10.83%), and Jiangsu (accounting
for 10.36%). Together, these five provinces account for 74.49% of the total
area of aquaculture ponds along the Chinese coast. While Hainan, Guangxi,
Shanghai, Hong Kong, and Macao only accounted for 4.78%.
As shown in Figure 4b, Fujian province had
the largest area of marine aquaculture zones in 2022 (accounting for 37.98%),
followed by Zhejiang (accounting for 21.43%), Shandong (accounting for 15.05%),
and Guangdong (accounting for 10.50%). Together, these four provinces accounted
for 84.96% of the total area of marine aquaculture zones. Hong Kong, Shanghai,
Hebei, Tianjin, and Macao only accounted for 0.99%.
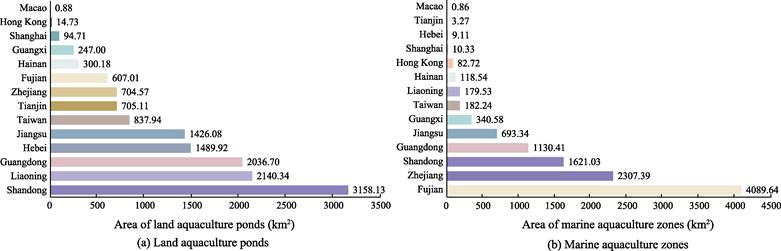
Figure 4 Aquaculture zone areas in China by province in 2022
4.3 Data Validation
In total, 6,000
random points (1,000 land aquaculture ponds, 1,000 marine aquaculture zones,
and 4,000 others) were generated and evenly distributed in the study area.
Google Earth imagery for each year from 1990 to 2022 was used as a
base map for visual interpretation to identify land aquaculture ponds, maritime aquaculture areas, and other areas. A confusion matrix was
generated from the visual interpretation and classification results to derive
kappa coefficients and overall accuracy. The results of the accuracy evaluation
for each year are shown in Figure 5. The average overall accuracy of the remote
sensing mapping results was 96.25% and the average kappa coefficient was 0.92.
The overall accuracy for all years was not less than 95.00% and the kappa
coefficient was not less than 0.90, indicating that the set of remote-sensing
mapping products had high classification accuracy.
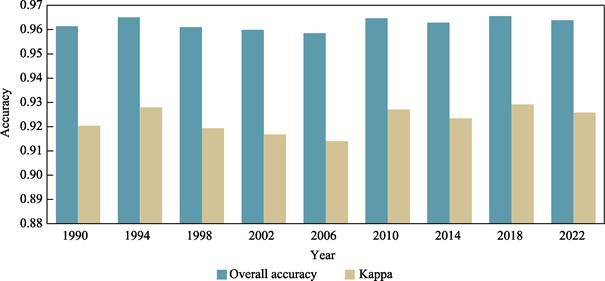
Figure 5 Statistics of the overall accuracy and
kappa coefficients of the dataset
5 Discussion and Conclusion
This
study determined the distribution of coastal aquaculture areas in China from
1990 to 2022 using long time series Landsat imagery based on the GEE platform.
The dataset covers the entire coastal zone of China with a spatial resolution
of 30 m and temporal resolution of four years. The validation results showed
that the dataset has high accuracy, with an overall accuracy of 96.25%. The
dataset can be applied to analyze the evolution of coastal aquaculture areas in
China, providing important support for policy formulation and implementation,
as well as a scientific basis for assessing sustainable development.
Author Contributions
Hu, Z. W., Wang, C., and Wu, G. F.
designed the algorithms for the dataset. Yin, Y. M. and Xu, Y. collected and
processed the samples and remote-sensing image data. Zhang, Y. H. and Shi, T.
Z. designed the model and algorithm. Yin, Y. M. and Xu, Y. performed data
validation. Yin, Y. M., Zhang, Y. H., and Hu, Z. W. wrote the paper.
Conflicts of Interest
The authors declare no
conflicts of interest.
References
[1] FAO. The State of World Fisheries and Aquaculture 2020 [M]. FAO, Rome,
2020.
[2] Duan, Y., Tian, B., Li, X., et
al. Tracking changes in aquaculture ponds on the China coast using 30 years
of Landsat images [J]. International
Journal of Applied Earth Observation and Geoinformation, 2021, 102: 102383.
[3] Sun, Z., Luo, J., Yang, J., et al. Nation-scale mapping of
coastal aquaculture ponds with Sentinel-1 SAR data using Google Earth Engine
[J]. Remote Sensing, 2020, 12(18): 3086.
[4] Wang, M., Mao, D., Xiao, X. M., et al. Interannual changes of
coastal aquaculture ponds in China at 10-m spatial resolution during 2016?C2021
[J]. Remote Sensing of Environment, 2023, 284: 113347..
[5] Sridhar, P. N., Surendran, A., Ramana, I. V. Auto-extraction
technique-based digital classification of saltpans and aquaculture plots using
satellite data [J]. International Journal of Remote Sensing, 2008,
29(2): 313‒323.
[6] Ottinger, M., Clauss, K., Kuenzer, C. Aquaculture: Relevance,
distribution, impacts and spatial assessments ?C a review [J]. Ocean & Coastal Management,
2016, 119: 244‒266.
[7] Ren, C., Wang, Z., Zhang, Y., et al. Rapid expansion of coastal
aquaculture ponds in China from Landsat observations during 1984?C2016 [J]. International
Journal of Applied Earth Observation and Geoinformation, 2019, 82: 101902.
[8] Ottinger, M., Clauss, K., Kuenzer, C. Large-scale assessment of
coastal aquaculture ponds with Sentinel-1 time series data [J]. Remote
Sensing, 2017, 9(5): 440.
[9]
Yin,
Y. M., Zhang, Y. H., Hu, Z. W., et al.
Quadrennial series dataset of coastal aquaculture distribution of China based
on Landsat images (1990-2022) [J/DB/OL]. Digital Journal of Global Change Data Repository, 2021.
https://doi.org/10.3974/geodb.2023.09.01.V1.
https://cstr.escience.org.cn/CSTR:20146.11.2023.09.01.V1.
[10] GCdataPR Editorial Office. GCdataPR data sharing policy [OL].
https://doi.org/10.3974/dp.policy.2014.05 (Updated 2017).
[11] Otsu, N. Threshold selection method from gray-level histograms [J]. IEEE
Transactions on Systems Man and Cybernetics, 1979, 9(1): 62‒66.
[12] Breiman, L. Random forests [J]. Machine Learning, 2001,
45(1): 5‒32.
[13] Pearson, K. Contributions to the mathematical theory of evolution
[J]. Philosophical Transactions of the Royal Society of London. A, 1894,
185: 71‒110.
[14] Liu, Y., Wang, Z., Yang, X., et al. Satellite-based
monitoring and statistics for raft and cage aquaculture in China??s offshore
waters [J]. International Journal of Applied Earth Observation and
Geoinformation, 2020, 91: 102118.
[15] Zhu, Z., Woodcock, C. E. Object-based cloud and cloud shadow
detection in Landsat imagery [J]. Remote Sensing of Environment, 2012,
118: 83‒94.
[16] Xie, H., Luo, X., Xu, X., et al. Evaluation of Landsat 8 OLI
imagery for unsupervised inland water extraction [J]. International Journal
of Remote Sensing, 2016, 37(8): 1826‒1844.
[17] Guo, Q., Pu, R., Li, J., et al. A weighted normalized
difference water index for water extraction using Landsat imagery [J]. International
Journal of Remote Sensing, 2017, 38(19): 5430‒5445.
[18] Peng, Y., Sengupta, D., Duan, Y., et al. Accurate mapping of
Chinese coastal aquaculture ponds using biophysical parameters based on Sentinel-2
time series images [J]. Marine Pollution Bulletin, 2022, 181: 113901.
[19] Virdis, S. G. P. An object-based image analysis approach for
aquaculture ponds precise mapping and monitoring: a case study of Tam Giang-Cau
Hai Lagoon, Vietnam [J]. Environmental Monitoring and Assessment, 2014,
186(1): 117‒133.
[20] Diniz, C., Cortinhas, L., Pinheiro, M. L., et al. A
large-scale deep-learning approach for multi-temporal aqua and salt-culture
mapping [J]. Remote Sensing, 2021, 13(8): 1415.
[21] Gross, J. W., Heumann, B. W. Can flowers provide better spectral
discrimination between herbaceous wetland species than leaves? [J]. Remote
Sensing Letters, 2014, 5(10): 892‒901.