Dataset Development on Urbanization Multidimensional
Coordination Index at County-level on the Qinghai-Xizang Plateau
Tian, Y. C. Tian, M.*
School of Government, Beijing
Normal University, Beijing 100875, China
Abstract: The authors
constructed a multidimensional coordinated index of urbanization at the county
level of Qinghai-Xizang Plateau from 156 counties based on 4 dimensions:
economy, society, resources, and environment. The dataset includes the
following data on the Qinghai-Xizang Plateau in 2000, 2010 and 2020: (1)
indicator data at county-level; (2) urbanization multidimensional coordination
index data at county-level; (3) independent variable data on the mechanisms
influencing the urbanization multidimensional coordination index at
county-level; (4) changes in the average urbanization rate of counties in
different regions; (5) changes in the sub-indices and comprehensive index of
county-level urbanization coordination; (6) changes in the percentages of
secondary and tertiary industries in counties; (7) regional comparison of the percentage
of local general budget revenue to public fiscal expenditure in counties. The
dataset is archived in .xlsx format, and consists of one file with data size of
125 KB.
Keywords: urbanization; multidimensional coordination index; county; Qinghai-Xizang Plateau
DOI: https://doi.org/10.3974/geodp.2025.01.05
Dataset Availability Statement:
The dataset supporting this paper was
published and is accessible through the Digital
Journal of Global Change Data Repository at:
https://doi.org/10.3974/geodb.2024.11.06.V1.
1 Introduction
As the
??Third Pole?? of the Earth and a critical ecological barrier, the Qinghai-Xizang
Plateau is undergoing a rapid urbanization, which significantly impacts
regional sustainable development and aligns closely
with national and global development goals[1].
Considering its fragile ecosystem and sensitivity to human activities,
promoting high-quality urbanization is a key strategy for safeguarding the
ecological environment. Urbanization entails the complex interaction of various
elements, including population, land, economy, and the environment[2].
Therefore, scientifically guided urban planning is essential for achieving
regional coordinated development and improving livelihoods.
The core of high-quality urbanization lies in the coordination and
dynamic balance of various elements[3].
Population urbanization, as a key factor, must align moderately with economic
development and industrialization[4].
Excessively rapid migration may lead to inadequate
employment opportunities and social challenges, while overly restricted
migration may cause labor shortages, hindering economic growth[5].
The provision of social services plays a crucial role in enhancing urbanization
quality, as the development of high-level public services can effectively
stimulate urbanization[6]. In
terms of resources and the environment, high-quality urbanization requires the
rational allocation of both population and resources, avoiding both excessive
resource consumption and insufficient environmental protection, to achieve
harmonious development between humans and nature[7].
The
quality of urbanization is typically assessed through the construction of
multidimensional indicators and composite indices[8].
However, this approach has limitations in revealing
the interrelationships among different indicator dimensions. To overcome this,
coupling coordination analysis is often employed to evaluate the synergy
between urbanization and the ecological environment[9],
and it has also been applied to areas such as industry and public services[10]. Studies show that the
coupling coordination between urbanization and the ecological environment in
Qinghai-Xizang Plateau has improved in Qinghai[11],
but remains relatively low in Xizang[12]. The relationship between
urbanization, socio-economic development, and resource utilization is dynamic[13]. For example, its role in
promoting economic growth, its connection to the Environmental Kuznets Curve[14], and its interaction with
efficient land resource utilization[7]
all demonstrate this dynamic pattern.
In the distinctive
geographical and social context of the Qinghai-Xizang Plateau, counties enjoy a
high degree of autonomy, making them pivotal
units for advancing high-quality regional urbanization[15,16].
This study examines the urbanization process in Qinghai-Xizang Plateau,
analyzing the dynamic coordination between urbanization and multidimensional
factors. Using counties as the primary units, key indicators from different
dimensions are selected to construct a multidimensional urbanization
coordination index. Furthermore, the study investigates potential factors
influencing coordinated urbanization development, offering insights to guide
the promotion of high-quality urbanization on the plateau.
2 Metadata of the Dataset
Table
1 summarizes the metadata of the Dataset on urbanization multidimensional
coordination index at county-level of Qinghai-Xizang Plateau[17],
with the dataset full and short names, authors, year, temporal and spatial
resolution, data format, data size, data files, data publisher, and data
sharing policy included.
3 Methods
3.1 Data Sources
This
study adopts the boundary definition of the Qinghai-Xizang Plateau proposed by
Zhang, et al.[19,20], and
selects the region within China??s national borders as delineated by the standard
map from the Standard Map Service of the Ministry of Natural Resources (No. GS
(2022) 4306) as the study region. The study focuses on the years 2000, 2010,
and 2020, covering 156 county-level units. The data used in this research covers
the following aspects:
Table 1 Metadata summary of the Dataset on urbanization
multidimensional coordination index at county-level of Qinghai-Xizang Plateau
|
Items
|
Description
|
|
Dataset full
name
|
Dataset on
urbanization multidimensional coordination index at county-level of Qinghai-Xizang
Plateau
|
|
Dataset
short name
|
CountyUrbanCoord-QXP-2000-2020
|
|
Authors
|
Tian, Y, C.,
School of Government, Beijing Normal University, 202131240006@mail.bnu.edu.cn
Tian, M.,
School of Government, Beijing Normal University, tianm@bnu.edu.cn
|
|
|
Zeng, D.,
School of Government, Beijing Normal University, 202121240021@mail.bnu.edu.cn
|
|
Geographical
region
|
Qinghai-Xizang
Plateau, China
|
|
Year
|
2000, 2010,
2020
|
|
Temporal
resolution
|
Year
|
|
Spatial
resolution
|
County-level
administrative unit
|
|
Data format
|
.xlsx
|
|
|
|
Data size
|
125 KB
|
|
|
|
Data files
|
Raw
indicator data for county-level urbanization multidimensional coordination;
County-level urbanization multidimensional coordination index data, and the
overall sub-indices and comprehensive index for Qinghai-Xizang Plateau;
Independent variable data for the influencing mechanisms of county-level
urbanization multidimensional coordination; Changes in the average
urbanization rate of counties in different regions, etc.
|
|
Foundations
|
Ministry of
Science and Technology of P. R. China (2019QZKK0406); National Natural Science
Foundation of China (42371197)
|
|
Data
publisher
|
Global Change Research Data Publishing & Repository,
http://www.geodoi.ac.cn
|
|
Address
|
No. 11A,
Datun Road, Chaoyang District, Beijing 100101, China
|
|
Data sharing
policy
|
(1) Data
are openly available and can be free downloaded via the Internet; (2) End
users are encouraged to use Data subject to citation; (3) Users, who are by definition also
value-added service providers, are welcome to redistribute Data
subject to written permission from the GCdataPR Editorial Office and the
issuance of a Data redistribution license; and (4) If Data are used to
compile new datasets, the ??ten percent principal?? should be followed such
that Data records utilized should not surpass 10% of the new
dataset contents, while sources should be clearly noted in suitable places in
the new dataset[18]
|
|
Communication
and searchable system
|
DOI, CSTR, Crossref, DCI, CSCD, CNKI, SciEngine, WDS, GEOSS, PubScholar,
CKRSC
|
(1) Total
population and urban-rural population structure data, obtained from
county-level national population census data.
(2) Socio-economic
data, including GDP, industrial structure, and fiscal revenue and expenditure,
sourced from the China County Statistical Yearbook[21],
supplemented by statistical yearbooks from specific prefectures and
municipalities.
(3) Land use, land
cover, and elevation data. Built-up land area for each year was calculated using ESRI??s 10-m resolution land use data for 2020
and Liu, Yanxu??s (2024) 30-m resolution land cover data
for the Qinghai-Xizang Plateau at three time points.
County-level annual NDVI values were calculated using the cumulative method
based on Xu, Xinliang??s (2018) monthly NDVI dataset for China.
Additionally, average county-level elevation was derived from the SRTM 90-m
resolution DEM dataset.
3.2 Selection of Indicators
In
this study, the level of urbanization is
represented by the proportion of the urban population within the total resident
population. The multidimensional urbanization coordination index is constructed
based on the following indicators: per capita GDP to represent regional
economic development, the number of hospital beds per 1,000 people to reflect
the level of social public services, the scale of built-up land per 10,000
people to indicate land use intensity, and the average county-level NDVI value
to represent ecological environment quality.
3.3 Construction of the
Multidimensional Urbanization Coordination Index
(1)
Construction of Sub-Indices. A random-effects model is used to estimate the
relationship between urbanization level and the economic, social, resource, and
environmental variables separately. This allows for the calculation of the
expected values of each indicator for each county across different years
(Equation 1), representing the ideal state at each time point. The actual
values of each indicator are then divided by the expected values to compute the
sub-indices for each category (Equation 2):
 (1)
(1)
 (2)
(2)
where
t represents the time period (t1=2000; t2 = 2010; t3=2020).  ,
,  , and
, and denote the expected value,
actual value, and coordination index for the j-th item in the i-th
county at time t (where j=1, 2, 3, 4), respectively.
denote the expected value,
actual value, and coordination index for the j-th item in the i-th
county at time t (where j=1, 2, 3, 4), respectively.  represents the urbanization rate of county i in
period t (%),
represents the urbanization rate of county i in
period t (%),  represents the constant
term,
represents the constant
term,  is the coefficient of urbanization rate,
  denotes the individual effect residual,
  is the common effect residual. The
coordination index is standardized using the following equations.
is the common effect residual. The
coordination index is standardized using the following equations.
For positive
indicators:
 (3)
(3)
For negative
indicators:
 (4)
(4)
where
the value of j can be 1, 2, or 3, representing the coordination degree
between urbanization and the economy, society, and environment, respectively,
in the i-th county. In Equation 4, j equals 1, representing the
coordination degree between urbanization and resources in the i-th
county.
(2) Construction of
the Comprehensive Coordination Index. The combined weight calculation for each
sub-index of the coordination index is as follows:
 (5)
(5)
where m
represents the number of samples, and n represents the number of indices,
where n = 4. The weights for the
urbanization-economy, society, resources, and environment coordination indices
are 0.241,9, 0.265,1, 0.187,6, and 0.305,4, respectively.
 (6)
(6)
The comprehensive
coordination index for each county is calculated as follows:
 (7)
(7)
3.4 Selection of
Independent Variable Indicators for Mechanism Analysis
Urbanization
coordination is influenced by several factors, including geographic location,
population distribution, economic development, and government capacity. This
paper selects variables from these four aspects as follows: the average
altitude of the county and the distance from each county to the provincial
capital to represent geographic location; county population density and the
rank of central towns to represent population and urbanization levels; per
capita GDP, the value added of the primary industry, the proportion of
secondary and tertiary industry structures, and the number of large-scale
industrial enterprises to represent the level of economic development; local
fiscal general budget revenue and public fiscal expenditure to represent
government capacity.
4 Data Results
4.1 Dataset Composition
The
dataset is archived in .xlsx format and consists of the following data for the
Qinghai-Xizang Plateau in 2000, 2010, and 2020:
(1) Indicator data
at county-level; (2) Urbanization multidimensional coordination index data at
county-level; (3) Independent variable data on the mechanisms influencing the
urbanization multidimensional coordination index at county-level; (4) Changes
in the average urbanization rate of counties in different regions; (5) Changes
in the sub-indices and comprehensive index of county-level urbanization coordination;
(6) Changes in the percentages of secondary and tertiary industries in
counties; (7) Regional comparison of the percentage of local general budget
revenue to public fiscal expenditure in counties.
4.2 Data Products
|
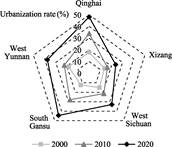
Figure 1 Urbanization rate changes in the counties of
the Qinghai-Xizang Plateau
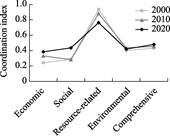
Figure 2 Urbanization
coordination index changes of the counties on the Qinghai-Xizang Plateau
|
(1) Urbanization level. From 2000 to 2020, urbanization
in the counties of the Qinghai-Xizang Plateau exhibited slow growth. The region??s overall
urbanization level increased from 15% in 2000 to 33% in 2020, with an average
annual growth rate of approximately 1%. In terms of regional differences,
urbanization levels in the Qinghai and Gannan regions rose from 18% and 12% in
2000 to 34% and 28% in 2010, and further to 48% and 44% in 2020, reflecting a
relatively stable growth rate. In contrast, urbanization in Xizang, western
Yunnan, and western Sichuan grew slowly in the first decade, but accelerated in
the second. For example, the urbanization rates in western Sichuan and western
Yunnan increased significantly from 21% and 22% in 2010 to 33% and 37% in 2020 (Figure
1).
(2)
Multidimensional urbanization coordination index. From 2000 to 2020, the
urbanization coordination index of the Qinghai-Xizang Plateau exhibited notable
variation (Figure 2). The overall coordination index increased from 0.43 in
2000 to 0.48 in 2020, showing steady growth. Specifically, the economic and
social coordination indices demonstrated significant upward trends, with the
coordination indices rising from 0.24 and 0.29 in 2000 to 0.39 and 0.44 in
2020, respectively. Economic coordination has been the
lowest among all sub-indices, followed by social coordination and environmental
coordination. Resource coordination has remained the highest, although it declined during the study period, particularly between 2010 and
2020. The environmental coordination index remained relatively stable and was
the least variable among all indices.
|
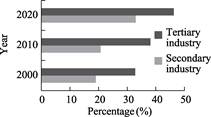
Figure 3 Changes of the
percentage of Secondary and Tertiary Industries in the counties of
Qinghai-Xizang Plateau
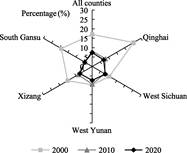
Figure 4 Percentage changes of
local general budget revenue within public fiscal expenditure in counties of
Qinghai-Xizang Plateau
|
(3) Core indicators of the coordination mechanism. Industrial structure
is a key economic factor influencing the coordination of urbanization. The industrial
structure in the counties of the Qinghai-Xizang Plateau
shifted from 48.16%, 19.03%, and 32.81% for the primary, secondary, and
tertiary industries, respectively, in 2000, to 41.18%, 20.73%, and 38.09% in
2010, and further to 20.74%, 32.96%, and 46.3% in 2020. The percentage of the
primary industry has steadily declined, the secondary industry experienced
significant growth between 2010 and 2020, and the tertiary industry showed
consistent growth (Figure 3). The industrial structure
of the Qinghai-Xizang Plateau clearly reflects a shift toward service-oriented
development, with the share of the tertiary industry surpassing that of the
secondary industry. Currently, the Qinghai-Xizang Plateau remains in the early to mid-stage of industrialization,
and increasing the proportion of the secondary industry will strengthen the overall coordination of industrialization
and urbanization, providing a more solid economic foundation for urbanization
in the region.
Government capacity
is another key factor influencing urbanization coordination. As shown in Figure
4, the share of local fiscal revenue within public expenditure in the counties
of the Qinghai-Xizang Plateau evolved from 2000 to 2020. Over this period, the
proportion of local general budget revenue steadily declined, while the share of transfer payments from the
central and provincial governments in public fiscal expenditure increased continuously,
reaching nearly 90% by 2020. Although the impact of local fiscal revenue on
urbanization coordination is constrained by its scale, increasing local fiscal
revenue can significantly enhance the management and protection of the
ecological environment, thereby promoting the coordinated development of
urbanization and the environment.
5 Discussion and Conclusion
The
high-quality development of urbanization is reflected in the coordination of
various dimensions such as the economy, society, resources, and environment.
Based on the analysis of the urbanization evolution characteristics in the
counties of the Qinghai-Xizang Plateau, this study constructs a composite index
to measure the multidimensional coordination index of urbanization.
Specifically, the index includes the economic, social, resource, and
environmental coordination, as well as the overall coordination of urbanization
in the counties of the Qinghai-Xizang Plateau from 2000 to 2020. The study also
explores the influencing factors and key variables driving multidimensional
coordination at the county-level, providing insights into the evolution
patterns and mechanisms of urbanization on the Qinghai-Xizang Plateau. This
research offers valuable references for achieving high-quality urbanization development.
However due to data availability constraints, this
study uses straight-line distance to represent the impact of geographic
distance on multidimensional coordination of urbanization. Should more accurate
data become available, more precise time-distance variables should be
incorporated. Additionally, the overall population and urban population scale
of the counties on the Qinghai-Xizang Plateau are generally small, and when
estimating the influencing mechanisms of multidimensional coordination,
attention must be given to the potential errors caused by small sample sizes in
model estimation, to ensure the scientific reliability of the analysis results.
Author Contributions
Tian, M. was responsible for the overall design of
the dataset, developing the models and algorithms, and performing data
validation. Tian, Y. C. collected and processed the data and wrote the data
paper.
Conflicts of Interest
The authors declare no conflicts of interest.
References
[1]
Fang, C. L. Special thinking
and green development path of urbanization in Qinghai-Xizang Plateau [J]. Acta
Geographica Sinica, 2022, 77(8): 1907?C1919.
[2]
Chen, M. X. Research progress
and scientific issues in the field of urbanization [J]. Geographical
Research, 2015, 34 (4): 614?C630.
[3]
Wang, F. X., Mao, A. H., Li, H.
L., et al. Quality measurement and regional difference of urbanization
in Shandong Province based on the entropy method [J]. Scientia Geographica
Sinica, 2013, 33(11): 1323?C1329.
[4]
Fang, C. L., Wang, D. L.
Comprehensive measures and improvement of Chinese urbanization development
quality [J]. Geographical Research, 2011, 30(11): 1931?C1946.
[5]
Tian, M. The Flow and
Integration of Agricultural Transferred Population: The Core Issue of New Urbanization
[M]. Beijing: Science Press, 2008.
[6]
Qi,
W. Spatial-temporal pattern and drivers of the population urbanization on the
Qinghai-Xizang Plateau [J]. Journal of
Geoinformation Science, 2019, 21(8): 1196?C1206.
[7]
Liu, H., Zhang, Y., Zheng, W.
S. Evaluation on spatio-temporal development and interaction of intensive urban
land use and urbanization: case studies of the cities in the Bohai Rim Region [J].
Geographical Research, 2011, 30(10): 1805?C1817.
[8]
Ma, Y. X., Zhang, Z. B.
Evaluation of sustainable development of urbanization in Gansu Province and
analysis of the influencing factors under SDGs framework [J]. Journal of
Lanzhou University (Natural Sciences), 2021, 57(5): 627?C636.
[9]
Zhang, M. D., Mo, D. Y.
Coupling coordination degree of urban land use benefit and urbanization [J]. Resources
Science, 2014, 36(1): 8?C16.
[10]
Shi, F. J., Xu, Y.
Spatio-temporal coupling characteristics and its influencing factors between
population urbanization and industrial upgrading at country level in China [J].
Resources and Environment in the Yangtze Basin, 2021, 30(12): 2811?C2821.
[11]
Xue, B., Chen, X. P., Wu, J.
H., et al. A study on the coupling relation and evolvement of the population-resources-environment
in Qinghai Province [J]. Journal of Lanzhou University (Natural
Sciences), 2007(1): 33?C36.
[12]
Fan, J., Xu, Y., Wang, C. S., et
al. The effects of human activities on the ecological environment of Xizang
over the past half century [J]. Chinese Science Bulletin, 2015, 60(32):
3057?C3066.
[13]
Zhou, Y. X. Urban Geography
[M]. Beijing: Science Press, 2005.
[14]
Shafik, N. Economic development
and environmental quality: an econometric analysis [J]. Oxford Economic
Papers, 1994, 46(Supplement 1): 757?C773.
[15]
Wang, J., Li, Y. R. Spatial
pattern and influencing factors of urbanization development in China at county
level: a quantitative analysis based on 2000 and 2010 census data [J]. Acta
Geographica Sinica, 2016, 71(4): 621?C636.
[16]
Fu, X. F. An analysis of
urbanization and its dynamical mechanism in Qinghai-Xizang Plateau [J]. Journal
of Natural Resources, 2000, 15(4): 369-374.
[17]
Tian, Y. C., Tian, M., Zeng, D.
Dataset on urbanization multidimensional coordination index at county-level of
Qinghai-Xizang Plateau [J/DB/OL]. Digital
Journal of Global Change Data
Repository, 2024. https://doi.org/10.3974/geodb.2024.11.06.V1.
[18]
GCdataPR Editorial Office.
GCdataPR data sharing policy [OL]. https://doi.org/10.3974/dp.policy.2014.05
(Updated 2017).
[19]
Zhang, Y. L., Li, B. Y., Zheng,
D. Datasets of the boundary and area of the Tibetan Plateau [J/DB/OL]. Digital
Journal of Global Change Data Repository, 2014.
https://doi.org/10.3974/geodb.2014.01.12.V1.
[20]
Zhang, Y. L., Li, B. Y., Zheng,
D. Datasets of the boundary and area of the Tibetan Plateau [J]. Acta Geographica
Sinica, 2014, 69(Supplement): 164?C168.
[21]
Rural Social and Economic
Survey Department, National Bureau of Statistics of China. China County Statistical
Yearbook [M]. Beijing: China Statistics Press, 2001?C2021.