Dataset
Development on Centennial Homogenized Monthly/Yearly Mean Temperature at
Jiujiang Meteorological Station, Jiangxi Province of China (1924?C2023)
Zhan, L. F.1,2 Dong, B. H.1,2 Xu, B.1,2* Li, Y.1,2 Xin, J. J.1,2 Wang, L. Y.3
1.
Jiangxi Provincial Climate Center, Nanchang 330096, China;
2.
Nanchang National Climate Observatory, Nanchang 330200, China;
3. Jiangxi Vocational and Technical College of Information
Application, Nanchang 330043, China
Abstract:
Long-term homogenized observational time series are crucial for accurate
assessment and attribution of climate change. However, at various times, most
meteorological stations in China are affected by factors such as station
relocation, instrument replacement, and environmental change, resulting in
heterogeneity in observational data series. In this study, based on multisource
monthly mean temperature data, the monthly mean temperature data recorded at
Jiujiang Meteorological Station in Jiangxi Province (China) during 1924?C2023
were interpolated using the standardized sequential method, taking data from
Wuhan Meteorological Station as reference. The interpolated data were subjected
to a homogenization test using the penalized maximal F test method, and then
corrected using the quantile matching method. Thus, the Centennial homogenized monthly/yearly
mean temperature dataset of Jiujiang Meteorological Station, Jiangxi Province,
China (1924?C2023) was constructed. Comparative analysis with centennial homogenized
temperature data of neighboring meteorological stations revealed a correlation
coefficient of >0.9, verifying that the construction method is scientific
and that this dataset has certain reliability. The dataset is archived in .txt
data format, and consists of 2 data files with data size of 16.5 KB.
Keywords: Jiujiang; temperature; centennial series;
interpolated; homogenized
DOI: https://doi.org/10.3974/geodp.2025.01.10
Dataset Availability Statement:
The dataset
supporting this paper was published and is accessible through the Digital Journal of Global Change Repository at: https://doi.org/10.3974/geodb.2024.12.03.V1.
1 Introduction
In the context of global
climate change, study of regional climatic variability is of great importance
for improved understanding of the spatial characteristics of climate change and
the associated potential impacts[1,2]. The East Asian monsoon region is one area that is
highly sensitive to the effects of global climate change, where regional
climate change is driven directly by global warming and multiple other factors
such as the regional atmospheric circulation and changes in land use cover[3]. Jiujiang is an
important city in the middle-lower reaches of the Yangtze River (China) that
has typical East Asian monsoon climate characteristics. Its long-term climate
records provide a valuable basis for studying the characteristics of the
regional climate and their relationship with global climate change. However,
owing to the diverse sources of historical meteorological observational data, a
number of missing measurements, and the inhomogeneity inherent in the time
series, high-quality datasets that accurately reflect the long-term trend of
climate change in the Jiujiang region are scarce[4].
Constructing continuous, reliable, and long-term time
series of homogenized meteorological data forms the basis of climate change
research[5,6]. Homogenization is the process of systematically
correcting and unifying multisource meteorological observational data to
eliminate systematic differences and nonhomogeneous characteristics between
different data elements so that they reflect the true characteristics of
climate change. In recent years, many studies have achieved remarkable results
using homogenization techniques to correct historical meteorological data[7?C10]. However, in
specific applications, it remains necessary to combine regional characteristics
and historical data characteristics for more detailed and targeted processing.
In this study,
taking the Jiujiang Meteorological Station (Jiangxi Province, China) as the
research object, multisource meteorological data from 1924?C1938 and from
1951?C2023 were integrated with homogenized data from neighboring stations from
1924?C2016. Then, a homogenized monthly temperature dataset for Jiujiang
Meteorological Station from 1924?C2023 was constructed using the standardized
sequential method, a homogenization test, and breakpoint correction technology.
Finally, the temperature change characteristics at Jiujiang Meteorological
Station over the past 100 years were revealed. This study provides important
data support for climate change research in the Jiujiang region, and represents
a reference for the processes of homogenization and sequence construction of
meteorological data in other regions.
2 Metadata of the Dataset
The
name, authors, geographical region, data period, temporal resolution, spatial
resolution, dataset composition, data publication and sharing service platform,
and data sharing policies of the Centennial homogenized monthly/yearly mean temperature
dataset of Jiujiang Meteorological Station, Jiangxi Province, China (1924?C2023)[11]
are provided in Table 1.
3 Data Development Methods
3.1 Data Sources
The Jiujiang Meteorological Station data from January 1924 to March
1938 were obtained from the ??China Temperature Data??[13] record
compiled by the Joint Data Office of the
Table 1 Metadata summary of the Centennial homogenized monthly/yearly mean temperature
dataset at Jiujiang Meteorological Station, Jiangxi Province, China (1924?C2023)
|
Items
|
Description
|
|
Dataset full name
|
Centennial homogenized monthly/yearly
mean temperature dataset at Jiujiang Meteorological Station, Jiangxi Province
of China (1924?C2023)
|
|
Dataset short name
|
MeanTempJiujiang1924?C2023
|
|
Authors
|
Zhan, L. F.,
Jiangxi Provincial Climate Center, lf.zhan@foxmail.com
Xu, B., Jiangxi
Provincial Climate Center, 1176325432@qq.com
Dong, B. H.,
Jiangxi Provincial Climate Center, dongbaohua_jx@163.com
Li, Y., Jiangxi
Provincial Climate Center, 908791309@qq.com
|
|
Geographical region
|
Jiujiang
|
|
Year
|
1924?C2023
|
|
Temporal
resolution
|
Month, year
|
|
Spatial resolution
|
Meteorological station
|
|
Data format
|
.txt
|
|
Data size
|
16.5 KB
|
|
Data files
|
The monthly/yearly mean air
temperature (unit ??) of Jiujiang Meteorological Station from 1924 to 2023
|
|
Foundations
|
China Meteorological
Administration (CMA2024QN15); Science and Technology Department of Jiangxi
Province (20223BBG71019, 2023KYG01001); Shanghai Meteorological Service
(QYHZ202106); Guangdong Meteorological Service (ZJLY202312); Nanchang
National Climatic Observatory (JX2023Z09); Jiangxi Meteorological Service
(JX2022ZHHFXPC06)
|
|
Computing environment
|
Python, R
|
|
Data publisher
|
Global Change Research Data
Publishing & Repository, http://www.geodoi.ac.cn
|
|
Address
|
No. 11A, Datun Road, Chaoyang
District, Beijing 100101, China
|
|
Data sharing policy
|
(1) Data are openly available and can be free downloaded via the Internet; (2)
End users are encouraged to use Data
subject to citation; (3) Users, who are by definition also value-added
service providers, are welcome to redistribute Data subject to written permission from the GCdataPR Editorial
Office and the issuance of a Data
redistribution license; and (4) If Data are used to compile new datasets, the ??ten percent principal?? should be
followed such that Data records
utilized should not surpass 10% of the new dataset contents, while sources
should be clearly noted in suitable places in the new dataset[12]
|
|
Communication and searchable system
|
DOI, CSTR, Crossref, DCI,
CSCD, CNKI, SciEngine, WDS, GEOSS, PubScholar, CKRSC
|
China Central Meteorological
Administration and the Institute of Geology and Geophysics (Chinese Academy of
Sciences), which was published in 1954. The data from 1951?C2023 were extracted
from the ??Tianqing?? meteorological big data cloud platform[14]
developed by the National Meteorological Information Center. The centennial
homogenized data of neighboring reference stations were taken from the dataset
established by the Institute of Atmospheric Physics of the Chinese Academy of
Sciences, after correcting the centennial homogenized monthly temperature
series of 32 stations in China. This dataset well represents the
characteristics of large-scale climate change in China over the past century[15]. The
geographical location of Jiujiang Meteorological
Station is shown in Figure 1.
3.2 Algorithm Principles
3.2.1 Data Interpolation
The temperature series of Jiujiang Meteorological Station prior to 1951
was constructed
based on monthly mean
temperature data in the ??China Temperature Data??. However, the  temperature data record of Jiujiang Meteorological
Station after preliminary integration showed continuous missing measurements
from April 1938 to December 1950, with a rate of missing data up to 12.8%. To
restore data integrity, the missing data were interpolated using the
standardized sequential method, and neighboring stations with complete
long-term time series sequences were taken as reference stations.
temperature data record of Jiujiang Meteorological
Station after preliminary integration showed continuous missing measurements
from April 1938 to December 1950, with a rate of missing data up to 12.8%. To
restore data integrity, the missing data were interpolated using the
standardized sequential method, and neighboring stations with complete
long-term time series sequences were taken as reference stations.
The calculation under the standardized sequential
method can be expressed as follows[16]:
 (1)
(1)
 (2)
(2)
 (3)
(3)
where  denotes the standardized sequence,
  denotes the mean
standardized sequence of the reference stations,
denotes the mean
standardized sequence of the reference stations,  represents the data to be interpolated in the ith
month, j denotes the jth reference station,
represents the data to be interpolated in the ith
month, j denotes the jth reference station,  refers to the data of the ith month of the jth
station,
refers to the data of the ith month of the jth
station,  and
and  are the multiyear mean and the standard deviation of the data
of the ith month of the jth station,
respectively, n represents the number of reference stations, and
are the multiyear mean and the standard deviation of the data
of the ith month of the jth station,
respectively, n represents the number of reference stations, and  and
and  are the multiyear
mean and the standard deviation of the data of the ith month
of the station to be interpolated, respectively.
are the multiyear
mean and the standard deviation of the data of the ith month
of the station to be interpolated, respectively.
According to the requirements of reference[17],
the Jiujiang Meteorological Station should be used as the reference when
selecting neighboring stations, and the data of neighboring meteorological
stations within a horizontal distance of 300 km should be selected. Regarding
the selected meteorological station, the starting observation year must be
earlier than 1924, the data integrity must be high, and the site elevation
should be similar to that of Jiujiang Meteorological Station. After
comprehensive consideration, Wuhan Meteorological Station was finally selected
as the reference station for the neighboring stations.
3.2.2 Homogenization Test and Correction
(1) Breakpoint test method
It was not until the early 1950s that China
had relatively complete and systematic observational data. Prior to 1951, owing
to the diverse sources of data recorded by China??s meteorological observation
stations, the continuity, consistency, and standardization of the time series
were inadequate. The lack of a reliable basis on which to evaluate the
rationality of nonhomogeneous test results before
1951 further increased the difficulty of constructing a reference time series
that truly reflected local climate change.
RHtest V4 software package is a statistical
tool designed for homogeneity testing and adjustment of climate data. It is
primarily used to detect and correct biases in climatic time series data (e.g.,
temperature, precipitation, etc.) caused by non-climatic factors (such as
station relocations, instrument changes, observation method updates, etc.),
thereby improving the reliability and consistency of the data. The penalized
maximum F test in the RHtest V4 software package is a test method that can be
performed without a reference sequence. Its primary advantage is that it can
substantially reduce test bias caused by nonhomogeneous reference sequences and
incomplete metadata information. Previous studies fully demonstrated the
effectiveness and reliability of this method. Therefore, based on the monthly
mean temperature series, this study adopted the penalized maximum F test method
to conduct a homogenization test on the monthly mean temperature series of
Jiujiang Meteorological Station from 1924?C2023. The test procedure followed the
method discussed in reference[18].
(2) Breakpoint correction method
The quantile matching method[19] was used to correct the monthly data
series. This method can ensure that the segments in the sequence to be tested
match each other in the empirical distribution after eliminating the linear
trend. In this study, 2 types of breakpoints were corrected: those before 1954
and those after 1954.
1) Breakpoints before 1954. Detected in both
the yearly and the monthly series, these breakpoints represented notably
discontinuous points. However, owing to lack of supporting detailed metadata,
the correction positions were determined based on the breakpoint times detected
in the monthly data series.
2) Breakpoints detected after 1954. Found in the
yearly series or in the monthly series, these breakpoints were identified with
supported from corresponding metadata. If the time of occurrence of these
breakpoints differed from the information recorded in the station metadata by
no more than one year, the position of the breakpoint was replaced and adjusted
according to the specific time of the metadata record[6].
 The test adopted a 95% confidence level to ensure the reliability of
the test results. This method is helpful for reducing test errors caused by
nonhomogeneous reference sequences and lack of detailed metadata information,
thereby improving the accuracy of the sequence correction.
The test adopted a 95% confidence level to ensure the reliability of
the test results. This method is helpful for reducing test errors caused by
nonhomogeneous reference sequences and lack of detailed metadata information,
thereby improving the accuracy of the sequence correction.
3.3 Technical Roadmap
The technical
roadmap for the development of the Centennial homogenized monthly/yearly mean temperature
dataset of Jiujiang Meteorological Station, Jiangxi Province, China (1924?C2023)
is shown in Figure 2. The meteorological observational data from 1924?C1938 and from 1951?C2023
were integrated with the statistically homogenized correction data from
1924?C2016. Then, the standardized sequential method was used to interpolate
missing data in the Jiujiang Meteorological Station record. Based on the
homogenization test and the correction procedure, the yearly homogenized
meteorological data series of the Jiujiang Meteorological Station from
1924?C2023 was constructed.
4 Data Results and Validation
4.1 Dataset Composition
This dataset contains monthly/yearly mean
temperature data of the Jiujiang Meteorological Station from 1924?C2023. The
monthly average temperature lists the data for year, month, and corresponding
monthly average temperature (??C); the annual average temperature lists the year
and corresponding annual average temperature (??C). The dataset is archived in
the .txt format, and consists of 2 data files with data size
of 16.5 KB.
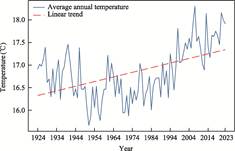
4.2 Data Results
In this study, a complete
centennial time series temperature dataset was constructed. As shown in Figure 3, prior
to the 1950s, the yearly mean temperature at Jiujiang Meteorological Station
showed a downward trend, whereas from the 1950s to the early 1990s there was no
obvious change. From the 1990s, the yearly mean temperature began to show a
clear upward trend. Overall, the rate of change during 1924?C2023 was
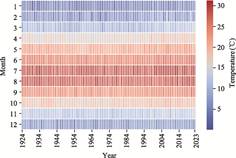
approximately 1.0 ??/100a. As shown in Figure 4, obvious seasonal changes
occurred in the distribution of the monthly mean temperature at Jiujiang
Meteorological Station. The temperature was markedly higher in summer
(June?CAugust) and notably lower in winter (December?CFebruary), showing typical
monsoon climate characteristics. Additionally, from the late 20th century to
the early 21st century, both the duration and the intensity of high
temperatures in summer increased. This change is consistent with the
characteristics of regional climate change under the background of global
warming.
|
|
|
|
Figure 3
Statistical analysis of the yearly mean temperature at Jiujiang
Meteorological Station (1924?C2023)
|
Figure 4
Statistics of the homogenized monthly mean temperature data at
Jiujiang Meteorological Station (1924?C2023)
|
The trend of temperature change in different
periods and the results of the statistical significance test are shown in Figure 5. Red columns
indicate significant temperature change at the significance level of ??=0.05;
blue columns indicate temperature change that did not reach the significance
level. It is evident from Figure 5 that temperature showed a statistically
significant upward trend during January?CJune (especially during February?CApril), October?CNovember, and throughout the entire year. This may
be related to the intensified trend of climate warming, with faster warming in
winter and spring, and delayed heat release in autumn, leading to significant
temperature increases during these periods. During July?CSeptember and in
December, the temperature changed only a little, and it even showed a downward
trend in August. In these periods, the change trend did not reach the significance
level. This is likely due to the fact that in summer, the region is under the
control of stable weather systems such as the subtropical high, resulting in
relatively small interannual variations in temperature. In December, which is
early winter, cold air activities are frequent but their intensity and duration
vary from year to year, leading to non-significant temperature changes.
4.3 Data Validation
The correlation coefficient, root mean square
error, and standard deviation can reflect the performance of this dataset in
different periods. As shown in Table 2, the correlation coefficient of this
dataset for the annual average data from 1924 to 2023 was 0.94, indicating
strong correlation between this dataset and the reference station. The
full-year root mean square error of 0.27 indicates that the mean deviation
between this dataset and the reference station was small; the standard
deviation of 0.59 indicates that the volatility of the full-year data was low.
For the monthly data, the range of the
correlation coefficient was 0.88?C0.98, and the correlation coefficient of the
winter half year was higher than that of the summer half year, indicating that
this dataset has stronger correlation with the reference station in the winter
half year. The root mean square error range was 0.46?C1.13, with the smallest
(largest) value in spring (winter), indicating that the value in spring is
closest to that of the reference station, while the error is largest in winter.
This is due to the fact that in spring, temperatures gradually warm up and the
changes are relatively smooth, resulting in smaller root-mean-square errors
(RMSE) compared to the reference station. In winter, temperatures are lower and
are affected by cold air, leading to greater temperature fluctuations and
larger RMSE compared to the reference station. The standard deviation range was
0.97?C1.9, with the lowest (highest) value in June (February), indicating less
(more) fluctuation of the data.
Table
2 Comparison of monthly and yearly mean temperatures
of Jiujiang Meteorological Station (1924?C2023) with those of reference stations
|
Monthly/Yearly
|
Correlation coefficient
|
Root mean square error (??C)
|
Standard deviation (??C)
|
|
1
|
0.97
|
1.09
|
1.42
|
|
2
|
0.98
|
0.77
|
1.90
|
|
3
|
0.97
|
0.46
|
1.60
|
|
4
|
0.94
|
0.50
|
1.30
|
|
5
|
0.93
|
0.50
|
1.18
|
|
6
|
0.91
|
0.82
|
0.97
|
|
7
|
0.92
|
0.53
|
1.22
|
|
8
|
0.90
|
0.63
|
1.11
|
|
9
|
0.88
|
0.55
|
1.09
|
|
10
|
0.91
|
0.63
|
1.09
|
|
11
|
0.95
|
0.89
|
1.24
|
|
12
|
0.97
|
1.13
|
1.39
|
|
Annual average
|
0.94
|
0.27
|
0.59
|
5 Discussion and Conclusion
In this study, a homogenized monthly/yearly
mean temperature dataset for 1924?C2023 was constructed for Jiujiang
Meteorological Station in Jiangxi Province, China. The ??China Temperature Data??
record, ??Tianqing?? meteorological big data cloud platform of the National
Meteorological Information Center, and centennial homogenized data of
neighboring stations were comprehensively applied to interpolate missing data
using the standardized sequential method. Additionally, RHtest V4 software was
used to test and correct the homogeneity of the sequence, thereby ensuring
continuity and reliability of the time series. Verification results showed that
this dataset has strong correlation with the reference station (yearly
correlation coefficient: 0.94) and a small root mean square error (0.27).
Therefore, it can better reflect the characteristics of climate change in the Jiujiang
region over the past century.
This study found that temperature change at the
Jiujiang Meteorological Station has obvious seasonal characteristics, with
statistically significant higher temperatures in summer (June?CAugust) and
statistically significant lower temperatures in winter (December?C February),
reflecting the typical characteristics of the East Asian monsoon climate. From
the long-term trend (except in August), the mean temperature at Jiujiang
Meteorological Station in each month showed an upward trend, especially during
February?CApril when the most statistically significant temperature rise
occurred, which is consistent with the regional characteristics of large
temperature rise in spring and winter under the background of global warming.
However, the temperature change during July?CSeptember was small, especially in
August when there was a downward trend, and it failed to reach the significance
level, which might reflect the complexity of the region being affected by local
climate change or monsoon variability in summer. Additionally, both the
duration and the intensity of high temperatures in summer from the late 20th
century to the early 21st century increased, further indicating that the
regional climate is being affected profoundly by global warming.
Despite major progress being achieved, this study had
certain limitations. For example, owing to the diverse sources and insufficient
metadata information of meteorological data prior to 1951, the verification and
correction of breakpoints depended on the statistical characteristics of the
series, which might have had certain impact on the accuracy of the results.
Moreover, the potential impact of extreme climatic events on data homogeneity
needs further exploration. In future studies, higher-resolution climate
simulations should be combined with observational data to examine the driving
mechanism and response characteristics of regional climate change, thereby
providing more precise scientific support for the formulation of policies
intended to address climate change.
Author Contributions
Xu, B. and Dong, B. H. completed the overall design for the
development of the dataset. Zhan, L. F. collected and processed the Jiujiang
temperature data, and designed the model and the algorithm. Zhan, L. F. and Li,
Y. completed the data verification. Zhan, L. F., Xin, J. J. and Wang, L. Y. wrote
the data paper.
Conflicts of Interest
The
authors declare no conflicts of interest.
References
[1]
Arnella, N. W., Lowe, J. A.,
Challinor, A. J., et al. Global and regional impacts of climate change
at different levels of global temperature increase [J]. Climatic Change,
2019, 155(3): 377?C391.
[2]
Pan, X. D. A review of future
climate change research based on regional climate models [J]. Plateau
Meteorology, 2018, 37(5): 1440?C1448.
[3]
Ren, G., Chan, J. C. L.,
Kubota, H., et al. Historical and recent change in extreme climate over
East Asia [J]. Climatic Change, 2021, 168(3): 1?C19.
[4]
Zhang, J. L., Liu, B., Ren, S.
Q., et al. A 4 km daily gridded meteorological dataset for China from
2000 to 2020 [J]. Scientific Data, 2024, 11(1): 1230.
[5]
Tang, G. L., Ding, Y. H., Wang,
S. W., et al. Comparative analysis of temperature curves in China over
the past century [J]. Advances in Climate Change Research, 2009, 5(2):
71?C78.
[6]
Si, P., Hao, L. S., Luo, C. J.,
et al. Interpolation and homogeneity correction of missing temperature
records at Baoding Meteorological Station in Hebei [J]. Advances in Climate
Change Research, 2017, 13(1): 41?C51.
[7]
Li, Q. X. Current status and
prospects of homogeneity research in Chinese climate data [J]. Meteorological
Science and Technology, 2016, 6(3): 67?C74.
[8]
Shen, Y. L. Construction and
evaluation of a high-resolution meteorological element grid dataset for Qinghai
Province [J]. Meteorological Science and Technology, 2023, 13(4): 29?C33.
[9]
Wang, H. J., Tu, S. Y., Chen,
Z. H. Experiment and error analysis of interpolation methods for missing daily
temperature data [J]. Meteorology, 2008, 34(7): 83?C91.
[10]
Wang, Y. P. Comparison and
homogeneity analysis of observation data from old and new meteorological
stations in Gansu Province [J]. Plateau Meteorology, 2023, 42(2): 506?C514.
[11]
Zhan, L. F., Xu, B., Dong, B.
H., et al. Centennial homogenized monthly/yearly mean temperature dataset
at Jiujiang Meteorological Station, Jiangxi Province of China (1924?C2023) [J/DB/OL].
Digital Journal of Global Change Data Repository, 2024.
https://doi.org/10.3974/geodb.2024.12.03.V1.
[12]
GCdataPR Editorial Office.
GCdataPR data sharing policy [OL]. https://doi.org/10.3974/dp.policy.2014.05
(Updated 2017).
[13]
Central Weather Bureau. China
Temperature Data [M]. Beijing: Central Weather Bureau, 1954.
[14]
China Meteorological
Administration. CAAC meteo data services [OL]. http://www.weatherdt.com. cn/ datasource.html.
[15] Institute of Atmospheric Physics, Chinese Academy of Sciences. CAAC meteo data services [OL]. http://www.weatherdt.com.cn/datasource.html.
[16]
Li,
Z., Yan, Z. W., Cao, L. J., et al. Further-adjusted long-term temperature
series in China based on MASH [J]. Advances in
Atmospheric Sciences, 2018, 35(8): 909?C917.
[17]
Yu, Y., Li, J., Ren, Z. H., et
al. Application of standard series method in interpolation of missing daily
average temperature data [J]. Meteorology, 2012, 38(9): 1135?C1139.
[18]
Si, P., Xie, Y. Y. Homogeneity
analysis of total solar radiation data in Tianjin [J]. Climate and
Environment Research, 2015, 20(3): 269?C276.
[19]
Wang, X. L., Chen, H., Wu, Y., et
al. New techniques for the detection and adjustment of shifts in daily precipitation
data series [J]. Journal of Applied Meteorology and Climatology, 2010,
49(12): 2416?C2436.