Development and Validation of the Wireless Sensor Network
Dataset of Leaf Area Index in Shandong Yucheng of China (2020)
Li, R. X.1,2 Zhou, X.1* Lyu, T. T.1 Tao, Z.1 Wang, J.1 Xie, F. T.1,2
1. Aerospace Information
Research Institute, Chinese Academy of Sciences, Beijing 100101, China;
2. School of
Electronic, Electrical and Communication Engineering, University of Chinese
Academy of Sciences, Beijing 100049, China
Abstract: With the development of communication
technology, ground measurement based on Wireless Sensor Network (WSN)
technology has become an important method for obtaining ground surface
parameters. With its advantages of long-term and multi-point simultaneous
observation, WSN provides reliable data for the validation of remote sensing satellite
LAI products. However, unexpected situations such as dead batteries,
communication failures or weather influence will cause the measurement data to
be unstable, so it is necessary to process a large amount of raw data into
relatively true value representing the ground measurement. In this paper, three
nodes (0803, 0804 and 0805) are arranged in Yucheng Station of Shandong
province of China from May to November 2020, and the LAI WSN system SBLX-034 is
used for observation. First, we select the observation between 10 a.m. and 3 p.m.,
and filter out invalid data for each node. Then, according to the temporal and
spatial correlation between the notes, the abnormal time data with NARX model
prediction error more than 1 is eliminated, and the LSTM neural network is used
to test the processed data pattern. Finally, the daily data are averaged into
the measured relative true value of long-term LAI, which is used to provide
data support for related research. This dataset is the processed WSN data of
0803, 0804 and 0805 notes in Shandong Yucheng Station, including: (1)
geographical location of three WSN nodes in Yucheng Station; (2) daily LAI of
three nodes from May to November in 2020. The storage format is .xlsx, .shp and
.kml data formats, and consists of 10 files with a data volume of 49.1 KB
(compressed into one file, 42.5 KB).
Keywords: Shandong
Yucheng; LAI; observation nodes; daily average; ground observation
DOI: https://doi.org/10.3974/geodp.2021.02.04
CSTR: https://cstr.escience.org.cn/CSTR:20146.14.2021.02.04
Dataset Availability Statement:
The dataset supporting this paper was published and
is accessible through the Digital Journal
of Global Change Data Repository at: https://doi.org/10.3974/geodb.2021.03.01.V1
or https://cstr.escience.org.cn/CSTR:20146.11.2021.03.01.V1.
1 Introduction
Leaf
Area Index (LAI) is usually defined as half of the total green leaf area per
unit surface area[1], which is an important parameter to describe
the structure and function of vegetation canopy[2]. Since leaf is
the main channel for energy and material exchange between the land surface and
atmospheric boundary layer (such as water and carbon dioxide), LAI is also a
key input factor for most land surface ecological models[3–6]. With
the rapid development of satellite technology and sensor performance, various
global LAI products have been generated from satellite data using various
inversion models. However, due to the accuracy limitation of data acquired by
sensors and instability of inversion model, LAI products itself contains a
certain degree of error[7,8]. In order to evaluate the data quality
better and expand the application filed, it is necessary to validate LAI
products. The validation of remote sensing products requires to obtain the
relative truth value which can represent the ground target. Due to the
limitation of ground observation cost, the traditional LAI field measurement
cannot meet the requirements of continuous long-term measurement. With the
development of communication technology, WSN has been used in the observation
experiments of sites. The ground measurement method based on WSN technology can
ensure the continuous observation of parameters, realize long-term and stable
multi-point synchronous observation, and facilitate the comparative analysis of
multi-point data, so as to provide more reliable ground observation technique
for validation.
Vegetation
growth is a complex biological process, which is affected by many environmental
factors. In the field experiment, LAI is measured every 5 minutes. The performance
of plant leaves is different under different natural conditions. Even between
10 a.m. and 3 p.m., wind speed, wind direction and sunlight conditions will
affect the tilt degree and opening angle of leaves, which will lead to unstable
measurement results of LAI by WSN. At present, the research using vegetation
WSN data at home and abroad usually adopts the method of setting a few days of
aggregation sliding window when the time resolution requirement is not high[9].
Most of the other researches with days or hours as the cycle adopt the method
of averaging interpolation values over a period of time[10–13], but
there is a certain subjectivity in the process of removing outliers. In order
to solve this problem, this paper uses the WSN data of Yucheng Comprehensive
Experimental Station in Shandong province from May to November in 2020 to
filter the effective data, eliminate outliers, and better retain original data
under the premise of ensuring the original trend.
2 Metadata of the Dataset
The
metadata of the Leaf area index daily dataset from observation nodes in Yucheng
of Shandong province, China (2020)[14] is summarized in Table 1. It
includes the dataset full name, short name, authors, year of the dataset,
temporal resolution, spatial resolution, data format, data size, data files,
data publisher, and data sharing policy, etc.
3 Methods
3.1 Operating Principle of the
LAI Sensor Network System
The LAI sensor network system SBLX-034
relies on advanced fish-eye photography technology, which uses image processing
technology to quickly analyze the vegetation canopy, obtains canopy structure
information in real time, and uses self-developed technology to accurately
segment the image. It greatly eliminates the influence of flares under strong
light conditions, improves the analysis accuracy, and obtains a variety of
vegetation parameters including LAI.
Table 1 Metadata Summary of the Leaf
area index daily dataset from observation nodes in Yucheng of Shandong province,
China (2020)
|
Items
|
Description
|
|
Dataset
full name
|
Leaf area index daily dataset
from observation nodes in Yucheng of Shandong province, China
|
|
Dataset
short name
|
LAI_YuCheng_2020_0501-1108
|
|
Authors
|
Li,
R. X. ABH-7136-2020, Aerospace Information Research Institute, Chinese
Academy of Sciences, liruoxi19@mails.ucas.ac.cn
Zhou,
X. L-7359-2016, Aerospace Information Research Institute, Chinese Academy of
Sciences, zhouxiang@radi.ac.cn
Lyv,
T. T. R-8978-2016, Aerospace Information Research Institute, Chinese Academy
of Sciences, lvtt@radi.ac.cn
Tao,
Z. L-4530-2016, Aerospace Information Research Institute, Chinese Academy of
Sciences, taozui@radi.ac.cn
Wang,
J. ABH-9051-2020, Aerospace Information Research Institute, Chinese Academy
of Sciences, wangjin01@radi.ac.cn
Xie,
F. T. ABH-7123-2020, Aerospace Information Research Institute, Chinese
Academy of Sciences, xieft@radi.ac.cn
|
|
Geographical
region
|
Chinese
Academy of Sciences Leaf Area Index Ground Observation Network Shandong
Yucheng Comprehensive Experimental Station
|
|
Year
|
2020
|
|
Temporal
resolution
|
1 day
|
|
Data
format
|
.xlsx, .shp, .kml
|
|
Data
size
|
42.5
KB
|
|
Data
files
|
(1)
Geographic location data of three wireless sensor network nodes
(2)
Daily LAI of three nodes from May to November in 2020
|
|
Foundations
|
Ministry
of Science and Technology of P. R. China (2018YFE0124200);
Chinese
Academy of Sciences (2020)
|
|
Data
publisher
|
Global Change Research Data Publishing &
Repository, http://www.geodoi.ac.cn
|
|
Address
|
No.
11A, Datun Road, Chaoyang District, Beijing 100101, China
|
|
Data
sharing policy
|
Data from
the Global Change Research Data Publishing & Repository includes metadata, datasets
(in the Digital Journal of Global Change Data Repository), and
publications (in the Journal of Global Change Data & Discovery). Data sharing policy
includes: (1) Data are openly available and can be free downloaded via the
Internet; (2) End users are encouraged to use Data subject to
citation; (3) Users, who are by definition also value-added service
providers, are welcome to redistribute Data subject to written permission
from the GCdataPR Editorial Office and the issuance of a Data redistribution
license; and (4) If Data are used to compile new
datasets, the ??ten per cent principal?? should be followed such that Data
records utilized should not surpass 10% of the new dataset contents, while
sources should be clearly noted in suitable places in the new dataset[15]
|
|
Communication
and
searchable system
|
DOI, CSTR, Crossref, DCI, CSCD,
CNKI, SciEngine, WDS/ISC, GEOSS
|
The sensor network system consists of
processing center, node manager and sensor nodes. A large number of sensor
nodes are distributed with high density in the monitoring area, and the network
is automatically formed. When the sensor nodes get commands from the node
manager, the data collectors will perform preliminary processing, and then
transmits it to the node managers, level by level among the nodes. The node
manager collects and organizes the monitoring data of all sensor nodes in the
network, and finally reaches the data processing center through the external
network, where the administrator performs batch processing. All sensor nodes
adopt automatic observation mode, and obtain observation data every 5 minutes.
This system mainly uses the single-angle method
to estimate LAI. LAI is related to canopy porosity and plant leaf tilt angle,
so the expression of LAI can be indirectly derived. The leaf tilt angles of
common plants can generally be divided into the following five situations: ?? The
leaves are distributed horizontally, and the leaf tilt angles are all 0??; ??The
leaves are distributed vertically, and the leaf tilt angles are all 90??; ?? The
leaves are distributed in a cone shape, and the leaf tilt angles are between 0?? and
90??; ?? The
leaves are distributed in a spherical shape, which is a very uniform
distribution method. In this distribution method, all leaves have no specific
angle, which is a continuous random distribution; ?? The
leaves are distributed in an ellipsoid shape which are all distributed on a
continuous ellipsoidal surface. In these five cases, the azimuth is random. The
fifth case is general, and the others are special. Campbell used the
ellipsoidal distribution function to simulate the leaf tilt angle distribution[16],
and expanded the projection function as shown in the following equation (1):
 (1)
(1)
where G(q) represented
the projected acreage which was calculated by the direction q and projection in this direction ; x was
the ratio of the horizontal semi-axis and the vertical semi-axis of the
ellipsoid. The larger x indicated that the canopy leaf tilt angle tend to
be horizontally distributed, and the smaller x indicated that tends to
be vertically distributed. Wang deduced the relationship between x and
the average leaf tilt according to the leaf tilt density function and
other relation[17], as shown in the following equation (2):
according to the leaf tilt density function and
other relation[17], as shown in the following equation (2):
 (2)
(2)
The value of projection function always equaled
to 0.5 when reached 57.5?? which meant that the value of projection function can be
approximately regarded as independent of the plant leaf tilt angle. The single
angle method was to derive the calculation equation of LAI based on the
characteristic of the projection function, as shown in the following equation
(3):
 (3)
(3)
where T represented the
transmittance, and the plant LAI can be calculated according to equation (3).
3.2 Data Collection
Yucheng Comprehensive Experimental Station
is located in Shandong province in warm temperate semi-humid monsoon climate
zone. Winter wheat and summer maize are the main plants in the typical and
representative area of the Huanghuaihai Plain. The WSN layout of Yucheng
Station is shown in Figure 1. This dataset includes more than 300,000 valid raw
data of the LAI WSN from May 1 to November 8, 2020. The measurement data
includes: nodes latitude and longitude, data collection time, air temperature
and LAI. Due to unexpected battery failure, communication failure or weather
influence, some data was missing or invalid. Therefore, three nodes (0803,
0804, and 0805) with relatively better data quality were selected for
processing, and there were more than 90,000 valid raw data.
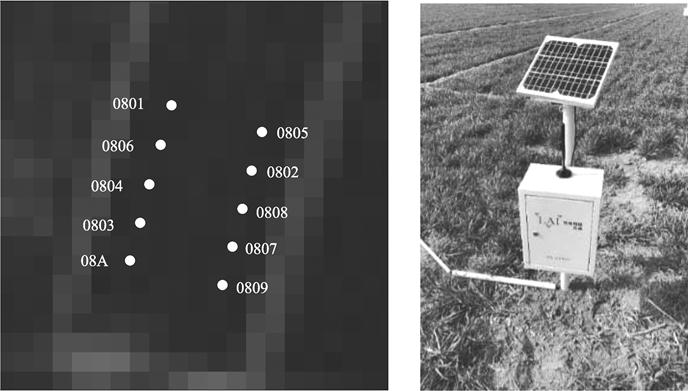
Figure 1 WSN layout of Yucheng Station
3.3 Data Processing Method
The processing of LAI WSN dataset of
Shandong Yucheng Station (2020) is shown in Figure 2.
|

Figure 2 Data processing flowchart
|
First, we select the data of the three stations
with observation time from 10 a.m. to 3 p.m., a total of 20,610 pieces of raw
data. Since each node is affected by the environment to varying degrees, the data-lack
moment is different. It is necessary to filter the moments when valid data co-occur
at the three sites, this results a total of 4,576 moments with 13,728 pieces of
raw data.
Then, according to the temporal and spatial
correlation between nodes, the time-series neural network NARX is used to
model. After adjusting the model to minimize the error, the final parameter
settings are as follows: 80% of the data is used for the training of the neural
network, and 10% is used to verify whether the network is generalizing, and
stop training before that, 10% will be used for external verification; the
hidden layer has 10 nodes; the delay number is set to 2 moments; the kernel
function of the model is Bayesian regularization. The neural network modeling
accuracy is shown in Figure 3. The model accuracy of the training set is
0.935,39, the model accuracy of the test set is 0.920,53, and the overall
modeling accuracy is 0.933,91, indicating that the WSN measured LAI in-situ
data has a strong time regularity. This time correlation can be characterized
by the NARX model and the simulation effect is good. The data with the
prediction error of the neural network model greater than 1 is regarded as
abnormal moments. The 0803 node screened out 65 abnormal moments, the 0804 node
screened out 57 abnormal moments, and the 0805 node screened out 28 abnormal
moments. After the three nodes were merged, a total of 130 moments were
eliminated, leaving 4446 moments with 13,338 valid original data.
Finally, the daily raw measurement data after the
above processing is averaged as the relative true value of the LAI ground
measurement on the day, that is a total of 170 days with 510 site data, so as
to better verify the authenticity of the product on the time series.
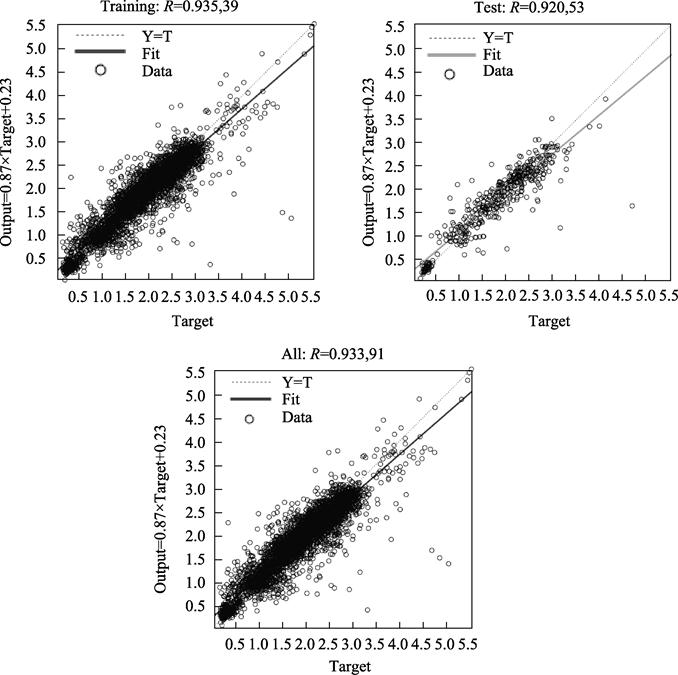
Figure 3 Modeling accuracy of neural network
4 Data Results and Validation
4.1 Data Composition
This dataset includes: (1) geographic
location data of three wireless sensor network nodes; (2) daily LAI of three nodes
from May to November in 2020.
4.2 Data Products
The LAI of the
note ID 0803 (36??50'2.4174"N, 116??34'56.1"E), note ID
0804 (36??50' 3.048"N, 116??34'56.316"E) and note
ID 0805 (36??50'4.7682"N, 116??34'54.84"E) in
Shandong Yucheng Station were daily recorded from May to November 2020.
4.3 Data Validation
In order to ensure that the processed data still has a
strong spatio-temporal correlation, the LSTM time series neural network is used
to model the 13,338 valid data after the abnormal value is eliminated. If the
model has a accuracy, low prediction error and high prediction correlation, then
it is considered that the processed data has been improved. The parameters are
set as follows: the first 80% of the continuous time series is used for
training, and the remaining 20% is used for testing; the solver is used for 250
rounds of training; in order to prevent the gradient from exploding, the
gradient threshold is set to 1; the initial learning rate is specified as
0.005. After 125 rounds of training, the learning rate is reduced by
multiplying by a factor of 0.2; the specified LSTM layer has 200 hidden units.
The prediction accuracy of the trained model is 0.83. It can be considered that
the processed WSN data retains the changes and relevance of the original measured
data.
5 Discussion and Conclusion
This article described
the data development of the LAI WSN of Shandong Yucheng Station from May to
November 2020, and sets the model error threshold through the time-series
neural network NARX. In consideration of retaining as much ground measurement
data as possible, this article eliminates 3% of the original data, that is,
extreme abnormal points. The LSTM neural network modeling test has a good data
law after the elimination. Finally, the data within a day is averaged to obtain
a long-term series of continuous measured ground relative truth values as data
support for related research.
This dataset can be applied to the point-to-point validation
of LAI products of different scales, and has obvious advantages in the test of
long-term series, such as studying the changes in the accuracy of satellite
products at different vegetation growth stages. In addition, due to the
different environments of the three nodes, the missing data is also at
different times, so the processed valid data only accounts for 64% of the
original data. Among them, the lack of data caused by external factors is force
majeure, but with the continuous development of communication technology and
deep learning principles, how to use existing data to better interpolate
missing values and improve the utilization of data is a problem worthy of
research.
Author Contributions
Zhou, X. and Lyu, T. T. made the overall design for the
development of the dataset; Li, R. X. processed the LAI WSN data and verified
the data; All the authors wrote the data paper.
Conflicts
of Interest
The authors declare no
conflicts of interest.
References
[1]
Chen, J.
M., Black, T. A. Defining leaf area index for non-flat leaves [J]. Plant, Cell & Environment, 1992, 15(4): 421‒429.
[2]
Garrigues,
S., Lacaze, R., Baret, F., et al.
Validation and intercomparison of global leaf area index products derived from
remote sensing data [J]. Journal of
Geophysical Research, 2008, 113: G02028.
[3]
Liu, J.,
Chen, J. M., Cihlar, J., et al. A
process-based boreal ecosystem productivity simulator using remote sensing
inputs [J]. Remote Sensing of Environment,
1997, 62(2): 158‒175.
[4]
Andrew, D.,
Richardson, R. S., Anderson, M., et al.
Terrestrial biosphere models need better representation of vegetation
phenology: results from the North American carbon program site synthesis [J]. Global Change Biology, 2012, 18(2):
566‒584.
[5]
Sellers, P.
J., Dickinson, R. E., Randall, D. A., et
al. Modeling the exchanges of energy, water, and carbon between continents
and the atmosphere [J]. Science,
1997, 275(5299): 502‒509.
[6]
Bonan, G.
B. Land-Atmosphere interactions for climate system models: coupling
biophysical, biogeochemical, and ecosystem dynamical processes [J]. Remote Sensing of Environment, 1995, 51(1):
57‒73.
[7]
Friedl, M.
A., Davis, F. W., Michaelsen, J., et al.
Scaling and uncertainty in the relationship between the NDVI and land surface
biophysical variables: an analysis using a scene simulation model and data from
FIFE [J]. Remote Sensing of Environment,
1995, 54(3): 233‒246.
[8]
Ding, Y. L.
Remote sensing estimation of vegetation coverage and its authenticity
verification [D]. Changchun: Graduate School of Chinese Academy of Sciences
(Northeast Institute of geography and agricultural ecology), 2015.
[9]
Shi, Y. C.,
Wang, J. D., Qin, J., et al. An
upscaling algorithm to obtain the representative ground truth of LAI time
series in heterogeneous land surface [J].
Remote Sensing, 2015, 7(10): 12887‒12908.
[10]
Zhang, J.
L., Liu, Q., Li, X. H., et al.
Calibration and data validation of wireless sensor network [P]. Intelligent
Earth Observing Systems, 2015.
[11]
Dou, B. C.,
Wen, J. G., Li, X. H., et al.
Wireless sensor network of typical land surface parameters and its preliminary
applications for coarse-resolution remote sensing pixel [J]. International Journal of Distributed Sensor
Networks, 2016, 12(4): 55‒60.
[12]
Zhou, S. Y.
Spatiotemporal variation of soil moisture based on improved thermal inertia
model [D]. Kaifeng: Henan University, 2018.
[13]
Qu, Y.,
Zhu, Y., Han, W., et al. Crop leaf
area index observations with a wireless sensor network and its potential for
validating remote sensing products [J]. IEEE
Journal of Selected Topics in Applied Earth Observations & Remote Sensing, 2014, 7(2): 431‒444.
[14]
Li, R. X.,
Zhou, X., Lyu, T. T., et al. Leaf area index daily dataset from observation nodes in Yucheng of
Shandong province, China (2020) [J/DB/OL].
Digital Journal of Global Change Data
Repository, 2021. https://doi.org/10.3974/ geodp.2021.03.01.V1.
https://cstr.escience.org.cn/CSTR:20146.11.2021.03.01.V1.
[15]
GC dataPR
Editorial Office. GC dataPR data sharing policy [OL].
https://doi.org/10.3974/dp.policy. 2014.05 (Updated 2017).
[16]
Campbell, G.
S. Extinction coefficients for radiation in plant canopies calculated using an
ellipsoidal inclination angle distribution [J]. Agricultural and Forest Meteorology, 1986, 36(4): 317‒321.
[17]
Wang, Y.
P., Jarvis, P. G. Mean leaf angles for the ellipsoidal inclination angle
distribution [J]. Agricultural and Forest
Meteorology, 1988, 43(3): 319‒321.