Liu,
Y. X. Y.1 Yang, F.2*
1. State Key Laboratory of Resources
and Environmental Information System, Institute of Geographic Sciences and
Natural Resources Research, Chinese Academy of Sciences, Beijing 100101, China;
2. Key Laboratory of Land
Surface Pattern and Simulation, Institute of Geographic Sciences and
Natural Resources Research, Chinese Academy of Sciences, Beijing 100101, China
Abstract: The Shimen
Realgar Mine, located in Hunan Province, is the largest single-arsenic (As)
mine in Asia, with a mining history spanning over 1,500 years. Long-term and
large-scale mining activities, coupled with industrial operations such as
phosphate fertilizer and cement production, have led to extensive and severe As
contamination in the surrounding areas. In 2015, we collected 21 surface water
samples, 19 sediment samples, and 28 surface soil samples along the Huangshui
stream and the Zaoshi Reservoir near the mine. Water quality parameters were
measured using a YSI6600V2 multi-parameter analyzer, while the concentrations
of heavy metals were analyzed in the laboratory using a combination of
inductively coupled plasma-optical emission spectrometer (ICP-OES) and
inductively coupled plasma-mass spectrometer (ICP-MS). The dataset includes:
(1) geo-information of the sampling sites for surface water, sediment, and soil
samples; (2) physical and chemical properties of surface water, including pH,
water temperature, dissolved oxygen, total phosphorus, and total nitrogen; (3)
physical and chemical properties of sediment and surface soil, including pH and
organic matter content; (4) heavy metal concentrations (As, Cr, Cd, Pb, Zn, Ni,
Mn, etc.) in surface water, sediment, and soil; and (5) heavy metal pollution
assessment for soil, including geo-accumulation, single-pollution, Nemerow, and
potential ecological risk indices. The dataset is archived in .kmz, .shp, and
.xlsx formats, and consists of 25 data files with data size of 122 KB
(Compressed into one file with 98 KB).
Keywords: Shimen Realgar Mine; surface water; sediment; soil
DOI: https://doi.org/10.3974/geodp.2025.01.13
Dataset Availability Statement:
The dataset
supporting this paper was published and is accessible through the Digital Journal of
Global Change Data Repository at:
https://doi.org/10.3974/geodb.2024.11.08.V1.
1 Introduction
The Shimen Realgar Mine, located in
northwestern Hunan Province, is the largest realgar (As4S4)
deposit in Asia. It has been mined for over 1,500 years, resulting in elevated metal
concentrations in the surrounding environment[1]. As an independent arsenic deposit, the mine has an average arsenic grade of 75% and an ore reserve of 730,000 tons[2].
Large-scale mining and smelting operations began in 1958, with an annual ore processing capacity of 15,000 tons and the production of approximately 3,000 tons of raw ore[3]. Over time, the 300,000 tons realgar reserve has nearly been depleted, and resources are now nearing exhaustion. The arsenic smelting plant was closed in 1978, and the mine
itself was
officially shut down in 2001. Years of mining and smelting activities have resulted in significant As contamination of the local water and soil, causing
persistent environmental pollution[4].
In response, the ??12th Five-Year Plan for Comprehensive Prevention and Control of Heavy Metal Pollution?? was lauched in 2012 to
address this issue. The plan focuses on
cleaning up historical As slag and treating the contaminated surrounding soil
and river channels. Given the extent of contamination, monitoring and investigation the
physical and chemical properties of water, sediment, and
soil in the area is crucial. This will provide a comprehensive understanding of the current pollution levels in the Shimen Realgar Mine and aid in controlling further
environmental degradation. In May 2015, a dataset was gathered through on-site monitoring of
surface water samples, sediments, and soil from upstream to downstream along the Huangshui stream to the Zaoshi Reservoir. Multiple pollution assessment methods were employed to evaluate the ecological risks posed by the heavy metals.
2 Metadata of the Dataset
The
metadata of Heavy metals and its environment risk assessment on Shimen Realgar
Mine, Hunan Province of China[5] is summarized in Table 1. This
includes the dataset full name, short name, authors, year of the dataset, data
format, data size, data files, data publisher, and data sharing policy, etc.
3 Methods
In May 2015, we collected 21 surface water
samples, 19 sediment samples and 28 surface soil samples from upstream to
downstream along the Huangshui stream to the Zaoshi Reservoir. The sampling
network was intensified surrounding the stone-representative zones of the
Shimen Realagr Mine (Figure 1), with on-site monitoring conducted
for surface water, sediment, and soil samples at all locations.
3.1 Sampling and
Preprocessing
At each site, surface water was sampled
within 20 cm of the surface using a clean 500-mL polyethylene bottle. In situ measurements of Temperature (T), pH,
dissolved oxygen (DO), and chlorophyll-a (Chl-a) were determined using a
multiple water quality analyzer (Aquaread AP-2000, UK). For further analysis,
approximately 400 mL of the water sample was filtered through a 0.45-??m filter.
Soil and sediment samples were immediately transported to the laboratory after
collection, where stone and plant debris were removed. The samples were then
air-dried, sieved, and stored in clean polyethylene bags for subsequent
experiments.
Table 1 Metadata summary of the Heavy metals and its environment
risk assessment on Shimen Realgar Mine, Hunan Province of China
|
Items
|
Description
|
|
Dataset full name
|
Heavy metals and its environment risk assessment on
Shimen Realgar Mine, Hunan Province of China
|
|
Dataset short name
|
HMsShimenRealgarMine2015
|
|
Authors
|
Liu, Y. X. Y., Institute of Geographic Sciences and
Natural Resources Research, Chinese Academy of Sciences, lyxy@lreis.ac.cn
Yang, F., Institute of Geographic Sciences and
Natural Resources Research, Chinese Academy of Sciences, yangf@igsnrr.ac.cn
|
|
Geographical region
|
Shimen County in Hunan Province
|
|
Year
|
2015
|
|
Data format
|
.kmz, .shp, .xlsx
|
|
|
|
Data size
|
122 KB
|
|
|
|
Data files
|
(1) Information on the sampling sites for surface
water, sediment, and soil samples; (2) physical and chemical properties of
surface water; (3) physical and chemical properties of sediment and surface
soil; (4) heavy metal concentrations in surface water, sediment, and soil;
and (5) heavy metal pollution assessment for soil, and potential ecological
risk indices
|
|
Foundation
|
National Natural Science Foundation of
China (41571470)
|
|
Data publisher
|
Global Change
Research Data Publishing & Repository, http://www.geodoi.ac.cn
|
|
Address
|
No. 11A, Datun Road, Chaoyang District,
Beijing 100101, China
|
|
Data sharing policy
|
(1) Data are openly available and
can be free downloaded via the Internet; (2) End users are encouraged to use Data subject to citation; (3) Users, who
are by definition also value-added service providers, are welcome to
redistribute Data subject to written permission from the GCdataPR
Editorial Office and the issuance of a Data redistribution license; and
(4) If Data are used to
compile new datasets, the ??ten percent principal?? should be followed such
that Data records utilized should not surpass 10% of the new
dataset contents, while sources should be clearly noted in suitable places in
the new dataset[6]
|
|
Communication and
searchable system
|
DOI, CSTR, Crossref, DCI, CSCD, CNKI, SciEngine, WDS,
GEOSS, PubScholar, CKRSC
|
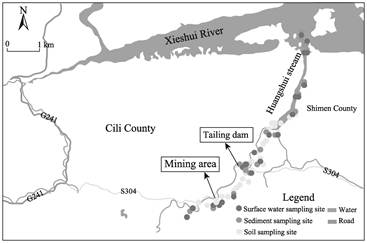
Figure 1 Map of sampling sites
distribution in Shimen Realgar Mine (2015)
3.2 Analytical Methods
Soil pH was measured in a
1:2.5 (soil : water) mixture, and total organic matter (TOM) content was
determined using the Walkley-Black method. For heavy metal analysis,
approximately 0.05 g of soil was digested with an acid mixture of HNO3 (5
mL), HF (5 mL) and HClO4 (1 mL) in 100-mL Teflon vessels. For biological samples,
200?C300 mg were weighed and digested with 9 mL
concentrated HNO3 and 1 mL HClO4. These samples were
evaporated at approximately 170 to 190 ?? to near dryness.
If necessary, 3 mL HNO3 was added until the solution was completely
cleared. The final heavy metal concentrations (Cd, Pb??Cr??Cu??Mn??Ni??Zn) were
determined using ICP-OES (Avio 200, Perkin Elmer, USA). For metals like Cd, Pb
and As were analyzed by using ICP-MS (PlasmaQuant MS, Analytik Jena AG,
Germany).
3.3 Assessment of Pollution Level
To comprehensively assess the
pollution levels in surface soils, several indices were calculated: the geo-accumulation
index (Igeo) (Table 2), single pollution index (PI), Nemerow integrated
pollution index (NIPI) (Table 3), potential ecological risk for individual
metals (EI), and potential ecological risk index (RI) (Table 4).
The index of Igeo was calculated to evaluate the degree
of PTE pollution compared to background levels, using the following equation[7]:
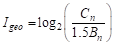 (1)
(1)
where, Cn
(mg/kg) is the metal concentration in soil, Bn (mg/kg)
is the background value of the element, and 1.5 is a factor to correct for
lithological influences.
Table
2 Classification of index of
geo-accumulation (Igeo)
|
Classification
|
Igeo
|
Pollution degree
|
|
0
|
Igeo <0
|
Uncontaminated
|
|
1
|
0??Igeo
<1
|
Uncontaminated to moderately contaminated
|
|
2
|
1??Igeo
<2
|
Moderately contaminated
|
|
3
|
2??Igeo
<3
|
Moderately contaminated to heavily
contaminated
|
|
4
|
3??Igeo
<4
|
Heavily contaminated
|
|
5
|
4??Igeo
<5
|
Heavily contaminated to extremely
contaminated
|
|
6
|
Igeo??5
|
Extremely contaminated
|
Table
3 Classification of single pollution index
(PI) and Nemerow integrated pollution index (NIPI)
|
Classification
|
PI
|
NIPI
|
Pollution degree
|
|
0
|
PI<0.7
|
NIPI<0.7
|
Uncontaminated
|
|
1
|
0.7<PI<1
|
0.7<NIPI<1
|
Warning
|
|
2
|
1<PI<2
|
1<NIPI<2
|
Low contaminated
|
|
3
|
1<PI<2
|
1<NIPI<2
|
Moderately
contaminated
|
|
4
|
PI>3
|
NIPI>3
|
Severe
contaminated
|
Table 4 Classification of potential ecological
risk of individual factor (EI) and potential ecological risk index (RI)
|
Ecological risk
|
Low
|
Moderate
|
Considerate
|
Very high
|
Dangerous
|
|
EI
|
<40
|
40?C80
|
80?C160
|
160?C320
|
>320
|
|
RI
|
<150
|
150?C300
|
300?C600
|
>600
|
|
The index of
PI for a single metal and the NIPI
for a combination of seven metals was calculated as the following equations[8]:
 (2)
(2)
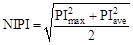 (3)
(3)
where, Ci (mg/kg)
is the metal concentration in the soil, Si (mg/kg) is the
soil risk screening value from the Soil Environmental Quality Risk Control
Standard for Soil Contamination of Agricultural Land (Trial) (GB15618??2018)[9],
PImax is the maximum value of PI and PIave is the average
value of PI.
The index of EI and RI was calculated using the
following equation[10]:
 (4)
(4)
 (5)
(5)
where, EIi
and CFi are the ecological risk factor and toxic
response factor of element i, respectively.
4 Data Results
4.1 Dataset Composition
This dataset contains the following: (1) geographical location data for surface water, sediment, and soil sampling points; (2) physical and chemical
properties of surface water pH, water temperature, dissolved oxygen, total
phosphorus, and total nitrogen; (3) physical and chemical
properties of sediment and surface soil, including pH and organic matter content; (4) heavy metal concentrations (As, Cr, Cd, Pb, Zn, Ni, Mn, etc.) in surface water,
sediment and soil; (5) soil heavy metal pollution assessment data, including geo-accumulation index, single pollution index, Nemerow
index, potential ecological risk index.
4.2 Data Products
(1) The surface water in the Huangshui stream and
Zaoshi Reservoir is alkaline, with pH ranging from 8.45 to 10.11. According to Environmental Quality Standards for Surface Water (GB3838??2002)[11], the concentrations of total phosphorus and total nitrogen indicate mesotrophic to eutrophic conditions. This is attributed to the
closure of the As smelting plant, which was later repurposed for sulfuric acid production for phosphate fertilizer. Consequently, the highest concentration of
total
phosphorus and total nitrogen were observed near the smelting and
tailing areas. A total of 7 phytoplankton phyla were identified in the
surface water, including Cyanophyta, Bacillariophyta,
Pyrrophyta, Chrysophyta, Cryptophyta, Euglenophyta,
and Chlorophyta. A previous study has
reported As concentration in the river water near the Shimen Realgar Mine as high as 15.8 mg/L in 1994[1]. Other study also
reported that the As concentration in this area reached 40.10 mg/L[12]. In this study, the highest As concentration in the surface water was found to be 3.29 mg/L, and the As concentration decreased with increasing distance from the mine and tailing dam.
(2) The sediment is generally weakly alkaline, with pH
ranging from 7.32 to 7.89. The average total organic matter content in the
sediment is 17.0 g/kg. The As concentrations in the sediment ranged from 43.42
to 4,543 mg/kg, with a noticeable decrease in As level as the distance from the
mine??s central area increases. According to the Soil Environmental Quality Risk
Control Standard for Soil Contamination of Agricultural Land (Trial) (GB15618?? 2018)[9], As concentrations above 40 mg/kg
indicate significant contamination. This suggests that the As concentration in
all collected sediments samples greatly exceeds the standard. Additionally,
studying the interstitial water in sediment is essential for understanding
migration of As at the water-sediment interface.
(3) The soil pH varied between 5.33 and 8.06, with organic
matter content ranging from 13.12 g/kg to 77.31 g/kg. The soils collected from
farmland areas contain a higher concentration of organic matter than those from
the mining area, the tailings dam and the riverbed. The highest As
concentration in the soil was found to be 5,008 mg/kg, significant higher than
the background value of As in Hunan Province??s soil (13.41 mg/kg). Previous
studies have reported As concentration as high as 5,240 mg/kg in the central
area of the Shimen Realgar Mine[13]. Consistent with distribution
patterns of As concentration in surface water and sediment, the highest As
concentrations in the soil were found near the mine??s central area and tailing
sites. As the distance from these area increased, As concentration in the soil
decreased, highlighting mining activities as a major source of local As
contamination. According to the Soil Environmental Quality Risk Control
Standard for Soil Contamination of Agricultural Land (Trial) (GB15618??2018), which sets the limit for As concentrations at 40 mg/kg
for Class III soil, the As levels in the collected soil samples seriously
exceeds this threshold. Long-term heavy metal pollution lead to nutrients loss,
damage to soil organisms, and functional degradation[14,15].
Therefore, remediation of As contamination in the soil at the Shimen Realgar
Mine is essential.
(4) The average concentration of heavy metals in the soil
surrounding the Shimen Realgar Mine are as follows: As (610 mg/kg), Cd (1.23
mg/kg), Pb (58.0 mg/kg), Cr (104 mg/kg), Cu (27.3 mg/kg), Ni (43.4 mg/kg), Zn
(175 mg/kg), and Mn (738 mg/kg). The geo-accumulation index determined that
some sampling sites showed a level of heavily contaminated to extremely
contaminated by As and Cd (Figure 2). The Nemerow index indicates that Cr, Cu,
and Ni are at non-pollution levels, Pb and Zn are slightly polluted, and As and
Cd are severely polluted. The potential ecological risk assessment indicates
that 43% of the soil at the Shimen Realgar Mine area has a moderate ecological
risk, 39% has a strong ecological risk, and 18% has a very strong ecological
risk (Figure 3). This highlights mining
activities as the main factor driving environmental degradation in the Shimen
Realgar Mine. It is urgent to adopt green, environmentally friendly and
efficient remediation measures to reduce the heavy metal concentration in the soil.
Since the remediation of heavy metals in the soil of the mining area is a
long-term process, it is necessary to formulate a long-term remediation plan
and monitor the environmental remediation effect in real time[16].
5 Discussion and Conclusion
Heavy metals are highly toxic, persistent, and
non-biodegradable, and
their accumulation in soil due
to long-term mining and smelting activities has become a significant environmental concern[17,18]. The Shimen Realgar Mine in Hunan Province, the largest single arsenic mine
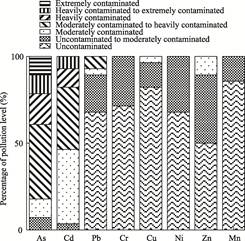
Figure 2 Assessment of pollution level (Igeo) of soil in Shimen Realgar Mine
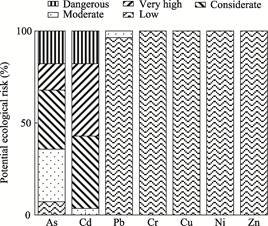
Figure 3 Potential ecological risks of the
soil in Shimen Realgar Mine
in Asia, has been operational for
over 1,500 years.
The Huangshui stream flows through the mine and into the Zaoshi Reservoir. As
an important local water source, the Zaoshi Reservoir is also contaminated by surface runoff from the mining area, tailings, and waste residue storage sites. Soil and sediment, as essential components of terrestrial ecosystems,
play a direct role in shaping
ecosystem structure
and function. This dataset focuses on the Shimen Realgar Mine and its surrounding
areas, representing the largest realgar
mine in Asia. An on-site investigations was conducted in May 2015, during which comprehensive data
monitoring of surface water, sediment, and soil was carried out to assess the
physical and chemical properties, as well as heavy metal concentrations. As a key dataset for environmental
monitoring in the Shimen Realgar Mine, this dataset offers valuable insights for ecological risk assessments in arsenic-rich mining
regions. It can also serve as a basis for studying long-term As transport and distribution in the mining area. Additionally, the data provides scientific support for the
development of strategies aimed at controlling environmental
pollution, addressing health risks, and promoting the sustainable development
of the Shimen Realgar Mine.
Author Contributions
Yang, F. designed the
algorithms of dataset and contributed to the data processing and analysis. Liu,
Y. X. Y. wrote the data paper.
Conflicts of Interest
The
authors declare no conflicts of interest.
References
[1]
Wang, Z. G., He, H. Y., Yan, Y.
L. Arsenic exposure of residents in areas near Shimen Realgar Mine [J]. Journal
of Hygiene Research, 1999, 28: 6?C8.
[2]
Xuan, Z. Q. A brief account of
Chinese arsenic resources [J]. Geology of Chemical Minerals, 1998,
20(3): 205?C211.
[3]
Xia, J., Cao, S., Wu, Z. Y., et
al. Botanical origin research and field study of medicine realgar [J]. China
Journal of TCM and Pharmacy, 2012, 27: 777?C778.
[4]
Xiao, X. Y., Chen, T. B., Liao,
X. Y., et al. Regional distribution of arsenic contained minerals and
arsenic pollution in Chine [J]. Geographical Research, 2008, 27: 201?C7212.
[5]
Liu, Y. X. Y., Yang, F. Heavy
metals and its environment risk assessment on Shimen Realgar Mine, Hunan
province of China [J/DB/OL]. Digital Journal of Global Change Data
Repository, 2024. https://doi.org/
10.3974/geodb.2024.11.08.V1.
[6]
GCdataPR Editorial Office.
GCdataPR data sharing policy [OL]. https://doi.org/10.3974/dp.policy.2014.05
(Updated 2017).
[7]
Muller, G. Index of
geoaccumulation in sediments of the Rhine river [J]. Geojournal, 1969, 2:
109?C118.
[8]
Nemerrow, N. L. Scientific
Stream Pollution Analysis [M]. Washington: Scripta Book Company, 1974.
[9]
Ministry of Ecology and
Environment of the P. R. China, State Administration for Market Regulation.
Soil environmental quality risk control standard for soil contamination of
agricultural land (Trial) (GB 15618??2018) [S]. Beijing: China Environment Publishing
Group, 2018.
[10]
Hakanson, L. An ecological risk
index for aquatic pollution control. a sedimentological approach [J]. Water
Research, 1980, 14(8): 975?C1001.
[11]
State Environmental Protection
Administration, General Administration of Quality Supervision, Inspection and
Quarantine of the P. R. China. Environmental quality standards for surface
water (GB 3838??2002) [S]. Beijing: China Environmental Science Press, 2002.
[12]
Zhu, X. Y., Wang, R. C., Lu, X.
C., et al. Secondary minerals of weathered orpiment-realgar-bearing
tailings in Shimen carbonate-type realgar mine, Changde, Central China [J]. Mineralogy
and Petrology, 2015, 109: 1?C15.
[13]
Tang, J. W., Liao, Y. P., Yang,
Z. H., et al. Characterization of arsenic serious-contaminated soils
from Shimen realgar mine area, the Asian largest realgar deposit in China [J]. Journal
of Soils and Sediments, 2016, 16: 1519?C1528.
[14]
Zhang, C., Nie, S., Liang, J., et
al. Effects of heavy metals and soil physicochemical properties on wetland
soil microbial biomass and bacterial community structure [J]. Science of the
Total Environment, 2016(1), 785?C790.
[15]
Zhao, L., Xu, Y. F., Hou, H., et
al. Source identification and health risk assessment of metals in urban
soils around the Tanggu chemical industrial district, Tianjin, China [J]. Science
of the Total Environment, 2014, 468?C469: 654?C662.
[16]
Guo, J. K., Zhao, J. J., Li, Y.
F., et al. Research progress on remediation technology for heavy
metal-contaminated soil in mines [J]. Journal of Agricultural Resources and
Environment, 2023, 40(2): 249?C260.
[17]
Ran, H. Z., Guo, Z. H., Yi, L.
W., et al. Pollution characteristics and source identification of soil
metal(loid)s at an abandoned arsenic-containing mine, China [J]. Journal of
Hazardous Materials, 2021, 413: 125382.
[18]
Chen, R., Han, L., Liu, Z.
Assessment of soil-heavy metal pollution and the health risks in a mining area
from southern Shaanxi Province, China [J]. Toxics, 2022, 10: 385?C401.