Wind Profile Characteristics during Typhoons over Wuyi
Mountain Station (2016?C2020)
Liao, K.1 Huang, X. Y.2 Chen, Y. L.2*
1. Fujian Key Laboratory of
Severe Weather, Fuzhou 350008, China;
2. School of Geographical
Sciences, Fujian Normal
University, Fuzhou 350007, China
Abstract: High spatial and
temporal resolution wind profile radar data is an important means to conduct
real-time monitoring and analyze the three-dimensional atmospheric wind field
conditions. In 2021, the ??National Wind Profile Radar Station Network Layout
Plan of China?? puts forward the demand for dense construction of wind profile
radar, which means that the wind profile radar data has become an important
basic data for meteorological research. The process and results of the Wind
profile dataset during Typhoons over Mt. Wuyi Station (2016?C2020) dataset was developed based on
the real-time sampling height with an observation interval of 6 min, including
horizontal wind direction, horizontal wind speed, and vertical wind speed at
each sampling height. The dataset is archived in .txt format and one
observation result is archived as one .txt file, with 11,856 files totally, consisting of
3,906 data files on 201614 Moranti, 4,261 data files on 201709 Nesat and 201710
Haitang, and 3,689 data files on 201909 Lekima. The data size is compressed to
one single file with 7.45 MB.
Keywords: wind profile radar;
typhoon; Wuyi Mountain; 2016-2020
DOI:
https://doi.org/10.3974/geodp.2021.03.12
CSTR:
https://cstr.escience.org.cn/CSTR:20146.14.2021.03.12
Dataset Availability Statement:
The
dataset supporting this paper was published and is accessible through the Digital Journal of Global Change Data
Repository at: https://doi.org/10.3974/geodb.2021.07.05.V1 or
https://cstr.escience.org.cn/CSTR:20146.11.2021.07.05.V1.
1 Introduction
As a new type of high-altitude detection remote sensing
equipment, wind profile radar can make continuous observations unattended,
providing high spatial and temporal resolution of the three-dimensional
atmospheric wind field data, capable of real-time detection of changes in
horizontal wind direction, horizontal wind speed, vertical wind speed,
atmospheric refractive index structure constant and other meteorological
elements at a vertical height of several hundred meters or even several
thousand meters[1?C4]. It plays
an important role in real-time monitoring and analyzing the characteristics of
vertical shear, jet stream, and convection at small-scale and medium-scale. It
can be used to reflect and predict weather conditions, simulate and warn
weather disasters.
Wind profile radar technology in China began late 1980s[5]. Total 126 wind
profile radars station had been built by 2020. The wind profile radar
technology has become mature and has initially built a network of wind profile
radar stations. On January 5th, 2021, the ??National Wind Profile
Radar Station Network Layout Plan of China?? was initialed. The application
analysis of wind profile radar data will gradually develop in depth, providing
an important basis for safeguarding agricultural production, predicting
aviation flight conditions and formulating disaster decision plans and so on.
In southeast coastal areas of China, typhoon disasters
occur frequently in summer and autumn. Wuyi Mountain, located in southeast
China, is frequently affected by typhoon disasters. Wuyi Mountain wind profile
radar station was set up in 2013. It is one of the earlier wind profile radar
stations in Fujian province. From 2016 to 2020, there were four typhoons
affecting Wuyi Mountain, typhoon Moranti in 2016, typhoon Nesat and Haitang in
2017, and typhoon Lekima in 2019. The wind profile radar data reflects the
three-dimensional wind field changes of typhoon, which has great research and
application significance for understanding the weather process of the typhoon,
revealing its wind field structure, indicating the future track characteristics,
and predicting short-time heavy precipitation.
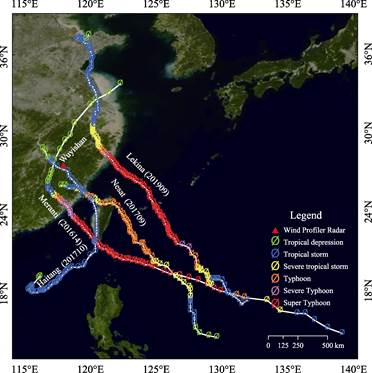
Figure 1 Map of Taiphone ??Meranti??, ??Nesat??,
??Haitang?? and ??Lekima?? moving paths
2 Metadata of the Dataset
The metadata of Wind profile dataset during typhoons over
Mt. Wuyi Station (2016?C2020) is summarized in Table 1. It includes the dataset
full name, short name, authors, year of the dataset, temporal resolution,
spatial resolution, data format, data size, data files, data publisher, and
data sharing policy, etc.
Table 1 Metadata
summary of the Wind profile dataset during typhoons over Mt. Wuyi Station
(2016?C2020)[6]
|
Items
|
Description
|
|
Dataset
full name
|
Wind
profile dataset during typhoons over Mt. Wuyi Station (2016-2020)
|
|
Dataset
short name
|
WindProfile_MtWuyi
|
|
Authors
|
Liao,
K. AAS-4210-2021, Fujian Key Laboratory of Severe Weather, liaokuo78@163.com
|
|
|
Huang,
X. Y. School of Geographical Sciences, Fujian Normal University,
hxy1050250101@163.com
Chen,
Y. L. AAP-3042-2020, School of Geographical Sciences, Fujian
Normal University, chenyl@fjnu.edu.cn
|
|
Geographical
region
|
Wuyi
Mountain
|
|
Year
|
2016-2020
|
|
Temporal
resolution
|
6 min
|
|
Spatial
resolution
|
The
starting and ending detection heights are 60 m and 7,080 m respectively, with
a vertical resolution of 60 m below 600 m height and 120 m above
|
|
Data
format
|
.txt
|
|
|
|
Data
size
|
7.45
MB (After being compressed)
|
|
|
|
Data
files
|
It
consists of three folders. They are 2016 (3,906 data files for ??Meranti?? ),
2017 (3,689 data files for ??Nesat?? and ??Haitang??), and 2019 (3,689 data files
for ??Lekima??). There are 11,856 data files in total during typhoons over Wuyi
Mountain in corresponding years
|
|
Foundations
|
Metrological
Bureau Foundation of Fujian Province of China (2020KX03)
|
|
Data
publisher
|
Global Change Research Data Publishing &
Repository, http://www.geodoi.ac.cn
|
|
Address
|
No.
11A, Datun Road, Chaoyang District, Beijing 100101, China
|
|
Data
sharing policy
|
Data from
the Global Change Research Data Publishing & Repository includes metadata, datasets
(in the Digital Journal of Global Change Data Repository), and
publications (in the Journal of Global Change Data & Discovery). Data sharing policy
includes: (1) Data are openly available and can be free downloaded via the
Internet; (2) End users are encouraged to use Data subject to
citation; (3) Users, who are by definition also value-added service
providers, are welcome to redistribute Data subject to written permission
from the GCdataPR Editorial Office and the issuance of a Data redistribution
license; and (4) If Data are used to compile new
datasets, the ??ten per cent principal?? should be followed such that Data
records utilized should not surpass 10% of the new dataset contents, while
sources should be clearly noted in suitable places in the new dataset[7]
|
|
Communication
and searchable system
|
DOI, CSTR, Crossref, DCI, CSCD,
CNKI, SciEngine, WDS/ISC, GEOSS
|
The entire process of the dataset was divided into two
parts. Firstly, the real-time observation data of wind profile radar was
collected. Secondly, the wind speed and direction were calculated by using the
observation data.
The
wind profile dataset during typhoons over Mt. Wuyi Station (2016-2020) dataset was
developed based on the observation data which was obtained from the CFL-03
boundary layer wind profile radar. The five-beam radial velocities (east, west,
south, north, and center) data for five days (UTC) before and after the typhoon
landing from 2016 to 2020 was collected. The wind speed and direction data on
each height layer were calculated by using the five-beam radial velocity. The
calculating methods are as follows[4,8,9].
(1)
Calculate the horizontal wind vector. Assuming that the radial wind toward the
radar is positive, and then the west wind is positive in the east-west wind
vector and the south wind is positive in the north-south wind vector.
 (1)
(1)
 (2)
(2)
 (3)
(3)
 (4)
(4)
where ?? is the zenith angle of the tilt beam, and Vrz,
Vre, Vrw , Vrs,
and Vrn are the radial velocities of the middle,
east, west, south, and north beams respectively. ue, uw, us,
and un are the horizontal wind vectors of the east, west, south, and north beams
respectively.
(2)
Calculate the horizontal vector u, v, and vertical vector w of the
three-dimensional wind field. w is the vertical wind speed.
 (5)
(5)
 (6)
(6)
 (7)
(7)
(3)
Calculate horizontal wind speed and direction.
 (8)
(8)
 (9)
(9)
 (10)
(10)
where V is the wind speed and Ø is the wind direction.
4 Data Results and Validation
4.1 Data Composition
|
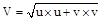
Figure
2 Data sample of the wind profile
radar
dataset
|
The wind profile dataset during typhoons over Mt. Wuyi
Station (2016-2020) consists of three folders. The dataset includes 3,906
data files on 201614 Moranti, 4,261 data files on 201709 Nesat and 201710
Haitang, and 3,689 data files on 201909 Lekima.
The
dataset is the product data on the real-time sampling height of Wuyi wind
profile radar station. The data was collected at an observation interval of 6 min
in the five days (UTC) before and after the typhoon made landfall in mainland
China. The periods were from September 10th, 2016 to September 20th,
2016, from July 25th, 2017 to August 5th, 2017, and from
August 5th, 2019 to August 15th, 2019.
4.2 Data Description
The product
data on the real-time sampling height of the wind profile radar consists of two
parts, one is the reference information, including the basic parameters of the
station, the other is the data part which was obtained at each sampling height,
including the sampling height, horizontal wind direction, horizontal wind
speed, vertical wind speed, horizontal direction reliability, vertical
direction reliability, and atmospheric refractive index structure constant.
The product data produced by one observation was
saved as one .txt file. Each group within the record was separated by a
half-space and the missing group was denoted by the corresponding rated length
??/??. Each group of detection data (except for letter data) length less than the
rated length, the integer part of the high was complemented 0 and the
fractional part of the low was complemented 0. The positive sign was denoted by
0 and the negative sign was denoted by ??-?? (minus sign). The end of each record was terminated with a carriage return
line feed ??<CR><LF>??.
The name of the file is
Z_RADR_I_IIiii_yyyyMMddhhmmss_P_WPRD_????????_????????.TXT. The yyyymmddhhmmss
represents the observation time, which is expressed in world time. The
following is a specific file for illustration, taking ??Z_RADA_I_58730_ 20160910160101_P_WPRD_LC_ROBS.TXT??
as an example. Z means domestic exchange file. RADA means radar data. IIiii
after I means district station number. For example, 58730 denotes Wuyi Mountain
Station number; 20160910160101 denotes observation at 16:01:01 UTC on September
10th, 2016. P denotes product data. WPRD denotes wind profile radar information. LC denotes radar model,
indicating that this radar is an L-band boundary layer wind profile radar. ROBS
is product identification, indicating the product data on the real-time
sampling height.
The wind profile dataset is
produced by using the data which was collected by the CFL-03 type boundary
layer wind profile radar, which is a final product entered into the network by
the China Meteorological Administration with mature and standardized
technology.
The first line WNDOOBS 01.20
denotes the keyword and the file version number. The second line denotes the
station, radar, and observation time. 58730 denotes the name of the wind
profile radar station, 0117.9850 denotes the longitude in degrees, 027.6167
denotes the latitude in degrees, and 00224.2 denotes the elevation of the
observation site in meters. The third line ROBS denotes the observation data
start.
Each number in the fourth line
denotes the sampling height (m), horizontal wind direction (degrees),
horizontal wind speed (m/s), vertical wind speed (m/s) upward as positive and
downward as negative, horizontal directional reliability, vertical directional
reliability, and atmospheric refractive index structure constant, respectively.
4.3 Data Products
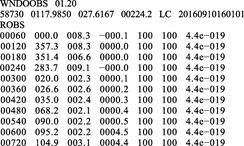
Typhoon 201614 Moranti was generated at 14:00 on September
10th, 2016. It landed on the coast of Xiangan, Xiamen at 3:05 on the
15th with a landfall level of severe typhoon and entered Jiangxi at
23:00 on the 15th. The National Meteorological Centre stopped its
number at 2:00 on September 17th. Figure 3(a) shows that the wind
direction of the upper air wind field above 4,000 m on the 11th was
dominated by southwest winds, the station was located northwest of the typhoon,
the typhoon had not yet had an impact on the upper air wind field in Wuyi Mountain.
From 5:00 to 10:00, the wind direction shifted with the height and it became
the warm advection, while the wind speed at the upper levels was enhanced,
which was conducive to energy accumulation. At 10:00, there were obvious wind
shear characteristics and the wind direction of the lower level turned to the
northeast. At 11:00, the thickness of the lower-level northeast wind expanded,
the wind speed at 1,500 m increased and the warm air lifted, triggering
short-term heavy precipitation. The local rainfall from 10:00 to 12:00
accumulated rainfall amount of 32.3 mm. It shows that the wind profile radar
data has obvious characteristics for short-term sudden heavy precipitation and
can provide the basis for relevant departments to make early warnings in time.
Figure 3(b) shows that the wind speed above 1,000 m on the 15th was
getting stronger, indicating that the typhoon was getting closer to the radar
station. The wind direction above 1,000 m gradually changed from easterly to
southerly, after 9:00 the wind direction began to change to southeasterly,
19:00 had basically changed to southerly, corresponding to the actual movement
path of the typhoon, the typhoon turned northward after 13:00, so the wind
profile radar data can indicate the typhoon steering changes.
Typhoon 201709 Naset was generated on July 21th,
2017. It landed on the east coast of Yilan, Taiwan at 19:40 on the 29th
and landed on Fuqing at 6:00 on the 30th with a landfall level of
typhoon. The National Meteorological Centre stopped its number at 20:00 on July
30th. Typhoon 201710 Haitang was generated on July 26th,
2017. It landed on the coast of Pingdong, Taiwan at 17:30 on the 30th
and landed Fuqing at 2:50 on the 31st with a landfall level of
tropical storm. The National Meteorological Centre stopped its number at 8:00
on August 1st. Naset and Haitang created the first recorded record
of landing in the same city within 24 hours, while the two typhoons occurred
double typhoon effect, Haitang combined with Naset circulation entered Jiangxi
at 16:00 on July 31st. Figure 4(a) shows that the lower wind field
was relatively chaotic and the wind shear was not obvious on July 27th,
which was not conducive to precipitation and the
local rainfall was 0 mm in total on that day. Figure 4(b) shows that the wind
direction was mainly easterly because the station was in the northwest of the
typhoon landing direction. The shear near the ground was obvious, which was
conducive to the development of precipitation. Typhoon Naset landed at 6:00,
and then the wind speed in the middle and upper levels gradually increased, and
the wind speed appeared pulsating characteristics.
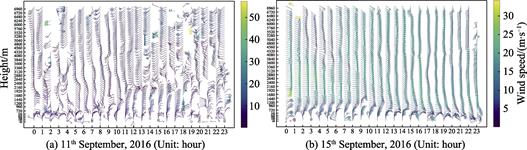
Figure 3 Map of hourly wind plumes before and
during typhoon landing of 1614 Meranti
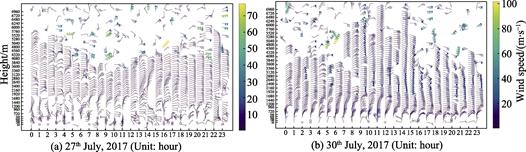
Figure 4 Map of the hourly wind plumes before and
during typhoon landing of 1709 Nesat
Typhoon
201909 Lekima was generated on August 4th, 2019. It landed on the
coast of Wenling, Zhejiang at 1:45 on the 10th with a landfall level
of super typhoon and landed on the coast of Qingdao, Shandong at 20:50 on
August 11th again. The National Meteorological Centre stopped its
number at 14:00 on August 13th. Figure 5(a) shows that the wind
direction was scattered with obvious wind disturbance at the lower level and
predominantly east wind direction at the middle and upper levels. Figure 5(b)
shows that the wind direction reflected the characteristics of west wind on the
southwest side of the typhoon because the station was on the southwest side of
the typhoon. The wind shear occurred at a low level. There was obvious wind
convergence at 18:00, which was favorable to the occurrence of precipitation.
4.4 Data Validation
An hourly wind plumes map based on this dataset processing
method was compared with the wind plume map produced by the Wind Profile Radar
Data Integrated Processing System (WPRIS) of Fujian Province Meteorological
Information Center. Except for the color scale and the treatment of breeze
(breeze is ??circle?? in this paper and breeze is ??rod?? in the system), the rest
of the two are the same. The wind profile dataset during typhoons over Mt. Wuyi
Station (2016-2020) calculated by using the original data can be judged
to be correct.

Figure 5 Map of the hourly wind plumes before and
during typhoon landing of 1909 Lekima
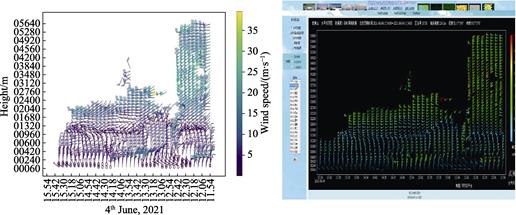
Figure
6 Comparison of data visualization
between output mapping and displaying in the processing system (left is data visualization
map, right is the data displaying in the processing system)
5 Discussion and Conclusion
Wind profile radar data provides the three-dimensional wind
field data with high spatial and temporal resolution. The changes of horizontal
wind direction by analyzing the wind plume map indicate the relative position
between typhoon and monitoring stations. Meanwhile, some scholars have pointed
out that the sinking phenomenon of wind plume map high wind area and typhoon
steering has a certain indicator role[10]. Therefore, the wind field information of wind
profile radar could be used to judge the relative position of typhoon by
combining the location of monitoring radar stations, to provide the moving path
of typhoon in real-time and simulate the path steering change of typhoon. In
addition to the horizontal wind, the detailed horizontal wind speed data
provided by the wind profile radar can also be used to predict the future
typhoon wind speed change, to provide an important reference basis for
preventing the violent wind disaster caused by typhoon. For precipitation, wind
profile radar data can effectively detect wind direction and speed changes
before and after the occurrence of typhoon heavy precipitation and local heavy
precipitation[11]. The heavy
precipitation on September 11, 2016, the local heavy precipitation, and the
wind plume map shows that it had obvious air convergence and wind shear
characteristics. The wind speed which increased rapidly in low-level was
consistent with the occurrence of heavy precipitation at the same time[12]. The study points out that there is a
correspondence between vertical wind speed and precipitation intensity[13]. The vertical wind speed reflects the strength
of convection. Typhoon heavy precipitation is accompanied by an obvious upward
movement of water vapor convergence. The large value of vertical speed has an
obvious upward trend from lower to higher levels with time, indicating that
water vapor is accumulating and rising, while the vertical speed at lower
levels is not strong, indicating that water vapor is accumulating at higher
levels[11]. This causes heavy precipitation in a period of
time afterwards, and the weakening time of upward movement corresponds to the
stop time of precipitation. Therefore, the horizontal wind direction,
horizontal wind speed and vertical wind speed data provided by the wind profile
radar data could be an important reference for the monitoring and early warning
of the duration and intensity of local sudden heavy precipitation and typhoon
heavy precipitation.
Author
Contributions
Liao, K. designed the dataset and contributed to the data
processing. Chen, Y. L. designed the algorithms of dataset. Huang, X. Y.
contributed to the data validation. Liao, K. and Chen, Y. L. wrote the data
paper.
Conflicts
of Interest
The
authors declare no conflicts of interest.
References
[1]
Dong, L.
P., Wu, L., Wang, L., et al.
Preliminary comparison research of the wind profile radar network data [J]. Meteorological Monthly, 2014, 40(9):
1145?C1151.
[2]
Yan, J. M.,
Zhao, B. K., Zhang, S., et al.
Observation analysis and application evaluation of wind profile radar to
diagnosing the boundary layer of landing typhoon [J]. Journal of Applied Meteorological Science, 2021, 32(3): 332?C346.
[3]
Mao, W. Q.,
Wang, X. Y., Huang, Y., et al.
Application of wind profile radar to the blizzard process in the Huaihe River
basin [J]. Journal of Lanzhou University: Natural Sciences, 2021, 57(2): 263?C269.
[4]
Tu, Z. Z.,
Wang, X. Y, Jiang, C. Y., et al. Analysis on precision of wind profiler
measurements in different seasonal weather conditions [J]. Meteorological
and Environmental Sciences, 2020, 43(2): 100?C108.
[5]
Hu, M. B.,
Li, M. Y., et al. The development and technologic status of wind
profiling radar [J]. Scientia
Meteorologica Sinica, 2010, 30(5): 724?C729.
[6]
Liao, K.,
Li, K. L., Dang, H. F., et al. Wind profile dataset during typhoons over
Mt. Wuyi station (2016-2020) [J/DB/OL]. Digital Journal of Global Change
Data Repository, 2021. https://doi.org/10.3974/ geodb.2021.07.05.V1.
https://cstr.escience.org.cn/CSTR:20146.11.2021.07.05.V1.
[7]
GCdataPR
Editorial Office. GCdataPR data sharing policy [OL].
https://doi.org/10.3974/dp.policy.2014.05 (Updated 2017).
[8]
Lin, X. M.,
Wei, Y. H., Chen, H., et al. The effect assessment of wind field
inversion based on WPR in precipitation [J]. Journal of Applied
Meteorological Science, 2020, 31(3): 361?C372.
[9]
Hu, M. B.
Research on data processing and application of wind profile [D]. Nanjing:
Nanjing University of Information Science & Technology, 2012.
[10]
Zheng, H.
Y., Tu, J. W., Zhan, T., et al. Analysis of the track and intensity of
typhoon Vicent [J]. Guangdong Meteorology,
2014, 36(1): 12?C19.
[11]
Liu, L.,
Zhou, X. C., Li, L., et al. Analysis of wind profile radar monitoring in
two types of heavy precipitation processes [A]. Chinese Meteorological Society.
Innovation driven development and improving the ability of meteorological
disaster prevention??S2 Disaster weather monitoring, analysis and forecasting
[C]. Chinese Meteorological Society: Chinese Meteorological Society, 2013: 10.
[12]
Wang, W.
B., Yang, K. D., Li, X. L., et al. Analysis of cold air activity and
application of wind profile radar data during typhoon Matmo [J]. Journal of
Shandong Meteorology, 2015, 35(4): 1?C5.
[13]
Shi, C. X.,
Dai, L. Q., Cheng, H. T., et al. Application of wind profiler data in
analysis of the visit by typhoon Dianmu [J]. Guangdong Meteorology, 2019, 41(5): 27?C30.