Reconstruction Dataset of Cropland Change in Eastern Part of Northern China??s Farming–Pasto- ral Zone (Liao, Jin,
Yuan, and Ming Dynasities)
Wu, Z. L.1,3
Fang, X. Q.2* Ye, Y.2 Hu, Z. Q.1
1. School of Geographical Science, Qinghai Normal
University, Xining 810016, China;
2. Faculty of Geographical Science, Beijing
Normal University, Beijing 100875, China;
3. Academy of Plateau Science and Sustainability,
Xining 810016, China
Abstract: Reconstruction of cropland cover not only provides
basic data for simulating global changes and their effects on ecological
environments but it also advances understanding of regional human-environment
relationships. Over the last millennium, land use in northern China??s
farming–pastoral zone alternated between agriculture and pastoralism, and the
land use pattern showed the characteristics of half farming and half animal
husbandry. Accurate reconstruction of changes in cropland cover changes in
similar areas is therefore challenging. The eastern part of northern China??s farming–pastoral
zone was selected for this study. Historical literature and the relationship
between the settlement and cropland were used to estimate cropland area during
the Liao, Jin, Yuan, and Ming dynasties. Subsequently, a cropland gridded
allocation method based on settlement relics was used to reconstruct a dataset of
5????5?? cropland cover. The study produced two key outputs comprising 36 data
records (occupying 2.26 MB), which were compressed into a single file (242 KB).
The first was a tabular dataset on cropland area and number of settlement
during the four dynasties. The second comprised two spatial datasets generated
with ArcGIS: (1) boundary data of the eastern part of northern China??s
farming–pastoral zone, archiving in .shp data format; (2) cropland cover data
at a 5????5?? spatial resolution for four time points during these dynasties,
archiving in .shp data format. Together, these datasets objectively depict the
fundamental transformation in land use between the Liao and Ming dynasties,
which shifted from half farming and half animal husbandry to predominantly animal
husbandry in the study area.
Keywords: land
use/land cover; cropland; settlement relics; Liao, Jin, Yuan, and Ming
dynasties; farming-pastoral zone
DOI: https://doi.org/10.3974/10.3974/geodb.2023.02.09.
CSTR: https://cstr.escience.org.cn/CSTR:20146.14.2023.02.09
Dataset Availability Statement:
The dataset supporting this paper was published and is accessible through
the Digital Journal of Global Change Data Repository at: https://doi.org/10.3974/geodb.2023.08.01.V1 or
https://cstr.escience.org.cn/CSTR:20146.11.2023.08.01.V1.
1 Introduction
Research on land use and land cover change (LUCC) is cruciel for
analyzing global changes and their impacts[1]. Given the cumulative
effects of human land use activities on territorial systems, the impacts of
human land use during historical periods on current ecology merit attention[2,3].
Reconstruction of historical LUCC not only reflects the spatio-temporal
evolution of land cover but it also provides basic data for simulating global
climate and environmental changes[4–6]. Following the introduction
of agricultural activities, cropland emerged as a key land use type with the
fastest rate of expansion and most profound impact on the original land cover
Moreover, its expansion not only directly transformed the original land cover
type but it also indirectly influenced environmental changes at various scales
from the regional to the global by inducing changes in the physical conditions
and biogeochemical cycles of land surfaces[7]. Therefore, the
reconstruction of cropland constitutes the starting point for reconstructing
other land use/land cover types. Moreover, the use of a long time series for
reconstructing cropland cover has a high degree of reliability and helps to
deepen understanding of the entire process of land cover change caused by human
activities. Several historical land use/cover datasets have been developed,
notably SAGE[8], HYDE[9], PJ[10], and KK 10[5],
all of which include cropland cover and have been widely used in studies
on global climate and environmental changes. Despite continuous improvements in
the quality of these datasets introduced through regular updates, uncertainties
remain, arising mostly from two factors[11–13]. The first is the low
spatial resolution (national or continental scale) used for cropland areas, and
the second is the exclusive use of natural factors for designing gridded
methods for allocating cropland.
The
reconstruction of regional cropland cover not only depicts the process of
cropland cover quantitatively but it also enables the improvement of global
cropland cover datasets[13]. In recent years, a substantial body of
research conducted by Chinese scholars has centered on the reconstruction of
cropland cover using extensive historical literature and archaeological
evidence. The following three main trends have emerged from this research.
First, the work process for reconstructing cropland cover has gradually been
unified and standardized[14]. Second, the research period considered
in the reconstruction of cropland cover has been steadily extended to cover
longer historical periods[15–17]. Third, the gridded allocation
method for reconstructing cropland cover has been continuously improved, and
the outcomes of reconstruction have become increasingly reliable[18–20].
Despite numerous achievements, however, it is noteworthy that recent studies
have mainly focused on agricultural areas for which the historical literature
is relatively rich, and where favorable conditions exist for agricultural
development. Conversely, studies aimed at long-term cropland reconstruction in
similar areas such as the northern China??s farming–pastoral zone remain
limited. This is mainly due to the fragile ecological environment and poor
inheritance of agricultural development in these regions, as well as the
changeable land use mode, which lead to the difficulty in obtaining historical
cropland data and constructing gridded allocation method.
We selected the
eastern part of northern China??s farming–pastoral zone, which is highly
sensitive to climate change, as our study area. Modern land uses patterns in
this zone is half framing and half animal husbandry. Referring to the
historical literature and considering the relationship between the settlement
and cropland area, we first estimated the cropland area during the Liao, Jin,
Yuan, and Ming dynasties. Next, applying a cropland allocation method based on
settlement density, we reconstructed cropland coverage data at a spatial
resolution of 5????5?? for the corresponding periods. We expect that our findings
will provide guiding inputs for the development of research on cropland
reconstruction in similar areas, such as the farming–pastoral zones using long
time series.
2 Metadata of the Dataset
The
metadata of the Cropland change dataset in eastern part of the agro-pastoral
ecotone in Northern China (from Liao to Jin, Yuan and Ming)[21] are
summarized in Table 1. They include the full and abbreviated name of each
dataset, the authors, the year of creation of the dataset, the spatial
resolution, the data format, data size, data files, data publisher, and data-
sharing policy, etc.
Table 1 Metadata
summary of the Cropland change dataset in eastern part of the agro-pastoral
ecotone in Northern China (from Liao to Jin, Yuan and Ming)
|
Items
|
Description
|
|
Dataset full name
|
Cropland change dataset in eastern part of the agro-pastoral ecotone
in Northern China (from Liao to Jin, Yuan and Ming)
|
|
Dataset short name
|
Cropland_LiaoJinYuanMing
|
|
Authors
|
Wu, Z. L.,
Qinghai Normal University, Academy of Plateau Science and Sustainability,
wuzl@qhnu.edu.cn
Fang, X. Q.,
Beijing Normal University, xfang@bnu.edu.cn
Ye, Y., Beijing
Normal University, yeyuleaffish@bnu.edu.cn
Hu, Z. Q.,
Qinghai Normal University, huzq@qhnu.edu.cn
|
|
Geographical region
|
The study area
is located in eastern part of northern Chinas farming-pastoral zone (41??58??N–46??53??N, 116??25??E–124??38??E), covering 1.935??105 km2.
This area encompasses
16 cities and counties in the eastern part of Inner Mongolia Autonomous
Region (e.g., Tongliao, Wengniuteqi, Keshiketengqi), 9 cities and counties in
Jilin Province (e.g., Baicheng, Taonan, Tongyu), and Taimi in Heilongjiang
Province.
|
|
Year
|
Liao, Jin, Yuan,
and Ming dynasties
|
|
Temporal resolution
|
Dynasty (It
should be pointed out that the temporal resolution of the original settlement
data[21] we used in our study was only up to the dynasty.
Therefore, the final dataset of this study is the cropland area and cropland
cover data of 4 periods for each dynasty)
|
|
Spatial resolution
|
5????5??
|
|
Data format
|
.shp, .xlsx
|
|
Data size
|
2.26 MB (242 KB after compression)
|
|
Data files
|
Cropland area
and the number of settlement relics in Liao, Jin, Yuan, and Ming dynasties (1-CroplandArea_Liao-Jin-Yaun-Ming), and data format is .xlsx
Boundary data of
eastern part of northern China's farming–pastoral zone (2-BND_Eastern_NorthernChina's_Farming-Pastoral_Zone), and data format is .shp
Cropland cover
data in Liao, Jin, Yuan, and Ming dynasties (3-CroplandCover_Liao-Jin-Yuan-Ming), and the data format is .shp
|
|
Foundation
|
Ministry of
Science and Technology of P. R. China (2021YFD1500704)
|
|
Data computing environment
|
ArcGIS
|
|
Data publisher
|
Global Change
Research Data Publishing & Repository, http://www.geodoi.ac.cn
|
|
Address
|
No. 11A, Datun
Road, Chaoyang District, Beijing 100101, China
|
|
Data sharing policy
|
Data from
the Global Change Research Data Publishing & Repository includes metadata, datasets
(in the Digital Journal of Global Change Data Repository), and
publications (in the Journal of Global Change Data & Discovery). Data sharing policy
includes: (1) Data are openly available and can be free downloaded via the
Internet; (2) End users are encouraged to use Data subject to
citation; (3) Users, who are by definition also value-added service
providers, are welcome to redistribute Data subject to written permission
from the GCdataPR Editorial Office and the issuance of a Data redistribution
license; and (4) If Data are used to compile new
datasets, the ??ten per cent principal?? should be followed such that Data
records utilized should not surpass 10% of the new dataset contents, while
sources should be clearly noted in suitable places in the new dataset[22]
|
|
Communication and searchable system
|
DOI??CSTR??Crossref??DCI??CSCD??CNKI??SciEngine??WDS/ISC??GEOSS
|
3 Methods
3.1 Selection and
Delimitation of the Eastern Part of Northern China?? Farming–Pastoral Zone
Given significant changes in the farming–pastoral
zone during historical periods, and the coincidence of its range with the
natural boundary (Figure 1a), depicting a clear and bounded sub-national administrative unit
(provincial administrative unit) posed challenges[23-25].
There- fore, considering issues of feasibility and the data availability, we
selected farming areas in southeastern Shangjing Dao during the Liao dynasty
for our case study. This period coincided with the Medieval Warm Period, which
was characterized by a relatively warm and humid climate a thousand years ago[25,26].
This area has the largest bandwidth within the farming–pastoral zone in
northern China (Figure 1a).
The territory of
the Liao dynasty ( 907–1125 AD), which was established by the nomadic Khitan,
broadly encompassed northern China (currently the provinces of Jilin, Heilongjiang,
Liaoning, Hebei, and Shanxi and the entire Inner Mongolia Autonomous Region),
as well as parts of contemporary Russia and Mongolia. However, its economic and
political center was concentrated in northeastern China (Figure 1b). The
administrative region of the Liao dynasty encompassed five daos, namely
Shangjing Dao, Dongjing Dao, Nanjing Dao, Xijing Dao, and Zhongjing Dao (Figure
1b). Of these daos, Shangjing Dao, located in Linhuang Fu (the capital city
during the Liao dynasty), was also important as the area where agriculture was
initiated and developed during the Liao dynasty. In particular, the area along
the Xar Moron River in southeastern Shangjing Dao bacame a hub of agricultural
development as a result of population agglomeration (Figure 1c)[27–31].

Figure 1 Maps of
the eastern part of northern China??s farming–pastoral zone[30]: (a) The range of
northern China??s farming–pastoral zone; (b) Administrative boundaries during
the Liao dynasty[31]; (c) The distribution of the administrative
centers of Fu and Zhou
Because of
constraints posed by the population structure and natural conditions, farming
areas were concentrated in southeastern Shangjing Dao. We identified and
selected this area as our study area according to the spatial distribution of
settlement relics from the Liao dynasty and contemporary administrative maps of
Chinese counties.
3.2 Data Sources on
Historical Settlements and Their Analysis
Data
on settlements during the Liao dynasty used in this study were sourced from Wu et al.[18], which draws on the sixth volume of The Historical Atlas of China[31].
Data on settlement during the Jin, Yuan, and Ming dynasties were extracted from
Jia et al.[23].
3.3 Method Used to
Estimate Cropland Areas
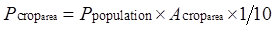
(1)
Estimation method used for the cropland area during the Liao dynasty
Taking a balance
between regional production and consumption as the premise, we estimated the
cropland area during the Liao dynasty by performing the following steps. First,
we estimated grain consumption per person. Second, we estimated the cropland
area per person and per year, and the corresponding cropland area per household
through a comprehensive consideration of human factors. These factors included
grain yield per unit area, farming systems, and dietary differences among the
various agricultural and non-agricultural ethnic groups. Last, we estimated the
total cropland area in the study region, considering the number of households.

 (1)
(1)
where,
 denotes the total
cropland area in the study area,
denotes the total
cropland area in the study area,  denotes the
annual cropland area demand of the agricultural households, and
denotes the
annual cropland area demand of the agricultural households, and  denotes the
annual cropland area demand of non-agricultural households.
denotes the
annual cropland area demand of non-agricultural households.
 (2)
(2)
 (3)
(3)
where,
 denotes the total
number of agricultural households,
denotes the total
number of agricultural households,  denotes the total
number of non-agricultural households, and
denotes the total
number of non-agricultural households, and  denotes the
cropland area per household.
denotes the
cropland area per household.
During the Liao
dynasty, there are about 6.5 person per household (four adults, including two
soldiers, and 2.5 minors)[32, 33]. In study area, the per capita
cropland area for every adult and minor (12 Song mu and 6 Song mu,
respectively). Thus, the cropland area per household was estimated at 63 Song
mu[34]. Then, it was estimated that the cropland area required by a
non-agricultural household was one-tenth of the cropland area required by an
agricultural household[34, 35]. At a final step, we converted the unit of cropland area from ha to
km2, with 1 ha=0.01 km2.
(2)
Estimation method used for cropland area during the Jin, Yuan, and Ming
dynasties
During Liao,
Jin, Yuan, and Ming dynasties, the agricultural production technology in the
study area was in the traditional agricultural stage and the agricultural
production level was similar[28]. Hence, it can be assumed that the
agricultural production levels during the Liao, Jin, Yuan, and Ming dynasties
were relatively stable in the study area. Accordingly, we used the cropland
area per settlement during the Liao dynasty and the number of settlements
during the Jin, Yuan, and Ming dynasties to estimate the cropland area during
each respective historical period.
Calculation of
cropland area per settlement during the Liao dynasty was as follows. During a
particular historical period, cropland was generally distributed around
settlements. Therefore, the total cropland area within a region would comprise
the sum of cropland area around each settlement. Moreover, the locations of
settlements could indicate those of cropland, and the number of settlement
could also reflect how much cropland had been cultivated within the area.
The calculation
was performed using the following Equations:
 (4)
(4)
 (5)
(5)
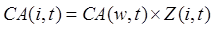
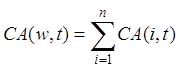
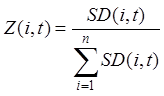
where,
 denotes the total
cropland area in year t and region w, and
denotes the total
cropland area in year t and region w, and  denotes the
cropland area of the Nth settlement in year t and region w. N
is the serial number of the settlement. In Equation (5),
denotes the
cropland area of the Nth settlement in year t and region w. N
is the serial number of the settlement. In Equation (5),  denotes the
average cropland area per settlement in year t and region w, and
denotes the
average cropland area per settlement in year t and region w, and  denotes the
number of settlements in year t and region w. Thus, the average
cropland area per settlement can be calculated by basing on the total cropland
area and the number of settlement during the Liao dynasty.
denotes the
number of settlements in year t and region w. Thus, the average
cropland area per settlement can be calculated by basing on the total cropland
area and the number of settlement during the Liao dynasty.
The estimation
of cropland area during the Jin, Yuan, and Ming dynasties was performed as
follows. Equation (6) was derived from Equations (4) and (5), that is, the
total cropland area () in a region was deemed equal to the product of the average
cropland area per settlement () and the number of settlements ().
 (6)
(6)
Thus, we used
the average cropland area per settlement during the Liao dynasty??s and
settlement data during the Jin, Yuan, and Ming dynasties to estimate the
cropland area during these respective periods.
3.4 Settlement
Density-based Cropland Allocation Method
We
utilized a settlement density-based cropland allocation method to reconstruct
cropland cover[18, 19]. The specific steps implemented were as
follows.
(1) Combined
with spatial resolution of international dataset and the actual situation in our
study area, we selected grid scale with 5????5?? spatial resolution to reconstruct
cropland cover. Next, we constructed the grids with 5????5?? spatial resolution
for the study area, and counted the number of settlements in each grid.
(2)
Identification of cropland grid. If a grid contained settlements, it was
identified as a cropland grid, otherwise, it was identified as a non-cropland
grid.
(3) Construction
of the weight for cropland gridded allocation. The number of settlements
included in the grid determined the amount of cropland allocated to each grid.
(4) Utilized
settlement density-based weight for the cropland gridded allocation to allocate
the cropland area in grid scale during the Liao, Jin, Yuan, and Ming dynasties.
The outcome was the fraction of cropland in the grid.
The following
Equations were used for the calculation:
 (7)
(7)
 (8)
(8)
 (9)
(9)
where,
 values ranging
from 0 to 1 denotes the weight for allocating the cropland area in year t and
in grid i.
values ranging
from 0 to 1 denotes the weight for allocating the cropland area in year t and
in grid i.
The weight of
cropland allocation, which was based on the number of settlements, was derived
from Equations (6) and (9), simplified into Equation (10) as follows:
 (10)
(10)
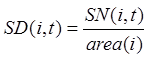 (11)
(11)
where,,
 denotes the settlement density in grid i and year t,
denotes the
number of settlements in grid i and year t, and
denotes the settlement density in grid i and year t,
denotes the
number of settlements in grid i and year t, and  denotes the area of the grid. The settlement density-based
weight was derived from Equations (10) and (11), which were simplified into
Equation (12) as follows:
denotes the area of the grid. The settlement density-based
weight was derived from Equations (10) and (11), which were simplified into
Equation (12) as follows:
 (12)
(12)
The Equation
used for calculating the cropland area in the grid was based on settlement
density, as shown below:

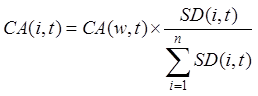 (13)
(13)
Equation (14)
was used to calculate the fraction of cropland in the grid:
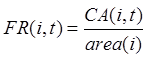 (14)
(14)
where,
 denotes the cropland fraction in grid i and year t,
 denotes the cropland area being
allocated in grid i and year t, and denotes the area of the grid. Notably, an assumption in this
study was that the grid area varied with latitude.
denotes the cropland area being
allocated in grid i and year t, and denotes the area of the grid. Notably, an assumption in this
study was that the grid area varied with latitude.
4 Data Results and Validation
4.1 Data Composition
The
reconstructed dataset of cropland change in eastern part of northern China??s
farming- pastoral zone (Liao, Jin, Yuan, and Ming dynasties) contains the
boundary data of the eastern part of northern China??s farming-pastoral zone
(.shp data format), cropland area (.xlsx data format), and the number of
settlements during each of the above dynasties (.xlsx data format). They also
include cropland cover data (.shp data format), with 5????5?? and dynasty as the
spatial resolution and temporal resolutions, respectively.
4.2 Data Results and
Validation
(1)
Estimation of the total cropland area during the Jin, Yuan, and Ming dynasties
Considering
reconstructed cropland area during the Liao dynasty (3,905 km2) and
the number of settlement relics (1,834), we calculated that the cropland area
per settlement during the Liao dynasty was 2.13 km2. Given that
agricultural productivity levels were similar during the Liao, Jin, Yuan, and
Ming dynasties, we used the cropland area per settlement during the Liao
dynasty (2.13 km2) and the number of settlement during the Jin
(825), Yuan (72), and Ming (29) dynasties to estimate the cropland area, which
were 1,757 km2 (Jin dynasty), 154 km2 (Yuan
dynasty), and 62 km2 (Ming dynasty). The cropland fractions in the
study area were 2.0%, 0.9%, 0.1%, 0.03%, during the Liao, Jin, Yuan, Ming dynasties. Between the Liao and Ming dynasties, the
number of settlement and cropland area decreased sharply 98.4% and 98.0%,
respectively, indicating that the type of land use in the study area shifted
from half farming and half animal husbandry to animal husbandry (Figure 2).
To evaluate the
accuracy of the estimates of reconstructed cropland area obtained in this
study, and taking cropland area during the Liao dynasty as an example, we
compared our results with those of other studies. This analysis revealed that
reconstructed cropland area of this study was similar to that obtained by Li et al. [34]. It was also
similar to the cropland area estimated by Han[29] (5.0??104 ha??0.34??104 km2)
in the Xar Moron River Valley and its neighborhood. The figure for the
reconstructed cropland area obtained in this study was slightly larger, mainly
because its coverage was greater. Therefore, the reliability of the
reconstructed cropland area estimated in this study was confirmed[18].
(2)
Gridded allocation results of cropland cover
Figure 3 shows
the gridded allocation results of cropland cover with 5?? resolution during the
Liao, Jin, Yuan, and Ming dynasties.The spatial distribution of cropland cover
revealed that the widest distribution of this land use type occurred during the
Liao dynasty. Subsequently, there was some reduction in its distribution during
the Jin dynasty and a significant reduction during the Yuan dynasty, with only
scattered areas of cropland remaining in the study area during the Ming
dynasty.
During the Liao
dynasty, the spatial distribution of cropland was constrained by the fragile
natural environment, revealing a mosaic pattern[29, 35]. The
cropland grids comprised 28.3% of the total grids in the study area and
occurred alongside major rivers, such as the Xar Moron, Lang and Laha Rivers[28,
29] (Figure 3a). The average cropland fraction of the cropland grids was
6.6% and the largest fraction was 31.4%. Differences in the spatial
distribution of cropland fractions were significant. The distribution of higher
cropland fractions corresponded to centrally located settlements, such as
Linhuang Fu, Hengzhou and Fengzhou, with these fractions gradually decreasing
with increasing distance from the centers with high cropland fractions.
During the Jin
dynasty, the cropland grids comprised 13.4% of the total grids in study area,
which decreased by 14.9 percentage points compared with Liao dynasty,
indicating that the scale of the cropland has been reduced. The average
cropland fraction of the cropland grids was 6.3% and the highest fraction was
30.3% (Figure 3b). The cropland was mainly distributed in the eastern part of
the study area, largely because of the spatial shift in the agricultural center
of gravity caused by population migration. Starting in the middle period of the
Jin dynasty, a large proportion of the agricultural population moved eastward
from areas located near the Laha River to Xingzhongfu along the Daling River,
resulting in a shift in the agricultural center of gravity.
During the Yuan
dynasty, the cropland grids comprised just 1.8% of the total grids in the study
area, indicating a decrease by 11.6 percentage points compared with their
proportion during the Jin dynasty. The spatial scale of cropland was further
reduced, and cropland remained concentrated exclusively in the southern part of
the study area (Figure 3c). The average cropland fraction in the grids was 4.1%
and the highest fraction was 10.1%. The Mongolians, who ruled during the Yuan
dynasty, practiced animal husbandry for their subsistence and lacked farming
traditions or interest in agricultural development. Conse- quently,
agriculture was mostly replaced by nomadic animal husbandry in the study area.
During the Ming
dynasty, cropland grids comprised just 0.8% of the total grids in the study
area, and cropland was scattered. Of the four dynasties during the study
period, the Ming dynasty was associated with the least distribution and
cropland area (Figure 3d). The average cropland fraction in the grids was 3.8%,
and the highest fraction was 7.1%. The rulers of the Ming dynasty had a
longstanding conflict with nomadic tribes in the Mongolian plateau, such as the
Tartars, and never fully controlled this region. On the one hand, the study
area was outside the border walls built by Ming dynasty, and on the other hand,
the Mongolian plateau did not form a stable regime for a long time. Therefore,
during the Ming dynasty, a stable political environment was lacking in this
region, leading to the decline of agriculture and the ascent of pastoralism.
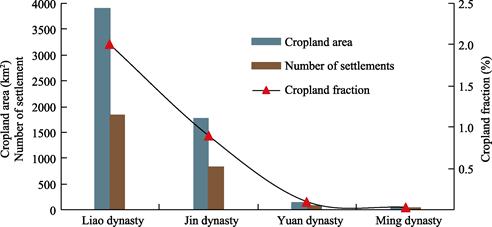
Figure 2 Trends in
the total cropland area and the number of settlements during in the Liao, Jin,
Yuan, and Ming dynasties in the eastern part of northern China??s
framing–pastoral zone

Figure 3 Maps of
the reconstruction of cropland cover during the Liao, Jin, Yuan, and Ming
dynasties
in the eastern part of northern China??s framing–pastoral zone
To evaluate the
reliability of our results for the gridded allocation of cropland, we compared
them with gridded cropland cover data for the same time section in the HYDE 3.2
global land cover datasets. The analysis revealed that cropland cover
reconstructed using the settlement density method in this study was effective
in overcoming the defects of recons truction based on the land suitability for
cultivation. Moreover, it illuminated the change in land use from farming to
animal husbandry in the study area. Therefore, this method accurately and
objectively reproduced the change in cropland cover. In sum, the cropland cover
data reconstructed in this study was deemed reliable[30].
5 Discussion and Conclusion
This
dataset based on historical literature and settlement relics reconstructed the
cropland area and cropland cover with 5?? resolution in eastern part of northern
China??s farming- pastoral zone in Liao, Jin, Yuan and Ming dynasty. Between the
Liao and Ming dynasties, the total cropland area in the study area decreased by
98.0% from 3,905 km2 to 62 km2. The spatial distribution
and coverage of cropland was found to be greatest during the Liao dynasty and
was subsequently reduced during the Jin dynasty. However, a drastic reduction
of cropland occurred during the Yuan dynasty, and during the Ming dynasty, only
scattered patches of cropland remained. Hence, our findings indicated that over
the past millennium, land use in the study area underwent a fundamental change
from agriculture to pastoralism caused by climate change and human factors. To
sum up, our dataset not only provides an accurate quantitative depiction of the
process of change of cropland cover but it also provides valuable inputs for
reconstructing changes in cropland cover in similar areas with fragile
ecological environments, which are vulnerable to climate change.
Author Contributions
Fang,
X. Q and Wu, Z. L. designed the study. Ye, Y., Wu, Z. L. and Hu, Z. Q.
contributed to the processing and analysis of the cropland data. Fang, X. Q.
and Wu, Z. L. designed the algorithms of the dataset. Wu, Z. L. wrote the data
paper.
Conflicts of Interest
The authors declare no conflicts of
interest.
References
[1]
Zhang, Y. L., Liu, L. S., Wang,
Z. F., et al. Spatial and temporal
characteristics of land use and cover changes in Tibetan Plateau [J]. Chinese Science Bulletin, 64(27): 2865–2875.
[2]
ArchaeoGLOBE Project.
Archaeological assessment reveals Earth??s early transformation through land use
[J]. Science, 2019, 365: 897–902.
[3]
Ellis, E. C. Land use and ecological change: a 12,000-year history [J]. Annual Review of Environment and Resources,
2021, 46: 1–33.
[4]
Pongratz, J., Raddatz, T.,
Reick, C. Radiative forcing from anthropogenic land cover change since A.D. 800
[J]. Geophysical Research Letters,
2009, 36: L02709. https://doi:10.1029/2008GL036394.
[5]
Kaplan, J. O., Krumhardt, K.
M., Ellis, E. C., et al. Holocene
carbon emissions as a result of anthorpogenic land cover change [J]. The Holocene, 2011, 21(5): 775–791.
[6]
Harrison, S. P., Gaillard, M.
J., Stocker, B. D., et al.
Development and testing of scenarios for implementing Holocene LULC in Earth
System Model Experiments [J]. Geoscientific
Model Development, 2020, 13(2): 805–824.
[7]
Gaillard, M. J., Morrison, K.
D., Madella, M., et al. Past land-use
and land-cover change: The challenge of quanitification at the subcontinental
to global scales [J]. Past Land Use and
Land Cover, PAGES Magazine,
2018, 26(1): 1–44.
[8]
Ramankutty, N., Foley, J. A.
Estimating historical changes in global land cover: croplands from 1700 to 1992
[J]. Global Biogeochemical Cycle,
1999, 13(4): 997–1027.
[9]
Klein Goldewijk, K., Beusen,
A., Doelman, J., et al. Anthropogenic
land use estimates for the Holocene- HYDE 3.2 [J]. Earth System Science Data, 2017(9): 927–953.
[10]
Pongratz, J., Reick, C.,
Raddatz, T., et al. A reconstruction
of global agricultural areas and land cover for the last millennium [J]. Global Biogeochemical Cycles, 2008,
22(3): 1–16.
[11]
Klein Goldewijk, K., Verburg,
P. H. Uncertainties in global-scale reconstructions of historical land use: an
illustration using the HYDE data set [J]. Landscape
Ecology, 2013, 28: 861–877.
[12]
Cao, X., Jin, X. B., Wang, J.
S., et al. Reconstruction and change
analysis of cropland data of China in recent 300 years [J]. Acta Geographica Sinica, 2014, 69(7):
896–906.
[13]
Fang, X. Q., Zhao, W. Y.,
Zhang, C. P., et al. Methodology for
credibility assessment of historical global LUCC datasets [J]. Science China Earth Sciences, 2020, 63(7):
1013–1025.
[14]
He, F. N., Li, M. J., Yang, F.
Main progress in historical land use and land cover change in China during the
past 70 years [J]. Journal of Chinese
Historical Geography, 34(4): 5–16.
[15]
He, F. N., Li, S. C., Zhang, X.
Z., et al. Comparisons of
reconstructed cropland area from multiple datasets for the traditional
cultivated region of China in the last 300 years [J]. Acta Geographica Sinica, 67(9): 1190–1200.
[16]
Fang, X. Q., He, F. N., Wu, Z.
L., et al. General characteristics of
the agricultural area and fractional cropland cover changes in China for the
past 2000 years [J]. Acta Geographica
Sinica, 76(7): 1732–1746.
[17]
He, F. N., Yang, F. Zhao, C.
S., et al. Spatially explicit
reconstruction of cropland cover for China over the past millennium [J]. Science China Earth Sciences, 66(1):
111–128.
[18]
Wu, Z. L., Fang, X. Q., Jia,
D., et al. Reconstruction of cropland
cover using historical literature and settlement relics in farming areas of
Shangjing Dao during the Liao Dynasty around 1100 AD [J]. The Holocene, 2020, 30(11): 1516–1527.
[19]
Wu, Z. L., Fang, X. Q., Ye, Y.
A settlement density based allocation method for historical cropland cover: a
case study of Jilin Province, China [J]. Land,
2022, 11: 1374.
[20]
Zhang, C. P., Fang, X. Q., Ye,
Y., et al. A spatially explicit
reconstruction of cropland cover in China around 1850 C.E. employing new land
suitability based gridded allocation algorithm [J]. Quaternary International, 2022, 641: 62–73.
[21]
Wu, Z. L., Fang, X. Q., Ye, Y.,
et al. Cropland change dataset in
eastern part of the agro-pastoral ecotone in Northern China (from Liao to Jin,
Yuan and Ming) [J/DB/OL]. Digital Journal of Global Change Data
Repository, 2023. https://doi.org/10.3974/geodb.2023.08.01.V1.
[22]
GCdataPR Editorial Office.
GCdataPR data sharing policy [OL]. https://doi.org/10.3974/dp.policy.2014.05
(Updated 2017).
[23]
Jia, D. Relationship between
the abandoned settlements and climate change in northern China over the past
two millennia [D]. Beijing: Beijing Normal University, 2017: 1–92.
[24]
Zhang, L. S., Fang, X. Q., Ren,
G. Y. Environmental changes in the north China farming–grazing transtional zone
[J]. Earth Science Frontiers, 1997, 4(1–2): 127–136.
[25]
Man, Z. M., Ge, Q. S., Zhang,
P. Y. Case studies on the impact of climatic changes on the farming–pastoral
transitional zone in historical period [J]. Geographical
Research, 2000,
19(2): 141–147.
[26]
Ge, Q. S.
China??s Climate Change during the Historical Period [M]. Beijing: Science
Press, 2010.
[27]
Lin, R. G.
Management and Development of Northern Territory during the Liao Dynasty [M].
Beijing: China Social Sciences Press, 1995.
[28]
Han, M. L.
The History of Liao and Jin Dynasties [M]. Beijing: Social Sciences Academic
Press, 1999.
[29]
Han, M. L. Agricultural
exploitation and population carrying capacity of West Liaohe River valley in
Liao and Jin dynasties [J]. Geographic
Research, 2004, 23(5): 678–685.
[30]
Wu, Z. L., Fang, X. Q., Ye, Y.
Reconstruction of historical cropland cover using settlement relics in eastern
part of northern China??s farming–pastoral zone [J]. Journal of Palaeogeography, 2022, 24(6): 1238–1248.
[31]
Tan, Q. X. The Historical Atlas
of China: The Sixth Volume (Song, Liao and Jin Dynasties) [M]. Beijing:
SinoMaps Press, 1996.
[32]
Tuo, T. The History of Liao
Dynasty: Record of Military [M]. Beijing: Zhonghua Book Company, 1974.
[33]
Wu, S. D., Ge, J. X. The
History of Chinese Population: The Third Volume [M]. Shanghai: Fudan University
Press, 2000.
[34]
Li, M. J., He, F. N., Li, S.
C., et al. Reconstruction of the
cropland cover changes in eastern China between the 10th century and 13th
century using historical documents [J]. Scientific
Reports, 2018, 8(1): 13552.
[35]
Han, M. L. Distribution of
settlements and environmental choices in Xila Mulun River Valley and its
neighborhood during the Liao Dynasty [J]. Acta
Geographica Sinica, 2004, 59(4): 543–549.