Dataset of Glaciers Changes in the Northern
Hemisphere in the Past 2000 Years
Ren, P.
J.* Yu, W. S. Xu,
B. Q. Zhang, X. L. Li, J. L.
State Key Laboratory of Tibetan Plateau Earth System,
Environment and Resources (TPESER), Institute of Tibetan Plateau Research,
Chinese Academy of Sciences, Beijing 100101, China
Abstract: Global climate change
has a significant impact on the glacier. Glaciers record the climate change in
the global on a century, millennium, and even longer time scales, which is of
great significance to the study of climate change. Glaciers in the northern
hemisphere cover a large area and are mainly distributed in the Tibetan
Plateau, the Alps, Greenland, Alaska, and other places. The dataset of glaciers
changes in the northern hemisphere in the past 2,000 years was reconstructed
based on temperature or the coupling relationship between temperature and
precipitation, oxygen isotopes in air bubblies of ice core, and the linkage of
??glacier-lake??. The temporal resolution of the data is one year. The dataset is
archived in .shp, .docx, and .xlsx data formats, and consists of 10 data files
with a data size of 136 KB (Compressed into one single file with 87.6 KB). The
results show that under the influence of climate change, glaciers in different
regions of the northern hemisphere have experienced advanced or retreated in
different periods in the past 2,000 years. On the whole, however, it shows that
all glaciers have had a retreat trend during the last several decades.
Keywords: glaciers; climate change; Tibetan Plateau; the Alps; Greenland
DOI: https://doi.org/10.3974/geodp.2022.03.03
CSTR: https://cstr.escience.org.cn/CSTR:20146.14.2022.03.03
Dataset Availability Statement:
The dataset
supporting this paper was published and is accessible through the Digital Journal of Global Change Data Repository
at: https://doi.org/10.3974/geodb.2022.02.01.V1 or
https://cstr.escience.org.cn/CSTR:20146.11.2022.02.01.V1.
1
Introduction
Glaciers are the largest reservoir of fresh water on earth.
It is estimated that the total amount of glaciers account for 2% of the global
water and about 80% of the global available fresh water[1]. Glaciers
are not only the driving factor of global climate change but also record the
climate information on the century, millennium, and even longer time scale. It
is particularly sensitive to global climate change and is of great significance
to reveal its response to global climate change[2]. Glaciers in the northern
hemisphere have retreated under the influence of global warming. Reconstructing
the glaciers changes in the northern hemisphere in the past 2,000 years can
better understand the glaciers changes on the scale of the past millennium and
the impact of climate change on glaciers changes, and provide data support for
revealing the response of modern glaciers to climate change and studying global
climate change. Because of this, this dataset of changes of 22 glaciers in the northern
hemisphere in the past 2,000 years were reconstructed, including 8 glaciers in
the Tibetan Plateau, 1 glacier in Siberia, 1 glacier in the Alps, 3 glaciers in
Alaska, 8 glaciers in Greenland and 1 glacier in Rocky Mountain (Figure 1). The
main methods are temperature or the coupling relationship between temperature
and precipitation, oxygen isotopes in air bubbles of ice core, and linkage of
??glacier-lake??.
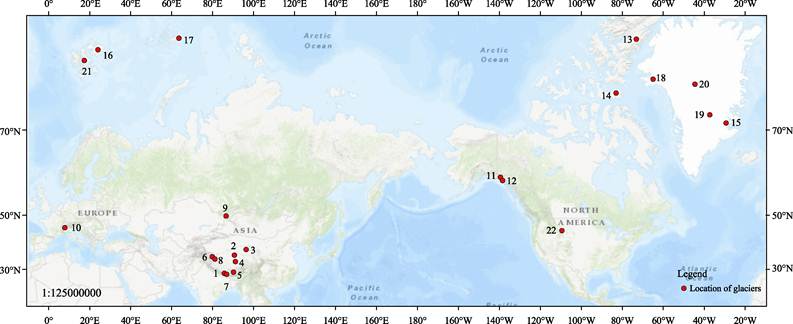
Figure 1 Location of reconstructed 22
glaciers in the northern hemisphere
(1-Dasuopu Glacier, 2-Malan Glacier, 3-Dunde Ice Cap,
4-Longxiazailongba Glacier, 5-Qiangyong Glacier, 6-Glacier in the upper reaches
of Lake Aksai-chin, 7-No.2 Glacier in Mt. Qomolangma, 8-Depchangdak Glacier,
9-Belukha Glacier, 10-Colle Gnifetti Glacier, 11-Eclipse Icefield, 12-Logan
Glacier, 13-Agassiz Ice Cap, 14-Devon Ice Cap, 15-Renland Glacier, 16-Austfonna
Ice Cap, 17-Windy Ice Cap, 18-Akademii Nauk Ice Cap, 19-Top Glacier of
Greenland, 20-Crete Glacier, 21-Lomonosovfonna Glacier, 22-Beartooth Plateau
Glacier)
2 Metadata
of the Dataset
The
metadata of the Dataset of glaciers change in the northern hemisphere during the
past 2,000 years[3] are summarized in Table 1. They include the
dataset full name, authors, data year, temporal resolution, data format, data
size, data publisher, and data sharing policy, etc.
3 Methods
3.1 Raw Data
The raw data include the
published stable isotope record of ice core and accumulation data. Meanwhile,
the stable isotope record of ice core and accumulation data, element in lake
sediment data, and stable isotopes data in air bubbles of ice core in this
study were used. Whether published data or the raw data of this study, the
study methods and processes of these raw data are similar. The specific process
is as follows: (1) drilling ice cores from glaciers; (2) cutting the ice core
into pieces from top to bottom in the laboratory; (3) the
Table
1 Metadata summary of the
Dataset of glaciers changes in northern hemisphere during the past 2,000 years
|
Items
|
Description
|
|
Dataset full name
|
Dataset of glaciers changes in
northern hemisphere during the past 2000 years
|
|
Dataset
short name
|
GlacierChangeNHPast2000
|
|
Authors
|
Ren,
P. J., State Key Laboratory of Tibetan Plateau Earth System, Environment and
Resources (TPESER), Institute of Tibetan Plateau Research, Chinese Academy of
Sciences, renpengjie@itpcas.ac.cn
Yu,
W. S., State Key Laboratory of Tibetan Plateau Earth System, Environment and
Resources (TPESER), Institute of Tibetan Plateau Research, Chinese Academy of
Sciences, yuws@itpcas.ac.cn
Xu,
B. Q., State Key Laboratory of Tibetan Plateau Earth System, Environment and
Resources (TPESER), Institute of Tibetan Plateau Research, Chinese Academy of
Sciences, baiqing@itpcas.ac.cn
Zhang,
X. L., State Key Laboratory of Tibetan Plateau Earth System, Environment and
Resources (TPESER), Institute of Tibetan Plateau Research, Chinese Academy of
Sciences, zhangxiaolong@itpcas.ac.cn
Li, J. L., State Key Laboratory of Tibetan Plateau Earth System,
Environment and Resources (TPESER), Institute of Tibetan Plateau Research,
Chinese Academy of Sciences, jlli@itpcas.ac.cn
|
|
Geographical
region
|
Tibetan
Plateau, Siberia, Alps, Alaska, Greenland, Rocky Mountains
|
|
Year
|
Past
2,000 years
|
|
Temporal
resolution
|
One year
|
|
Data
format
|
.shp,
.docx and .xlsx
|
|
Data
size
|
136
KB (Compressed into one single file with 87.6 KB)
|
|
Foundation
|
Ministry
of Science and Technology of P. R. China (2017YFA0603303??
|
|
Data
publisher
|
Global Change Research Data Publishing &
Repository, http://www.geodoi.ac.cn
|
|
Address
|
No.
11A, Datun Road, Chaoyang District, Beijing 100101, China
|
|
Data
sharing policy
|
Data from
the Global Change Research Data Publishing & Repository includes metadata, datasets
(in the Digital Journal of Global Change Data Repository), and
publications (in the Journal of Global Change Data & Discovery). Data sharing policy
includes: (1) Data are openly available and can be free downloaded via the
Internet; (2) End users are encouraged to use Data subject to
citation; (3) Users, who are by definition also value-added service
providers, are welcome to redistribute Data subject to written permission
from the GCdataPR Editorial Office and the issuance of a Data redistribution
license; and (4) If Data are used to compile new
datasets, the ??ten per cent principal?? should be followed such that Data
records utilized should not surpass 10% of the new dataset contents, while
sources should be clearly noted in suitable places in the new dataset [4]
|
|
Communication and searchable system
|
DOI, CSTR, Crossref, DCI, CSCD,
CNKI, SciEngine, WDS/ISC, GEOSS
|
stable isotope composition of ice core fragments and the
stable isotope composition of ice core wrapped gas were determined by stable
isotope mass spectrometer; (4) retrieving the ice core accumulation data by
stable isotope record of the ice core.
The
study method and process of the lake sediments data in this study are as
follows: (1) drilling sediment core from lakes; (2) cutting the lake sediment
core into pieces from top to bottom in the laboratory; (3) quantitative
analyzing the Na, Mg, Al, K, Ca, and Fe using a Thermo X-7 inductively coupled
plasma-mass spectrometer[5].
3.2 Data Processing
The 22 glaciers changes in the northern hemisphere in the
past 2,000 years were reconstructed based on the coupling relationship between
temperature and precipitation, oxygen isotopes in air bubbles of ice core, and
linkage of ??glacier-lake??. The dataset format refers to Solomina et al.[6].
The coupling relationship of ??temperature +
precipitation?? is mainly based on: when the temperature decreases and the
precipitation increases, the glaciers advance; On the contrary, when the
temperature increases and the precipitation decreases, the glaciers melt. If
there is only a temperature series, the temperature increase corresponds to
glaciers melting, and the temperature decrease corresponds to glaciers??
advance.
Oxygen isotopes in air bubbles of ice core that
measure the isotope value of gas which was drilled from ice core, and then
reconstruct the temperature change history. The stronger the glaciers melting,
the easier the isotope exchange between glaciers and gas, resulting in the gas
isotope being lower. Therefore, the period of the negative value of oxygen
isotopes in air bubbles of ice core indicates the period of glacier advances,
and the period of the positive value indicates the period of glacier retreat.
Figure
2 shows a diagram of the Linkage of ??glacier-lake??. Linkage of ??glacier-lake??
is that the difference (∆ age) between the sedimentary age of proglacial lake
sediments and the sporopollen 14C age in the same layer is a good
index to reflect the intensity of glaciers ablation [7]. On the
premise that the atmospheric dry and wet deposition remains unchanged, the old
atmospheric dust deposited in the glaciers is released with the strengthening
of glaciers melting and flows into the lake deposition, corresponding to the
warmer climate period; When the glacier melts weakly or the glacier advances,
the bedrock is pushed to flow into the lake, increasing of bedrock
contribution, which corresponds to the colder climate period. Therefore, the
indexes and elements are standardized to obtain the dominant elemental PC1
contribution time series of old atmospheric dust and 6 major (Na, Mg, Al, K,
Ca, and Fe) and 26 traces (Li, Sc, Ti, V, Cr, Mn, Co, Ni, Cu, Zn, As, Rb, Sr,
Y, Zr, Nb, Cd, Cs, Ba, Hf, Ta, Tl, Pb, Bi, Th, and U) elements in bedrock, to
indicate the changes of glaciers.
Information
about the reconstructed glaciers changes dataset is shown in Table 2.
4 Data Results
and Validation
4.1 Data Composition
The
formats of the dataset of glaciers changes in the northern hemisphere in the
past 2,000 years are .shp, .docx and .xlsx, including 22 glaciers names,
geographical regions, advancing or retreating periods, and other elements
(Table 3, 4??.
4.2 Data Products
4.2.1 Coupling Relationship between Temperature and
Precipitation
The glaciers changes are
reconstructed according to the coupling relationship between temperature and
precipitation. It is found that the advanced periods of Dasuopu Glacier in
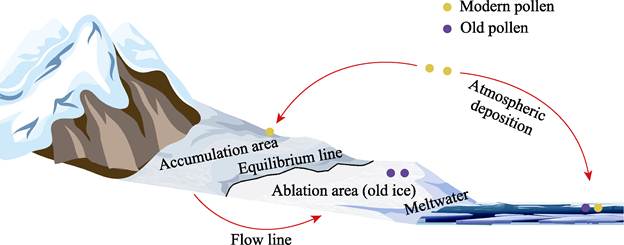
Figure 2 Linkage of ??glacier-lake?? showing accumulated of old
pollen in ablation area and its release to proglacial lake through meltwater (refer
to Zhang et al.[7])
Table 2 Summary of relevant information of the
dataset of glaciers changes in the northern hemisphere in the past 2,000 years
|
No.
|
Glaciers
|
Location
|
Region
|
Reconstruction method
|
Source of raw data
|
|
1
|
Dasuopu
Glacier
|
Mount Shishapangma
|
Tibetan Plateau
|
Coupling
relationship between temperature and precipitation
|
[8]
|
|
2
|
Malan
Glacier
|
Hoh Xil
|
Tibetan Plateau
|
Temperature
|
[9]
|
|
3
|
Dunde
Ice Cap
|
Tsaidam Basin
|
Tibetan Plateau
|
Coupling
relationship between temperature and precipitation
|
This study
|
|
4
|
Longxiazailongba
Glacier
|
Tanggula Mountains
|
Tibetan Plateau
|
Oxygen
isotopes in air bubbles of ice core
|
This study
|
|
5
|
Qiangyong
Glacier
|
Yangzhuoyongcuo Basin
|
Tibetan Plateau
|
Linkage of ??glacier-lake??
|
This study
|
|
6
|
Glacier
in the upper reaches of Lake Aksai-Chin
|
Kunlun Mountains
|
Tibetan Plateau
|
This study
|
|
7
|
No.2
Glacier in Mt. Qomolangma
|
Mt. Qomolangma
|
Tibetan Plateau
|
This study
|
|
8
|
Depchangdak
Glacier
|
Ali
|
Tibetan Plateau
|
This study
|
|
9
|
Belukha
Glacier
|
Altai Mountains
|
Siberia
|
Coupling
relationship between temperature and precipitation
|
[10]
|
|
10
|
Colle
Gnifetti Glacier
|
Switzerland
|
Alps
|
Temperature
|
[11]
|
|
11
|
Eclipse
Icefield
|
Canada
|
Alaska
|
Coupling
relationship between temperature and precipitation
|
[12]
|
|
12
|
Logan
Glacier
|
Alaska
|
Alaska
|
[13]
|
|
13
|
Agassiz
Ice Cap
|
Canada
|
Alaska
|
Temperature
|
[14,15]
|
|
14
|
Devon
Ice Cap
|
Nunavut
|
Greenland
|
[16,17]
|
|
15
|
Renland
Glacier
|
East Greenland
|
Greenland
|
[18]
|
|
16
|
Austfonna
Ice Cap
|
Svalbard Islands
|
Greenland
|
[19]
|
|
17
|
Windy
Ice Cap
|
Franz Josef Islands
|
Greenland
|
[20]
|
|
18
|
Akademii
Nauk Ice Cap
|
Arctic
|
Greenland
|
[21]
|
|
19
|
Top Glacier
of Greenland
|
Greenland
|
Greenland
|
Coupling
relationship between temperature and precipitation
|
[22]
|
|
20
|
Crete
Glacier
|
Central Greenland
|
Greenland
|
[23]
|
|
21
|
Lomonosovfonna
Glacier
|
Svalbard Islands
|
Greenland
|
Temperature
|
[24]
|
|
22
|
Beartooth
Plateau Glacier
|
Wyoming
|
Rocky Mountains
|
[25]
|
Mount Shishapangma
were 1851-1857, 1870-1875, 1883-1890, 1908-1915, and 1966-1973, and the retreated periods were 1848-1851, 1862-1870, 1875-1883, 1890-1903, 1915-1966, 1973-1980 and 1985-1994, specially since 1915, the melting of the
glacier has shown an increasing trend (Figure 3). Using similar methods, 16
glaciers were reconstructed, including Malan Glacier, Dunde Ice Cap, Belukha
Glacier, Colle Gnifetti Glacier, Eclipse Icefield, Logan Glacier, Agassiz Ice
Cap, Devon Ice Cap, Renland Glacier, Austfonna Ice Cap, Windy Ice Cap, Akademii
Nauk Ice Cap, Top Glacier in Greenland, Crete Glacier, Lomonosovfonna Glacier,
and Beartooth Plateau Glacier (see the dataset file for details).
Table 3 Periods of
glaciers advances
|
No.
|
Glaciers
|
Region
|
Location
|
Reconstruction Method
|
Centuries
|
Source of Raw Data
|
|
1
|
Dasuopu Glacier
|
Tibetan Plateau
|
Mount Shishapangma
|
Coupling relationship between temperature and precipitation
|
1851-1857, 1870-1875, 1883-1890, 1908-1915, 1966-1973
|
[8]
|
|
2
|
Malan Glacier
|
Hoh Xil
|
Temperature
|
1690-1773
|
[9]
|
|
3
|
Dunde Glacier
|
Tsaidam Basin
|
Coupling relationship between temperature and precipitation
|
-
|
This study
|
|
4
|
Longxiazailongba Glacier
|
Tanggula Mountains
|
Oxygen isotopes in air bubbles of ice core
|
100-300, 1200-1900
|
This study
|
|
5
|
Qiangyong Glacier
|
Yangzhuoyongcuo Basin
|
Linkage of ??glacier-lake??
|
600-800, 1050-1850
|
This study
|
|
6
|
Glacier in the upper reaches of Lake Aksai-Chin
|
Kunlun Mountains
|
Linkage of ??glacier-lake??
|
1811-1970
|
This study
|
|
7
|
No.2 Glacier in Mt. Qomolangma
|
Mt. Qomolangma
|
Linkage of ??glacier-lake??
|
1920-1940, 1993-1972
|
This study
|
|
8
|
Depchangdak Glacier
|
|
Ali
|
Linkage of ??glacier-lake??
|
-
|
This study
|
|
9
|
Belukha Glacier
|
Siberia
|
Altai Mountains
|
Coupling relationship between temperature and precipitation
|
1825-1832, 1884-1890
|
[10]
|
|
10
|
Colle Gnifetti Glacier
|
Alps
|
Switzerland
|
Temperature
|
1000-1360, 1845-1878
|
[11]
|
|
11
|
Eclipse Icefield
|
Alaska
|
Canada
|
Coupling relationship between temperature and precipitation
|
1976-1992
|
[12]
|
|
12
|
Logan Glacier
|
Alaska
|
Coupling relationship between temperature and precipitation
|
1825-1925
|
[13]
|
|
13
|
Agassiz Ice Cap
|
Canada
|
Temperature
|
1815-1858
|
[14,15]
|
|
14
|
Devon Ice Cap
|
Greenland
|
Nunavut
|
Temperature
|
-
|
[16,17]
|
|
15
|
Renland Glacier
|
East Greenland
|
Temperature
|
1450-1700
|
[18]
|
|
16
|
Austfonna Ice Cap
|
Svalbard Islands
|
Temperature
|
1470-1493, 1580-1621, 1737-1773
|
[19]
|
|
17
|
Windy Ice Cap
|
Franz Josef Islands
|
Temperature
|
1425-1470, 1560-1590, 1750-1773
|
[20]
|
|
18
|
Akademii Nauk Ice Cap
|
Arctic
|
Temperature
|
1937-1948
|
[21]
|
|
19
|
Top Glacier of Greenland
|
Greenland
|
Coupling relationship between temperature and precipitation
|
493-800, 1260-1820
|
[22]
|
|
20
|
Crete Glacier
|
Central Greenland
|
Coupling relationship between temperature and precipitation
|
1620-1665, 1760-1800
|
[23]
|
|
21
|
Lomonosovfonna Glacier
|
Svalbard Islands
|
Temperature
|
810-850, 900-980, 1250-1850
|
[24]
|
|
22
|
Beartooth Plateau Glacier
|
Rocky Mountains
|
Wyoming
|
Temperature
|
630-800, 1050-1400, 1690-1775
|
[25]
|
4.2.2 Oxygen Isotopes in Air Bubbles of Ice Core
The
temperature records of the past 3,600 years were reconstructed using the oxygen
isotopes in air bubbles of the ice core in the Longxiazailongba Glacier (Figure
4). It can be seen that there were three periods of glacier advances (1600 B.C.-400 B.C., 100-300
A.D., 1200-1900 A.D.) and three periods of
glacier retreats (400 B.C.-100
A.D., 300-1200 A.D., 1900 A.D. to the
present).
Table 4 Periods
of glaciers retreats
|
No.
|
Glaciers
|
Region
|
Location
|
Reconstruction Method
|
Centuries
|
Source of raw data
|
|
1
|
Dasuopu Glacier
|
Tibetan Plateau
|
Mount Shisha-
pangma
|
Coupling relationship
between temperature and precipitation
|
1848-1851, 1862-1870, 1875-1883, 1890-1903, 1915-1966, 1973-1980, 1985-1994
|
[8]
|
|
2
|
Malan Glacier
|
Hoh Xil
|
Temperature
|
1450-1690, 1773-2000
|
[9]
|
|
3
|
Dunde Glacier
|
Tsaidam Basin
|
Coupling relationship
between temperature and precipitation
|
>1950
|
This study
|
|
4
|
Longxiazailongba Glacier
|
Tanggula
Mountains
|
Oxygen isotopes
in air bubbles of ice core
|
300-1200, >1900
|
This study
|
|
5
|
Qiangyong Glacier
|
Yangzhuo-
yongcuo Basin
|
Linkage of ??glacier-lake??
|
100-600, 850-1050, >1850
|
This study
|
|
6
|
Glacier in the upper reaches of Lake Aksai-Chin
|
Kunlun Mountains
|
Linkage of
??glacier-lake??
|
>1970
|
This study
|
|
7
|
No.2 Glacier in Mt. Qomolangma
|
Mt. Qomo-
langma
|
Linkage of ??glacier-lake??
|
1940-1972, 1993-2020
|
This study
|
|
8
|
Depchangdak Glacier
|
Ali
|
Linkage of ??glacier-lake??
|
1733-1910
|
This study
|
|
9
|
Belukha Glacier
|
Siberia
|
Altai Mountains
|
Coupling
relationship between temperature and precipitation
|
1840-1851, 1870-1881, 1898-1990, 1960-2000
|
[10]
|
|
10
|
Colle Gnifetti Glacier
|
Alps
|
Switzerland
|
Temperature
|
>1878
|
[11]
|
|
11
|
Eclipse Icefield
|
Alaska
|
Canada
|
Coupling relationship
between temperature and precipitation
|
1932-1976
|
[12]
|
|
12
|
Logan Glacier
|
Alaska
|
Coupling relationship
between temperature and precipitation
|
1749-1825, 1960-1965
|
[13]
|
|
13
|
Agassiz Ice Cap
|
Canada
|
Temperature
|
1741-1815, >1858
|
[14,15]
|
|
14
|
Devon Ice Cap
|
Greenland
|
Nunavut
|
Temperature
|
1850-1960
|
[16,17]
|
|
15
|
Renland Glacier
|
East Greenland
|
Temperature
|
1250-1450, 1700-2000
|
[18]
|
|
16
|
Austfonna Ice Cap
|
Svalbard Islands
|
Temperature
|
1773-2000
|
[19]
|
|
17
|
Windy Ice Cap
|
Franz Josef
Islands
|
Temperature
|
1220-1380, 1773-2000
|
[20]
|
|
18
|
Akademii Nauk Ice Cap
|
Arctic
|
Temperature
|
1885-1937, 1973-2000
|
[21]
|
|
19
|
Top Glacier of Greenland
|
Greenland
|
Coupling relationship
between temperature and precipitation
|
800-1044, 1820-1900
|
[22]
|
|
20
|
Crete Glacier
|
Central Greenland
|
Coupling relationship
between temperature and precipitation
|
1888-1980
|
[23]
|
|
21
|
Lomonosov-
fonna Glacier
|
Svalbard Islands
|
Temperature
|
850-900, 980-1010, 1850-2000
|
[24]
|
|
22
|
Beartooth Plateau Glacier
|
Rocky Mountains
|
Wyoming
|
Temperature
|
800-1050, 1775-1950
|
[25]
|
4.2.3 Linkage of ??Glacier-Lake??
The
change of Qiangyong Glacier was reconstructed by using the linkage of
??glacier–lake??. It can be seen that the periods of glacier advances were 560 B.C.-100 A.D., 600-800
A.D., 1050-1850 A.D., and the periods of
glacier retreats were 100-600
A.D., 850-1050 A.D., 1850 A.D. to the
present (Figure 5). Similar methods are used to reconstruct the changes in the
West Kunlun Glacier, Depchangdak Glacier and No.2 Glacier in Mt. Qomolangma
(see the dataset file for details).

Figure 3 Reconstruction of the Dasuopu Glacier
changes based on the coupling relationship between temperature and
precipitation
(Notes: a. The black line represents the ??18O anomaly
of ice core (??18O_ice Anomaly) derived from the Dasuopu Glacier, the
purple line represents the temperature of the northern hemisphere (NH
Temperature); b. the accumulation anomaly of the ice core in Dasuopu Glacier.
Strength of the glacier melt: the darker the pink and the stronger the glacier
melt, the darker the green and the stronger the glacier accumulation)
5 Discussion and Conclusion
Climate
change on a long-timescale was recorded in the glaciers. They are not only
significantly affected by global climate change, but also have a significant
impact on global climate change. It is of great scientific significance to
reveal the mechanism of climate change. This dataset inverses the changes of 22
glaciers in the northern hemisphere in the past 2,000 years, and reveals the
response of glaciers to climate change based on temperatureor the coupling
relationship between temperature and precipitation, oxygen isotopes in air
bubbles of ice core, linkage of ??glacier-lake??. From the results, the dataset
reflects the fluctuating changes in advanced and retreated of 22 glaciers in
the recent 2,000 years. However, the glacier changes in the past 2,000 years
present a retreated process generally. This dataset provides reference and
support for the study of glaciers changes and climate change. It is of great
significance to reveal the interaction between climate change and glaciers.
Author Contributions
Yu, W. S. and Xu, B. Q. designed the algorithms of
dataset, and modified the data paper; Ren, P. J. wrote the data paper, made and
sorted out the dataset; Zhang, X. L. and Li, J. L. collected basic data.
Conflicts
of Interest
The authors declare no conflicts of interest.
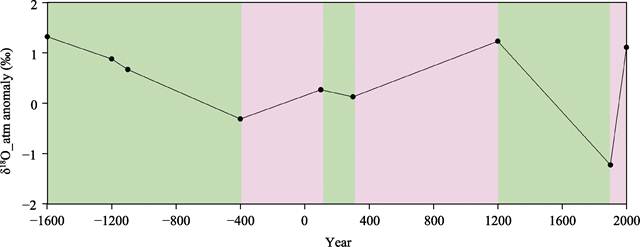
Figure 4 Reconstruction of the Longxiazailongba
Glacier changes based on the oxygen isotope in air bubblies of the ice core
derived from the Longxiazailongba Glacier
(Notes: The green represents the periods of glacier advances; the
pink represents the period of glacier retreats)
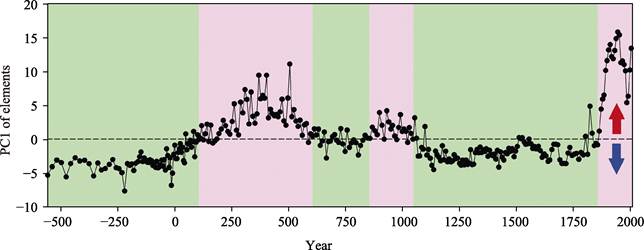
Figure 5 Reconstruction of the Qiangyong Glacier
changes based on the PC1 of elements of the sediment derived from the Qiangyong
Lake using the linkage of ??glacier-lake??
(Notes: The
green shadows represent the periods of glacier advances; the pink shadows
represent the periods of glacier
retreats; the blue arrow represents the glacier advances, and the red arrow
represents the glacier retreats)
References
[1] Miao, Q. L., Jiang, Z. H., Chen, H. S., et al.
Modern climatology [M]. Beijing: China Meteorological Press, 2010.
[2] Xie, Z. C., Liu, C. H. Introduction to
Glaciology [M]. Shanghai: Shanghai Science Popularization press, 2010.
[3]
Ren, P. J.,
Yu W.S., Xu, B. Q., et al. Dataset of glaciers changes in northern
hemisphere during the past 2000 years [J/DB/OL]. Digital Journal of Global Change Data Repository, 2022.
https://doi.org/10.3974/ geodb.2022.02.01.V1.
https://cstr.escience.org.cn/CSTR:20146.11.2022.02.01.V1.
[4]
GCdataPR
Editorial Office. GCdataPR data sharing policy [OL]. https://doi.org/10.3974/dp.policy.2014.05
(Updated 2017).
[5]
Zhang, X. L.,
Xu, B. Q., Li, J. L., et al.
Late-Holocene fluctuations of monsoonal Qiangyong Glacier, southern Tibetan
Plateau [J]. Holocene, 2021, 21: 1-10. https://doi.org/10.1177/09596836211003209.
[6]
Solomina,
O. N., Bradley, R. S., Jomelli, V., et al.
Glacier fluctuations during the past 2000 years [J]. Quaternary Science Reviews, 2016, 149: 61-90.
http://dx.doi.org/10.1016/j.quascirev.2016.04.008.
[7]
Zhang, J. F.,
Xu, B. Q., Turner, F., et al.
Long-term glacier melt fluctuations over the past 2500 yr in monsoonal High
Asia revealed by radiocarbon-dated lacustrine pollen concentrates [J]. Geology, 2017, 45(4): 359-362.
https://sci-hub.se/10.1130/G38690.1.
[8]
Thompson,
L. G., Yao, T. D., Mosley-Thompson, E., et
al. A high-resolution millennial record of the South Asian Monsoon from
Himalayan ice cores [J]. Science,
2000, 289: 1916–1919.
[9] Wang, N. L., Thompson, L. G., Davis, M. E., et al. Influence of variations in NAO
and SO on air temperature over the northern Tibetan Plateau as recorded by ??18O
in the Malan ice core [J]. Geophysical Research Letters, 2003,
30: 2167.
[10] Eichler, A., S. Olivier, K. Henderson, K., et al. Temperature response in the Altai
region lags solar forcing [J].
Geophysical Research Letters, 2009, 36: L01808.
https://doi.org/10.1029/2008GL035930.
[11] Bohleber, P., Erhardt, T., Spaulding, N., et al. Temperature and mineral dust
variability recorded in two low-accumulation Alpine ice cores over the last
millennium [J]. Climate of the Past, 2018, 14(1): 21–37. https://doi.org/10.5194/cp-14-21–2018.
[12]
Yalcin, K.,
Wake, C. P. Anthropogenic signals recorded in an ice core from Eclipse
Icefield, Yukon Territory [J]. Geophysical
Research Letters, 2001, 28: 4487–4490.
[13]
Moore, G. W.
K., Holdsworth, G., Alverson, K. Climate change in the North Pacific region
over the past three centuries [J]. Nature,
2002, 420: 401-403.
https://doi.org/10.1038/nature01229.
[14]
Fisher, D.
A., Koerner, R. M., Reeh, N. Holocene Climatic Records from Agassiz Ice Cap,
Ellesmere Island, NWT, Canada [J]. Holocene,
1995, 5: 19–24.
[15]
Fisher, D.
A., Koerner, R. M. Signal and noise in four ice-core records from the Agassiz
Ice Cap, Ellesmere Island, Canada: details of the last millennium for stable
isotopes, melt and solid conductivity [J]. Holocene,
1994, 4: 113–120.
[16]
Fisher, D. A.,
Koerner, R. M. Some aspects of climatic change in the High Arctic during the
Holocene as deduced from ice cores [J]. Quaternary
Climatic Change Symposium, 1979, 33: 349–371.
[17]
Fisher, D. A.
Comparison of 100,000 years of oxygen isotope and insoluble impurity profiles
from the Devon Island and Camp Century ice cores [J]. Quaternary Research, 1979, 11: 299–304.
[18]
Holme, C.,
Gkinis, V., Lanzky, M., et al.
Varying regional ??18O-temperature relationship in high-resolution
stable water isotopes from east Greenland [J]. Climate of the Past, 2019, 15: 893–912.
https://doi.org/10.5194/cp-15-893-2019.
[19]
Saksson,
E., Divine, D., Kohler, J., et al.
Climate oscillations as recorded in Svalbard ice core ??18O records
between 1200-1997 AD [J]. Geografiska Annaler: Series A, Physical Geography, 2005, 87(1): 203-214.
https://doi.org/10.1111/j.0435-3676.2005.00253.x.
[20]
Kinnard,
C., Zdanowicz, C. M., Fisher, D. A., Reconstructed changes in Arctic Sea ice
over the past 1450 years [J]. Nature,
2011, 479(7374): 509–512. https://doi.org/10.1038/nature10581.
[21] Clausen, H., Gundestrup, N., Johnsen, S., et al. Glaciological investigations in
the Cr??te area, Central Greenland: a search for a new deep-drilling site [J]. Annals of Glaciology, 1988, 10: 10-15. DOI: 10.3189/S0260305500004080.
[22]
Alley, R. B.
The younger dryas cold interval as viewed from central Greenland [J]. Quaternary Science Reviews, 2000, 19:
213–226.
[23]
Clausen, H.
B., Gundestrup, N. S., Johnsen, S. J., et
al. Glaciological Investigations in the Crete area, central Greenland: a
search for a new deep-drilling site [J]. Annals
of Glaciology, 1988, 10: 10–15.
[24]
Divine, D.,
Isaksson, E., Martma, T., et al.
Thousand years of winter surface air temperature variations in Svalbard and
northern Norway reconstructed from ice-core data [J]. Polar Research, 2011, 30(1): 73–79.
https://doi.org/10.3402/polar.v30i0.7379.
[25] Chellman, N. J., Pederson, G. T., Lee, C. M., et
al. High elevation ice patch documents Holocene climate variability in the
northern Rocky Mountains [J]. Quaternary
Science Advances, 2021, 3: 1-8. https://doi.org/10.1016/j.qsa.2020.100021.