Dataset of Global Lake Level Changes Using Multi- altimeter Data (2002-2016)
Liao, J. J.1,2* Shen, G. Z.1 Zhao, Y.1,3
1. Key Laboratory of Digital Earth Science, Institute of Remote Sensing and Digital Earth, Chinese Academy of Sciences, Beijing 100101, China;
2. Key Laboratory of Earth Observation, Hainan Province, Sanya 572029, China;
3. University of Chinese Academy of Sciences, Beijing 100049, China
Abstract: Lake level is an important indicator of regional and global environmental changes. A dataset of lake level changes from 2002 to 2016 for 118 lakes (57 in Asia and Europe, 31 in North America, 14 in Africa, 10 in South America, and 6 in Oceania) with an area of more than 400 km² has been developed. The dataset was compiled through lake boundary delineation, water level calculation, outlier removal, Gaussian filtering, and elevation system conversion, and was developed based on geophysical data record (GDR) data from ENVISAT/RA-2, Cryosat-2/SIRAL, Jason-2, and MODIS images. The water level data for each lake include the daily water level, and the monthly and annual average water levels. The average annual rate of water level change for each lake from 2002 to 2016 was calculated by a simple linear regression. The accuracy of the estimated water level was confirmed to the decimeter-centimeter level, and was verified by lake gauge data from Qinghai Lake, Poyang Lake, and the Great Lakes of North America. The dataset is archived in .xlsx and .shp data formats, with data size of 3.71 MB in 126 data files (compressed to 3.48 MB in one file).
Keywords: lake level change; globe; multi-altimeter; geophysical data record
1 Introduction
As primary water reservoirs, lakes play an important role in water supply and adjustment, and reflect the impact of climate change and human activities on regional and global environmental changes[1–5]. The area and water level of lakes are important parameters in the estimation of water volume. The area of lakes can be rapidly and effectively monitored using remote sensing data[6–7]. However, adequate and accurate measurements of lake levels can be difficult. In situ gauges can measure high-precision lake level data, but are expensive to maintain and are challenging to operate in remote areas. Furthermore, the total number of gauge stations has decreased in recent years[8–9], and lake level data in many countries and regions are not freely available to the public. These factors have seriously hindered the development of continuous and effective monitoring of water levels in lakes at the global and regional levels, and the use of the collected information[10].
Satellite altimetry technology is an effective tool that can be used to measure the dynamics of the surface elevation of the Earth, and has been used successfully for more than two decades to measure lake levels[11–16]. In this study, a dataset of water level changes from 2002 to 2016 for 118 lakes, with an area of more than 400 km2, was developed. The dataset was compiled through lake boundary delineation, water level calculation, outlier removal, Gaussian filtering, and elevation system conversion, and was developed based on geophysical data record (GDR) information from ENVISAT/RA-2, Cryosat-2/SIRAL, Jason-2, and MODIS images.
2 Metadata of Dataset
The metadata of the dataset of lake level changes in the globe using multi-altimeter data (2002-2016)[17] is summarized in Table 1, including dataset name, authors, year, data format, data size, data files, data publisher, and data sharing policy, etc.
3 Methods
The spaceborne radar altimeter data used in this study included ENVISAT/RA-2 and Cryosat-2/SIRAL data from the European Space Agency (ESA), as well as US Jason-2 data. ENVISAT/RA-2 data was acquired from 2002 to 2012, Cryosat-2/SIRAL data was available from 2010 to 2016, and Jason-2 data was available from 2008 to 2016. The altimeter data from all three spaceborne radar were GDR products, while the corresponding MODIS images were MOD13Q1 data products.
3.1 Algorithm and Data Pre-processing
The altimeter GDR data was processed, and the elevation hortho of each point on a lake’s surface was obtained using formula (1):
 (1)
(1)
where halt is the height of the satellite, hgeoid is the height of the reference ellipsoid, R is the range from the satellite to the lake, and ΔR is an error correction that includes the ionosphere, dry and wet troposphere, solid earth tide, ocean tide, and pole tide.
These data were then pre-processed. Firstly, the thresholds of different temporal images over lakes were selected using the NDVI channel of MODIS MOD13Q1 products, and then the processing, including coordinate projection conversion, batch cutting, density segmentation, and the conversion from raster to vector, was conducted using the ENVI software. The boundary of each lake was delineated for the period from 2002 to 2016. Secondly, a visual interpretation was made to remove the outliers in all 20 Hz elevation measurements, and then the difference among the average water levels was determined. Then, a visual interpretation was conducted to remove the outliers again. The daily water level was obtained by removing outliers using the 3σ criterion and averaging all the valid water levels for each daily data. The Gaussian filtering method was used to remove noise from the overall daily water levels, and a time series of lake levels was obtained. The monthly average water level was obtained based on daily water levels, and the annual average water level was obtained based on monthly water levels.
Table 1 Metadata summary for the dataset of lake level changes in the globe using multi-altimeter data (2002–2016)
|
Items
|
Description
|
|
Dataset full name
|
Dataset of lake level changes in the globe using multi-altimeter data (2002–2016)
|
|
Dataset short name
|
GlobeLakeLevelChange_2002-2016
|
|
Authors
|
Liao, J. J. O-2034-2018, Key Laboratory of Digital Earth Science, Institute of Remote Sensing and Digital Earth, Chinese Academy of Sciences; Key Laboratory of Earth Observation, Hainan province, liaojj@radi.ac.cn
Shen, G. Z. T-2721-2018, Key Laboratory of Digital Earth Science, Institute of Remote Sensing and Digital Earth, Chinese Academy of Sciences, shengz@radi.ac.cn
|
|
|
Zhao, Y. T-2734-2018, Key Laboratory of Digital Earth Science, Institute of Remote Sensing and Digital Earth, Chinese Academy of Sciences; University of Chinese Academy of Sciences, zhaoyun@radi.ac.cn
|
|
Geographical region
|
Global
|
|
Year
|
2002–2016 Data format .xlsx, .shp
|
|
Data size
|
3.48 MB (after compression) Data files 126
|
|
Foundation(s)
|
Ministry of Science and Technology of P. R. China (2016YFB0501501); National Development and Reform Commission (2016-999999-65-01-000696-01)
|
|
Data publisher
|
Global Change Research Data Publishing & Repository, http://www.geodoi.ac.cn
|
|
Address
|
No. 11A, Datun Road, Chaoyang District, Beijing 100101, China
|
|
Data sharing policy
|
Data from the Global Change Research Data Publishing & Repository includes metadata, datasets (data products), and publications (in this case in the Journal of Global Change Data & Discovery). The data sharing policy is as follows: (1) Data are openly available and can be freely downloaded via the Internet; (2) End users are encouraged to use data subject to citation; (3) Users, who are by definition also value-added service providers, are welcome to redistribute data subject to written permission from the GCdataPR Editorial Office and the issuance of a data redistribution license; and (4) If data are used to compile new datasets, the ‘10% principal’ should be followed, i.e., the data records extracted from this data set are less than 10% of the new data set, and simultaneously data sources are labelled[7]
|
3.2 Implementation
Water levels were extracted using the above algorithm based on the Cryosat-2, Janson-2, and ENVISAT/RA-2 data, and the extracted water levels were then fused to obtain a time series of lake levels from 2002 to 2016. Because the Cryosat-2, Janson-2, and ENVISAT/RA-2 data were acquired based on the gravity field model of the EGM96, the water levels obtained from the three sets of altimeter data did not require an elevation system conversion. However, the systematic deviations between the three sets of altimeter data did require correction. The Jason-2 data had a longer overlap with the other two sets of altimeter data, and therefore the average difference between the water levels of the Cryosat-2 and ENVISAT/RA-2 data and the Jason-2 water level was calculated based on the Jason-2 data. Based on the calculated difference, the daily water level was obtained by converting the two water levels to the same level as Janson-2. If there were multiple water levels at a certain time, these water levels (two or three) were averaged to derive the water level at this time. A time series of daily water levels was obtained by the fusion of the three sets of altimeter data, and time series of average monthly and annual water levels were obtained. The annual average trends of water levels from 2002 to 2016 were obtained based on a time series of annual average water levels using a simple linear regression.
The water levels obtained from the altimeter data were converted to the same geoid as the gauge water levels based on the average difference between the time series of water levels and gauge water levels. Furthermore, the accuracy of the lake level was compared through a correlation between the lake levels extracted from the altimeter data and gauge data, the root mean square error (RMSE), and the number of water levels. A flowchart of this process is shown in Figure 1.
|
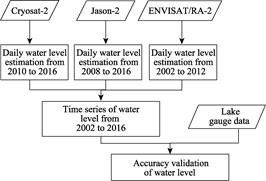
Figure 1 Flowchart showing the determination of a
lake level time series using multi-altimeter data
|
4 Results and Validation
4.1 Data Composition
This dataset includes a time series of water level changes from 2002 to 2016 for 118 lakes, with an area of more than 400 km2. The time series of the water level in each lake includes the daily water level, and the average monthly and annual water levels. The average annual rate of water level change for each lake from 2002 to 2016 was calculated by a simple linear regression. The dataset is archived in .xlsx and .shp formats, with a data size of 3.71 MB in 126 data files (Compressed to 3.48 MB in one file).
4.2 Results
The 118 lakes in the dataset include 57 in Asia and Europe, 31 in North America, 14 in Africa, 10 in South America, and 6 in Oceania. Among them, 93 lakes have an area of more than 1,000 km2 and 25 lakes have an area of less than 1,000 km2. The time series of water level in each lake includes the daily water level, and the average monthly and annual water levels. The average annual rate of water level change in each lake from 2002 to 2016 was obtained by a simple linear regression (Figure 2, Table 2). The water level changes in the lakes are as follows.
(1) Asia and Europe
A total of 57 lakes were monitored. The water levels of 25 lakes displayed a decreasing trend, while the water levels of the other 32 lakes displayed an increasing trend. The annual average rate of water level change in most lakes from 2002 to 2016 was between -20.0 and 30.0 cm/a. The water level of Lake Siling Co had the most rapid rise, with a change rate of 37.7 cm/a. The water level of the southwest Aral Sea had the most significant decrease, with a change rate of -43.0 cm/a. The water levels of the Tibetan lakes displayed an obvious increasing trend, although after 2010 the water level changes were not significant. The lake levels generally declined in the arid and semi-arid regions of Central Asia. The water levels of eight freshwater lakes in Europe, including Lake Ladoga and Lake Onega, were found to be rising, while lake levels in East Asia fluctuated, with both decreases and increases recorded.
(2) North America
A total of 31 lakes were monitored. The water levels of nine lakes displayed a declining trend, while the water levels of the other 22 lakes displayed an increasing trend. Amadjuak Lake had the most rapid rise, with a change rate of 42.8 cm/a. The annual average rate of water level changes in most lakes ranged from -10.0 to 10.0 cm/a. Overall, the water level changes were not significant. The annual water level changes of lakes, such as the Great Slave Lake, Athabasca Lake, and Wollaston Lake, were slight and relatively stable.
|

Figure 2 Annual average changes of water level in selected global lakes from 2002 to 2016
|
(3) Africa
A total of 14 lakes were monitored. The water levels of 10 lakes displayed an increasing trend, while the water levels of the other four lakes displayed a decreasing trend. The annual average rate of water level change from 2002 to 2016 was between -10.0 and 20.0 cm/a. Lake Turkana had the most rapid rise, with a change rate of 15.0 cm/a.
(4) South America
A total of 10 lakes were monitored. The water levels of seven lakes displayed a declining trend. The other three lakes, Lake Maracaibo, Lago Llanquihue, and Ranco Lake, had increasing water levels. The annual average water level change in most lakes from 2002 to 2016 ranged from -20.0 to 10.0 cm/a. The water level of Ranco Lake had the most rapid rise, with a change rate of 20.5 cm/a.
(5) Oceania
A total of six lakes were monitored. Most were seasonal and often dried out or became shut off. Lake Mackay and Lake Frome had increasing water levels, while the other four lakes displayed a decreasing trend. The annual average rate of water level change from 2002 to 2016 was between -10.0 and 30.0 cm/a.
4.3 Data Validation
The accuracy of water level estimation was validated using lake gauge data from Qinghai Lake, Poyang Lake, and the Great Lakes of North America. The lake gauge data from Qinghai Lake was used to determine the daily average water level from May to October of 2002–2012. The accuracies of the daily and monthly averages were calculated using this data (Table 3). The root-mean-square error (RMSE) of the daily water level was 0.185 m, and the correlation coefficient was 0.907. The RMSE of the monthly average water level was 0.177 m, and the correlation coefficient was 0.93.
Similarly to the method used to verify the water level accuracy of Qinghai Lake, the accuracy of the water level estimation was validated using lake gauge data for Poyang Lake from January to December of 2005–2014. The results are shown in Table 4. Because the water level changes of Poyang Lake were large and complicated, the accuracy of the water level estimation was low, with an RMSE of about 0.7 m.
Table 2 Lake level annual change rates
|
ID
|
Lake
|
Annual change rate (cm/a)
|
ID
|
Lake
|
Annual Change rate (cm/a)
|
ID
|
Lake
|
Annual Change rate (cm/a)
|
|
1
|
Lake Issyk-Kul
|
0.4
|
41
|
Tangra yumco
|
19.0
|
81
|
Lake Winnipegosis
|
9.6
|
|
2
|
Sarygamysh Lake
|
16.6
|
42
|
Zhari Namco
|
12.7
|
82
|
Cedar Lake
|
2.9
|
|
3
|
Lake Balkhash
|
1.7
|
43
|
Taro Co
|
‒11.8
|
83
|
Dauphin Lake
|
6.1
|
|
4
|
Alakol Lake
|
‒8.4
|
44
|
Ngangla Ringco
|
‒2.6
|
84
|
Amadjuak Lake
|
42.8
|
|
5
|
Uvs Nuur
|
‒6.5
|
45
|
Banggong Co
|
5.8
|
85
|
Nettilling Lake
|
0.2
|
|
6
|
Khyargas Nuur
|
‒35.6
|
46
|
Bosten Lake
|
‒17.6
|
86
|
Great Salt Lake
|
‒3.8
|
|
7
|
Khovsgol Lake
|
‒0. 2
|
47
|
Ebinur Lake
|
‒3.9
|
87
|
Lake St. Clair
|
1.1
|
|
8
|
Har Us Nuur
|
4.8
|
48
|
Ulungur Lake
|
11.8
|
88
|
Lake Clare
|
‒2.0
|
|
9
|
Lake Baikal
|
‒13.3
|
49
|
Hulun Nuur
|
‒1.9
|
89
|
Lake Victoria
|
6.5
|
|
10
|
Xingkai Lake
|
7.4
|
50
|
Sayram Lake
|
1.5
|
90
|
Lake Tanganyika
|
12.0
|
|
11
|
Lake Ladoga
|
2.0
|
51
|
Ayakkum Lake
|
32.8
|
91
|
Lake Malawi
|
‒7.0
|
|
12
|
Lake Onega
|
2.3
|
52
|
Dongting Lake
|
‒6.1
|
92
|
Lake Kariba
|
0.1
|
|
13
|
Lake Taymyr
|
‒1.9
|
53
|
Poyang Lake
|
‒6.0
|
93
|
Lake Cahora Bassa
|
13.7
|
|
14
|
Lake Vaner
|
3.4
|
54
|
Chaohu Lake
|
2.5
|
94
|
Lake Turkana
|
15.0
|
|
15
|
Lake Vatter
|
1.2
|
55
|
Taihu Lake
|
0.9
|
95
|
Lake Albert
|
‒6.5
|
|
16
|
Tonle Sap
|
‒15.7
|
56
|
Gaoyou Lake
|
5.3
|
96
|
Lake Kyoga
|
‒8.2
|
|
17
|
Lake Urmia
|
‒19.5
|
57
|
Hongze Lake
|
‒0.1
|
97
|
Lake Edward
|
2.7
|
|
18
|
Lake Van
|
‒1.8
|
58
|
Lake Superior
|
3.0
|
98
|
Lake Kivu
|
6.6
|
|
19
|
Lake Sevana
|
24.2
|
59
|
Lake Michigan
|
3.8
|
99
|
Lac Moeru
|
4.7
|
|
20
|
Rybinsk Reservoir
|
‒0. 6
|
60
|
Lake Huron
|
4.1
|
100
|
Lake Rukwa
|
‒9.2
|
|
21
|
Lake Peipus
|
2.5
|
61
|
Lake Erie
|
3.2
|
101
|
Lake Chad
|
2.2
|
|
22
|
Lake Il'Men'
|
1.9
|
62
|
Lake Ontario
|
0.5
|
102
|
Lake Tana
|
6.5
|
|
23
|
Lake Beloye
|
4.0
|
63
|
Big Bear Lake
|
0.9
|
103
|
Lake Maracaibo
|
1.8
|
|
24
|
Lake Zaysan
|
‒2.0
|
64
|
Great Slave Lake
|
‒0.1
|
104
|
Lago Titicaca
|
‒6.9
|
|
25
|
Caspian Sea
|
‒4.3
|
65
|
Athabasca Lake
|
‒0.3
|
105
|
Mar Chiquita
|
‒17.7
|
|
26
|
North Aral Sea
|
12.4
|
66
|
Winnipeg Lake
|
4.5
|
106
|
Lago Argentino
|
‒8.0
|
|
27
|
East Aral Sea
|
‒15.6
|
67
|
Lago de Nicaragua
|
‒3.0
|
107
|
Lago Viedma
|
‒4.2
|
|
28
|
West Aral Sea
|
‒43.0
|
68
|
Lake Nipigon
|
2.0
|
108
|
Lago Buenos Aires
|
‒3.0
|
|
29
|
Qapshaghay Bgeni
|
‒8.7
|
69
|
Selawik Lake
|
5.2
|
109
|
Sobradinho Reservoir
|
‒12.4
|
|
30
|
Lake Sasyqkolk
|
‒0. 7
|
70
|
Iliamna Lake
|
1.2
|
110
|
Lagoa Mirim
|
‒5.9
|
|
31
|
Aydar Lake
|
0. 2
|
71
|
Becharof Lake
|
3.3
|
111
|
Lago Llanquihue
|
0.7
|
|
32
|
Qinghai Lake
|
11.2
|
72
|
Dubawnt Lake
|
‒0.9
|
112
|
Ranco Lake
|
20.5
|
|
33
|
Gyaring Lake
|
‒0.8
|
73
|
Baker Lake
|
‒1.6
|
113
|
Lake Eyre
|
‒3.4
|
|
34
|
Ngoring Lake
|
11.9
|
74
|
Yathkyed Lake
|
0.1
|
114
|
Lake Gairdner
|
‒9.3
|
|
35
|
Har Lake
|
7.4
|
75
|
Wollaston Lake
|
‒0.3
|
115
|
Lake Torrens
|
‒2.9
|
|
36
|
Ulan UL Lake
|
35.0
|
76
|
Reindeer Lake
|
4.7
|
116
|
Lake Frome
|
12.5
|
|
37
|
Siling Co
|
37.7
|
77
|
Lac St.-Jean
|
0.2
|
117
|
Lake Mackay
|
8.0
|
|
38
|
Nam Co
|
5.6
|
78
|
Lake Mistassini
|
0.3
|
118
|
Lake Argyle
|
‒8.3
|
|
39
|
Gering Co
|
2.8
|
79
|
Lake Melville
|
0.7
|
|
|
|
|
40
|
Ngangtse Co
|
17.8
|
80
|
Lake Manitoba
|
4.7
|
|
|
|
Table 3 Validation of the accuracy of the water level estimation in Qinghai Lake
|
Accuracy validation
|
RMSE (m)
|
Correlation coefficient
|
Number of points for comparison
|
|
Comparison of the daily water level and lake gauge data
|
0.185
|
0.907
|
170
|
|
Comparison of the monthly average water level and lake gauge data
|
0.177
|
0.93
|
63
|
Table 4 Validation of the accuracy of the water level estimation in Poyang Lake
|
Accuracy validation
|
RMSE (m)
|
Correlation coefficient
|
Number of points for comparison
|
|
Comparison of the daily water level and lake gauge data
|
0.872
|
0.816
|
243
|
|
Comparison of the monthly average water level and lake gauge data
|
0.746
|
0.864
|
119
|
The accuracy of the average monthly water level estimated by the altimeter data was validated using the monthly average lake gauge data for the Great Lakes of North America from 2002 to 2016, which was obtained from the National Oceanic and Atmospheric Administration (NOAA) website[18]. The results are listed in Table 5, indicating that the accuracy of the water level estimation in the large lakes was high, with an RMSE of about 0.1 m.
Table 5 Validation of the accuracy of the water level estimation in the Great Lakes of North America
|
ID
|
Lake
|
RMSE (m)
|
Correlation coefficient
|
Number of points for comparison
|
|
1
|
Lake Superior
|
0.108
|
0.878
|
172
|
|
2
|
Lake Michigan
|
0.147
|
0.858
|
172
|
|
3
|
Lake Huron
|
0.090
|
0.945
|
171
|
|
4
|
Lake Erie
|
0.133
|
0.808
|
171
|
|
5
|
Lake Ontario
|
0.104
|
0.910
|
172
|
5 Discussion and Conclusion
Lake level is an important indicator of regional and global environmental changes. In this study, a dataset of lake level changes from 2002 to 2016 for 118 lakes, with an area of more than 400 km2, was developed based on GDR data from the ENVISAT/RA-2, Cryosat-2/SIRAL, and Jason-2 altimeters. The dataset included the daily water level, and the monthly and annual average water levels of the lakes. The water level estimations were accurate to the decimeter-centimeter level, and were verified by lake gauge data from Qinghai Lake, Poyang Lake, and the Great Lakes of North America. The average annual rate of water level change for each lake from 2002 to 2016 was calculated by a simple linear regression, and the lake level changes in different regions were analyzed.
The spaceborne radar altimeter, as an effective means to estimate lake levels, can solve the problem of water level monitoring in areas with an uneven distribution of gauge stations or in areas where it is difficult to establish gauge stations. For large lakes, the water level estimations using the altimeter data were accurate to the centimeter level, which has also been confirmed in previous studies[11–12]. However, for smaller lakes, the accuracy of the lake level estimation was not satisfactory. With the launch of the advanced Synthetic Aperture Radar (SAR) altimeter operated in interferometry mode, such as the Interferometric Imaging Radar Altimeter (InIRA) installed on Tiangong-2, the Cryosat-2 SARin altimeter, and the Surface Water and Ocean Topography (SWOT) mission, the accuracy of lake level estimations will increase. Cryosat-2 SARin mode data has been applied for lake level estimation in the Qinghai-Tibet Plateau, and the accuracy of lake level estimation in smaller lakes in the region has reached the centimeter level[16,19]. Therefore, future studies will pay more attention to the application of these advanced altimeters.
Author Contributions
Liao, J. J. designed the algorithms of the dataset; Shen, G. Z. and Zhao, Y. contributed to the data collection and processing, and designed the extraction algorithm of the data; Liao, J. J wrote the data paper; and Zhao, Y. performed the validation of data.
References
[1] Shi, Y. F. Glacier recession and lake shrinkage indicating the climatic warming and drying trend in Central Asia [J]. Acta Geographica Sinica, 1990, 45(1): 1-13.
[2] Adrian, R., O’Reilly, C. M., Zagarese, H., et al. Lakes as sentinels of climate change [J]. Limnology & Oceanography, 2009, 54(6): 2283-2297.
[3] Schindler, D. W. Lakes as sentinels and integrators for the effects of climate change on watersheds, airsheds, and landscapes [J]. Limnology & Oceanography, 2009, 54(6_part_2): 2349-2358.
[4] Li, J. L., Chen, X., Bao, A. M. Spatial-temporal characteristics of lake level changes in Central Asia during 2003-2009 [J]. Acta Geographica Sinica, 2011, 66(9): 1219-1229.
[5] Song, C., Ye, Q., Cheng, X. Shifts in water-level variation of Namco in the central Tibetan Plateau from ICESat and Cryosat-2 altimetry and station observations [J]. Science China, 2015, 60(14): 1287-1297.
[6] Gong, P. Remote sensing of environmental changes over China, a review [J]. Chinese Science Bulletin, 2012, 57: 2793-2801.
[7] Liao, J., Shen, G., Li, Y. Lake variations in response to climate change in the Tibetan Plateau in the past 40 years [J]. International Journal of Digital Earth, 2013, 6(6): 534-549.
[8] Frappart, F., Calmant, S., Cauhopé, M., et al. Preliminary results of Envisat RA-2-derived water levels validation over the Amazon basin [J]. Remote Sensing of Environment, 2006, 100(2): 252-264.
[9] Kleinherenbrink, M., Ditmar, P. G., Lindenbergh, R. C. Retracking Cryosat data in the SARIn mode and robust lake level extraction [J]. Remote Sensing of Environment, 2014, 152: 38-50.
[10] Wan, W., Xiao, P. F., Feng, X. Z., et al. Monitoring lake changes of Qinghai-Tibetan Plateau over the past 30 years using satellite remote sensing data [J]. Chinese Science Bulletin, 2014, 8(8): 701-714.
[11] Morris, C. S., Gill, S. K. Evaluation of the TOPEX/Poseidon altimeter system over the Great Lakes [J]. Journal of Geophysical Research Oceans, 1994, 99(C12): 24527-24539.
[12] Birkett, C. M. The contribution of TOPEX/Poseidon to the global monitoring of climatically sensitive lakes [J]. Journal of Geophysical Research Atmospheres, 1995, 100(C12): 25179-25204.
[13] Gao, L., Liao, J. J., Shen, G. Z. Monitoring lake-level changes in the Qinghai-Tibetan Plateau using radar altimeter data (2002-2012) [J]. Journal of Applied Remote Sensing, 2013, 7: 073470.
[14] Gao, L., Liao, J. J., Liu H. L., et al. Applying status and development tendency of satellite radar altimeter [J]. Remote Sensing Technology and Application, 2013, 28(6): 978-983.
[15] Liao, J. J., Gao, L., Wang, X. Numerical simulation and forecasting of water level for Qinghai Lake using multi-altimeter data between 2002 and 2012 [J]. IEEE Journal of Selected Topics in Applied Earth Observations & Remote Sensing, 2014, 7(7): 609-622.
[16] Jiang, L., Nielsen, K., Andersen, O. B., et al. Monitoring recent lake level variations on the Tibetan Plateau using Cryosat-2 SARIn mode data [J]. Journal of Hydrology, 2017, 544: 109-124.
[17] Liao, J. J., Shen, G. Z., Zhao, Y. Dataset of lake level changes in the globe using multi-altimeter data (2002-2016) [DB/OL]. Global Change Research Data Publishing & Repository, 2018. DOI: 10.3974/geodb.2018.05.12.V1.
[18] GCdataPR Editorial Office. GCdataPR data sharing policy [OL]. DOI: 10.3974/dp.policy.2014.05 (Updated 2017).
[19] NOAA. Great Lakes Environmental Research Laboratory [Z]. https://www.glerl.noaa.gov//data/dashboard/ GLWLD.html.
[20] Nielsen, K., Stenseng, L., Andersen, O. B., et al. Validation of CryoSat-2 SAR mode based lake levels [J]. Remote Sensing of Environment, 2015, 171: 162-170.