A 5 km/daily Downward Shortwave Radiation Data Product over China-ASEAN (2013)
Zhang, H. L. Xin, X. Z.* Yu, S. S. Li L. Zhong, B. Liu, Q. H.*
State Key Laboratory of Remote Sensing Science, Institute of Remote Sensing and Digital Earth, Chinese Academy of Sciences, Beijing 100101, China
Abstract: Downward shortwave radiation is a major component of the surface energy balance and governs the exchange processes of energy between the land surface and the atmosphere. The economic connectivity of China-ASEAN has been promoted under the Belt and Road initiative. The local biodiversity and eco-environment should be protected with the development. The 5 km/daily Downward Shortwave Radiation Data Product of China-ASEAN (2013) is 5 km spatial resolution and daily from Jan 1st to Dec 31th of 2013 in temporal resolution. The scale factor of the product is 0.1 and the unit is W/m2. The data was archived in .hdf data format. The 5 km/daily Downward Shortwave Radiation Data Product of China-ASEAN (2013) was developed based on the hourly geostationary satellite MTSAT2 and polar-orbit satellite MODIS. The methods for developing the dataset are generated as follows: cloud detection; look-up tables (LUT) for DSR under clear sky and cloudy sky were generated separately based on the atmospheric radiative transfer model; daily DSR data validation by 96 national Meteorological stations of China. The data validation correlation coefficient between estimated daily DSR and the observations is 0.93, with bias error of 10.13 W/m2 (5.86%) and RMSE of 35.83 W/m2 (20.72%). The correlation coefficient between estimated daily DSR and the observations is 0.91 in Tibetan Plateau, with bias error of 3.20 W/m2 (1.53%) and RMSE of 36.56 W/m2 (17.50%).
Keywords: China; ASEAN; downward shortwave radiation; 5 km
1 Introduction
The 5 km/daily downward shortwave radiation data product of China-ASEAN (2013)[1] is the scientific outcome of China-ASEAN regional remote sensing monitoring studies. It is also part of the data resource for spatial and temporal distribution analysis of regional environmental monitoring in China-ASEAN. The basic datasets for this study is from geostationary satellite MTSAT-2 and polar orbiting satellite MODIS images. Using radiative transfer model, a look-up table (LUT) was generated first and DSR products for clear and cloudy sky was derived separately.
2 Metadata of Dataset
The descriptions of the China-ASEAN DSR dataset (MuSyQ-DSR-5km-2013)[1] are recorded. These information include the dataset full name, dataset short name, corresponding author, authors, geographical region of the dataset content, year of the dataset, dataset spatial and temporal resolution, dataset format and size, data publisher, data sharing platform and contact information, technical editors, foundation and the data sharing policy. Table 1 below summarizes the main metadata elements of the China-ASEAN DSR dataset.
Table 1 Summary of the MuSyQ-DSR-5km-2013 metadata
|
Items
|
Description
|
|
Dataset full name
|
Dataset of downward shortwave radiation (5km and daily) in China-ASEAN (2013)
|
|
Dataset short name
|
MuSyQ-DSR-5km-2013
|
|
Authors
|
Zhang, H. L. L-6168-2016, zhanghl@radi.ac.cn
Xin, X. Z. S-3681-2016, xin_xzh@163.com
Yu, S. S. S-4050-2016, yushan0427@163.com
Li, L. S-4533-2016, lili3982@163.com
Zhong, B. L-4528-2016, zhongbo@radi.ac.cn
Liu, Q. H. S-1647-2016, liuqh@radi.ac.cn
|
Institute of Remote Sensing and Digital Earth, Chinese Academy of Sciences
|
|
Geographical region
|
The geographical region covers the area: 10°55′12″S–53°32′24″N, 73°37′12″E–141°0′36″E.
The region covers the area of the following 11 nations: China, Indonesia, Malaysia, Philippines, Singapore, Thailand, Brunei, Vietnam, Laos, Myanmar and Cambodia
|
|
Year dataset created
|
2013
|
Temporal resolution
|
Daily
|
|
Spatial resolution
|
5 km
|
Number of tiles
|
355
|
|
Data format
|
.tif
|
Data size
|
1.15 GB (386 MB in compress)
|
|
Dataset and data files
|
MuSyQ_DSR_5km_2013.rar
|
|
Foundation(s)
|
Ministry of Science and Technology of P. R. China (2012AA12A304, 2012AA12A305, 2013AA12A 301)
|
|
Data publisher
|
Global Change Research Data Publishing and Repository, http://www.geodoi.ac.cn.
|
|
Address
|
No. 11A, Datun Road, Chaoyang District, Beijing 100101, China
|
|
Data sharing policy
|
Data from the Global Change Research Data Publishing & Repository includes metadata, datasets (data products), and publications (in this case, in the Journal of Global Change Data & Discovery). Data sharing policy includes: (1) Data are openly available and can be free downloaded via the Internet; (2) End users are encouraged to use Data subject to citation; (3) Users, who are by definition also value-added service providers, are welcome to redistribute Data subject to written permission from the GCdataPR Editorial Office and the issuance of a Data redistribution license; and (4) If Data are used to compile new datasets, the ‘ten per cent principal’ should be followed such that Data records utilized should not surpass 10% of the new dataset contents, while sources should be clearly noted in suitable places in the new dataset[2]
|
| |
|
|
|
|
|
|
3 Methodology
The general technical procedure of 5 km downward shortwave radiation is as follows: cloudy and clear sky pixels were distinguished first and Cloud Optional Thickness (COT) was retrieved for cloudy sky, while the Aerosol Optical Depth (AOD) and total precipitation water was inversed for clear sky. Based on the atmospheric radiative transfer model, a Look-Up Table (LUT) contains various atmospheric conditions and downward shortwave radiation for clear sky and cloudy sky was created respectively. The instantaneous DSR was interpolated from the LUT, and daily DSR was accumulated from the instantaneous DSR with hourly temporally resolution. The overall process of the DSR product is shown in Figure 1.
|
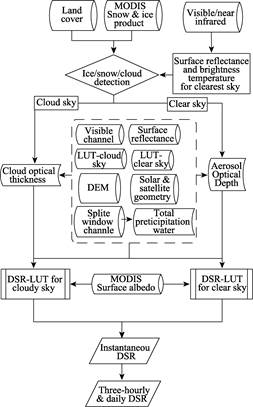
Figure 1 The generating process of 5km downward shortwave radiation
|
Cloud detection was implemented to distinguish clear sky and cloudy sky at first. This research adopts Cloud Depiction and Forecast System (CDFS) model to carry out the cloud analysis[3]. Cloud detection is made through three steps: 1) time difference; 2) dynamic threshold; 3) spectrum recognition. Each step utilizes different characteristics of cloud in terms of time, space and spectrum to analyze cloud efficiently and correctly. In clear sky, inversion of atmospheric rainfall precipitation needs to be carried out. And in cloudy sky, inversion of cloud optical thickness needs to be implemented. The inversion method is shown in literature[4].
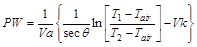
In clear sky, split-window algorithm is used to calculate the total precipitation water (TPW), which can be represented by[5]:
 (1)
(1)
where θ is the solar zenith angle, T1 is the brightness temperature in 11.0 μm, T2 is the brightness temperature in 12.0 μm, and Tair is the air temperature. The value of each coefficient in the formula is obtained according to the parameterized scheme proposed by Tanashashi[6].
Using the Look-Up Table generated from radiative transfer model and the input atmospheric parameter inversed from geostationary satellite, a rough estimate of instantaneous downward shortwave irradiance is achieved by the interpolation of LUT. Since the temporal resolution of the geostationary satellite is 1h, downward shortwave radiation every three hours and every day can be calculated by the cumulative hourly instantaneous value.
4 Dataset
The spatial resolution of downward shortwave radiation product of China-ASEAN is 5 km, and the temporal resolution is daily. The product adopts the storage format of HDF. Dataset of each day was stored as one single file of 2013. The dataset is composed of two parts— metadata information and data entity. Metadata information comprises projection type and parameter, units, scale factor, offset, range of valid value and fill value. The data entity was named “Daily_SW” and stores daily downward shortwave radiation. The size of each data file is about 9 MB. The distribution of total downward shortwave radiation in 2013 was shown in Figure 2.
5 Data Verification
|
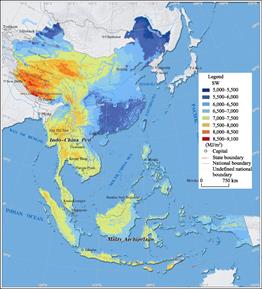
Figure 2 Distribution map of downward shortwave radiation in China-ASEAN in 2013
|
Verification of daily downward shortwave radiation in China was carried out with national meteorological observations in 2013. The correlation coefficient between daily downward shortwave radiation estimated by model and the measured value is 0.93, with overall deviation of 10.13 W/m2 (5.86%) and root mean square error (RMSE) of 35.83 W/m2 (20.72%). The verification result of Tibetan Plateau shows: the correlation coefficient between the estimated downward shortwave radiation and the measured value is 0.91, with overall deviation of 3.20 W/m2 (1.53%) and RMSE of 36.56 W/m2 (17.50%).
6 Conclusion
The data reported here are comparatively high in reliability and spatial resolution, and diverse in temporal resolution. The data can be used as the primary input data for regional ecological environment change assessments, climate models, hydrological models, and vegetation growth change analysis.
Author contributions
Zhang, H. L. and Xin, X. Z. developed the methodology of downward shortwave. Yu, S. S. provided the algorithm of cloud detection. Products validation was made by Li, L. The products was designed and produced by Zhong, B. and Liu, Q. H.
References
[1] Zhang, H. L., Xin, X. Z., Yu, S. S., et al. Dataset of downward shortwave radiation (5 km and Daily) in China-ASEAN (2013) [DB/OL]. Global Change Research Data Publishing & Repository, 2015. DOI: 10.3974/geodb.2015.02.07.V1.
[2] GCdataPR Editorial Office. GCdataPR Data Sharing Policy [OL]. DOI: 10.3974/dp.policy.2014.05 (Updated 2017).
[3] d’Entremont, R. P., Gustafson, G. B. Analysis of geostationary satellite imagery using a temporal-differencing technique [J]. Earth Interactions, 2003, 7(1): 1-25. DOI: 10.1175/1087-3562(2003) 007<0001:AOGSIU>2.0.CO;2.
[4] Li, L., Xin, X. Z., Zhang, H. L., et al. A method for estimating hourly photosynthetically active radiation (PAR) in China by combining geostationary and polar-orbiting satellite data [J]. Remote Sensing of Environment, 2015, 165: 14-26. DOI: 10.1016/j.rse.2015.03.034.
[5] Chesters, D., Robinson, W. D., Uccellini, L. W. Optimized Retrievals of Precipitable Water from the VAS “Split Window” [J]. Journal of Climate and Applied Meteorology, 1987, 26(8): 1059-1066. DOI: 10.1175/1520-0450(1987)026<1059:OROPWF>2.0.CO;2.
[6] Tanahashi, S., Kawamura, H., Matsuura, T., et al. A system to distribute satellite incident solar radiation in real-time [J]. Remote Sensing of Environment, 2001, 75(3): 412-422. DOI:10.1016/s0034-4257(00)00183-8.