East China Sea Coastline Dataset (1990–2015)
Li, J. L.1,2* Tian, P.1,2 Shao, S. Y. 1,2 Zhao, M. Q.1,2
1. Donghai Institute, Ningbo University, Ningbo 315211, China??
2. Department of Geography & Spatial Information Techniques, Ningbo University, Ningbo 315211, China
Abstract: Continental coastline in the East China Sea is located within 23°37′N–31°46′N and 117°11′E–122°08′E. Starting from Yangtze Estuary Qidongzui and extending to Port of Tielu where Fujian and Guangdong borders, the continental coastline spans 8 latitudes from south to north and stretches over Shanghai, Zhejiang and Fujian. The position of the continental coastline was determined and corrected based on Landsat TM/OLI images (spatial resolution: 30 m) by image interpretation and waveband edge detection, and consequently spatiotemporal distribution data of the continental coastline in the East China Sea during 1990–2015 (5-year intervals) were obtained. By referring to national basic coastline functional planning types and according to natural state and artificial use mode of the continental coastline, the coastline was divided into two major types: natural coastline and artificial coastline. The former was subdivided into bedrock, gravel, sludge and estuary coastlines, while the latter was subdivided into aquaculture, port, constructed and protective coastlines. Through various modeling techniques, transitional intensity and fractal dimension data of the coastline were calculated and jointly constituted a spatiotemporal change dataset of the continental coastline and its types with 5-year intervals in the East China Sea (1990–2015). Statistical results of the data set indicated that total length of the continental coastline in the East China Sea was 4,720.74 km (2015). From 1990 to 2015, the proportion occupied by the length of natural coastline in the total coastline length declined from 68.06% to 46.12% and that occupied by artificial coastline increased from 31.94% to 53.88%. There are four components of the dataset in the East China Sea during 1990–2015 as follows: (1) Spatial distribution data of the continental coastline and their types with 5-year intervals (.shp); (2) structured data of continental coastline types (.xlsx); (3) fractal dimensions of coastlines in different regions (.xlsx); and (4) coastline change intensity (.xlsx). Saved mainly in .shp and .xlsx formats, this dataset consisted of 43 data files with a data size of 3.68 MB (compressed into 1 file with 1.70 MB).
Keywords: coastline; coastline fractal dimension; coastline use intensity; the East China Sea
1 Introduction
The East China Sea is an important constituent part of China’s sea area, and its coastal zone is even a zone where human activities are the most active and intensive with the evolution of its coastline resources obviously influenced by human activities[1]. Understanding spatial distribution, spatial structure, transitional intensity and complexity of the coastline in the East China Sea can improve regional coastline resource protection, reasonable utilization of coastal landscapes and effective governance and planning of regional eco-environment. Remote sensing image data covering the East China Sea in 6 periods during 1990−2015 were collected in this study. According to continental coastline type features in the East China Sea and national basic coastline functional zoning types, the coastline classification system and corresponding interpretation keys in the East China Sea were established, followed by man-machine interactive interpretation of remote sensing images in the study area via ArcGIS and ENVI platforms and extraction of continental coastline position and type information needed in tis study. Based on coastline data in the East China Sea, models related to transitional intensity and fractal dimension of the coastline were introduced to calculate spatiotemporal distribution and fractal dimensions of the continental coastline types in the East China Sea as well as coastline transitional intensity dataset.
2 Metadata of Dataset
Name, author, geographical region, data year, temporal resolution, spatial resolution, dataset files, data publisher, and data sharing policy of “East China Sea coastline changes dataset in five-year increments (1990–2015)”[2] are shown in Table 1.
Table 1 Metadata summary of “East China Sea coastline changes dataset in five-year increments (1990–2015)”
|
Items
|
Description
|
|
Dataset full name
|
East China Sea coastline changes dataset in five-year increments (1990–2015)
|
|
Dataset short name
|
Coastline_ESC_1990-2015
|
|
Authors
|
Li, J. L. X-4440-2019, Donghai Institute, Ningbo University, Ningbo, China; Department of Geography & Spatial Information Techniques, Ningbo University, Ningbo, China, nbnj2001 @163.com
Tian, P. X-4435-2019, Donghai Institute, Ningbo University, Ningbo, China; Department of Geography & Spatial Information Techniques, Ningbo University, Ningbo, China, tppyang @163.com
Shao, S. Y. X-4674-2019, Donghai Institute, Ningbo University, Ningbo, China; Department of Geography & Spatial Information Techniques, Ningbo University, Ningbo, China, vickyssy @163.com
Zhao, M. Q. X-4671-2019, Donghai Institute, Ningbo University, Ningbo, China; Department of Geography & Spatial Information Techniques, Ningbo University, Ningbo, China,13185612309@163.com
|
|
Geographical region
|
The East China Sea
|
|
Year
|
1990, 1995, 2000, 2005, 2010, 2015
|
|
Temporal resolution
|
5 years Spatial resolution 30 m
|
|
Data format
|
.shp, .xlsx Data size 1.70 MB (after compression)
|
|
Data files
|
Temporal and spatial distribution of the continental coastline of the East China Sea: structural changes in the continental coastline of the East China Sea, changes in coastline fractal dimension, and coastline intensity
|
|
Foundations
|
NSFC-Zhejiang Joint Foundation (U1609203); National Social Science Foundation of China (16ZDA050)
|
|
Data Publisher
|
Global Change Research Data Publishing & Repository, http://www.geodoi.ac.cn
|
|
Address
|
No. 11A, Datun Road, Chaoyang District, Beijing 100101, China
|
|
Data sharing policy
|
Data from the Global Change Research Data Publishing & Repository includes metadata, datasets (data products), and publications (in this case, in the Journal of Global Change Data & Discovery). Data sharing policy includes: (1) Data are openly available and can be free downloaded via the Internet; (2) End users are encouraged to use Data subject to citation; (3) Users, who are by definition also value-added service providers, are welcome to redistribute Data subject to written permission from the GCdataPR Editorial Office and the issuance of a Data redistribution license, and; (4) If Data are used to compile new datasets, the ‘ten percent principal’ should be followed such that Data records utilized should not surpass 10% of the new dataset contents, while sources should be clearly noted in suitable places in the new dataset[3]
|
|
Communication and searchable system
|
DOI, DCI, CSCD, WDS/ISC, GEOSS, China GEOSS
|
3 Data Research and Development Method
According to coastline type features in the East China Sea and natural state and artificial use mode of the coastline types and by referring to national basic coastline functional planning types, coastlines in 6 periods during 1990–2015 were divided into natural coastline and artificial coastline, both of which were then subdivided into several second-level types (Table 2). Per an international angle, average high-water line is generally used to indicate coastlines, so according to research needs and actual situation of the study area and based on an analysis of different reflective spectral features of surface features nearby the coastline, single-band (the 5th waveband) edge detection of the processed remote sensing images in different periods was carried out so that a sea-land boundary line was obvious. Man-machine interactive interpretation was implemented on this basis, and the position of the coastline and its types were corrected by referring to an average high-water line method[4].
Table 2 Continental coastline classification system of the East China
|
Coastline type
|
Extraction explanation
|
|
Natural coastline
|
Bedrock coastline
|
Bedrock coastal zone is generally of large slope. Sea-land boundary line which can be obviously identified in the remote sensing image is determined as coastline
|
|
Gravel coastline
|
Located on the sandy coast, it is generally flat and straight, white and bright stripe is presented on the standard false color combinational image with clear and uniform texture
|
|
Sludge coastline
|
Located on mud-flat coast with irregular shape, where saline-alkali tolerant plants are red or dark red after binding of standard false color wavebands
|
|
Estuary coastline
|
Boundary line of estuary and ocean, it is deep blue on the image, and both estuary coastlines can be well distinguished on the remote sensing image
|
|
Artificial coastline
|
Aquaculture coastline
|
Artificially constructed dam used for aquaculture, it presents banding-like white color in the image, in it are aquaculture ponds with regular shape, internal dykes are also white with rough texture, and position of aquaculture coastline is determined at the external boundary of causeways of aquaculture ponds
|
|
Port coastline
|
Formed by dock basin and shipping port with obvious bright white strips, so coastline is determined as the line connecting it with the land
|
|
Constructed coastline
|
Coastline formed by buildings in urban and rural residential areas and industrial buildings, presenting irregular bright white color in the remote sensing image, it is usually encircled by artificial causeway, it has obvious boundary line with seawater, and outer edge of the dam is defined as the coastline position
|
|
Protective coastline
|
Other shore protection works (non-aquaculture areas) separating land and sea, they are bright white and banding-shaped surface features in the remote sensing data, most of them are constructed using concrete, and outside them are generally dark-colored sludge beach, so the outer edge of the seawall is defined as the coastline position
|
3.1 Algorithm Principle
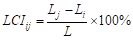
Coastline transitional intensity, which is the percentage of annual change of coastline length in the area, can objectively describe spatial and temporal change features of coastline length in the study area[5], and the specific calculation formula is as below:
 (1)
(1)
where LCIij is coastline transitional intensity from year i to year j in the area (%); Li and Lj are coastline lengths in year i and year j, respectively (km). Positive and negative LCIij values represent coastline shortening and increasing, and absolute LCIij value can express coastline transitional intensity.
The change of coastline fractal dimension can reflect the change of coastline curvature and complexity, both of which will increase with coastline fractal dimension[6]. Fractal dimensions of the continental coastline in the East China Sea in different periods were calculated based on the grid method via Matlab in this study. By reference to the existing research results[7], ArcGIS was firstly utilized to generate square grids which could cover the overall coastline in the East China Sea and calculate the needed grid number N(ε), which will vary from length ε of square grids, and according to the fractal theory:
 (2)
(2)
After logarithms are simultaneously taken from both sides of equation (2), linear fitting is performed to obtain:
 (3)
(3)
where A is a constant; D is coastline fractal dimension which ranges from 1 to 2.
In accordance with stipulations formulated by State Bureau of Quality Technical Supervision, in the digitalization process of a topographic map with basic scale, resolution is generally 0.3–0.5 mm map unit. By reference to the conversion formula and measuring scale of the East China Sea map, this value is converted into on-site distance which can serve as grid length ε[6] measuring coastline length, and the conversion formula is:
 (4)
(4)
where Q is scale denominator. Values with grid side lengths of 1,000 m and 2,500 m and without corresponding common measuring scale are added to Table 3 so that intervals of grid side length are uniform, and then grid side length sequence of coastline fractal dimensions in the East China Sea is constructed.
Table 3 Grid side length sequence
|
Grid length ε (m)
|
Corresponding scale denominator Q
|
Grid length ε (m)
|
Corresponding scale denominator Q
|
|
600
|
2,000,000
|
1,800
|
6,000,000
|
|
900
|
3,000,000
|
2,500
|
–
|
|
1,000
|
–
|
3,000
|
10,000,000
|
|
1,100
|
3,500,000
|
4,500
|
15,000,000
|
|
1,200
|
4,000,000
|
6,000
|
20,000,000
|
|
1,500
|
5,000,000
|
7,500
|
25,000,000
|
3.2 Technical Route
As shown in Figure 1, Landsat remote sensing image data in the East China Sea during 1990–2015 were collected, and the original remote sensing images were preprocessed, including geometric correction, waveband synthesis, image mosaicking and clipping of the study area. After then, a coastline classification system of the study area and interpretation signs of different coastlines were established so as to extract spatial distribution of continental coastlines in the East China Sea; on this basis, coastline fractal analysis and grid method were utilized to calculate fractal dimensions of coastlines in the East China Sea, and then complexity of coastline face profile was quantitatively expressed; coastline transitional intensity model was introduced to evaluate basic development and utilization features of continental coastlines in the East China Sea.
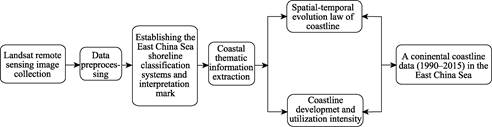
Figure 1 Data development technical route
4 Data Results and Verification
4.1 Dataset Composition
This data set mainly included a vector file (.shp format) of spatial distribution map of continental coastlines in the East China Sea and a form file (.xlsx) of structural change, transitional intensity and fractal dimension calculated using related models, in which vector data included spatial distribution maps of continental coastlines in the East China Sea in 1990, 1995, 2000, 2005, 2010 and 2015, and spatial distribution maps in 6 periods were generated by ArcGIS10.5; .xlsx file mainly presented results calculated using vector data, and the corresponding constitution diagram was made in Excel. The dataset size was 1.70 MB after compression.
4.2 Data Results
Data were interpreted based on remote sensing images of the coastlines in 6 periods during 1990–2015, and coastal type distributions in the East China Sea in different periods were obtained (Figure 2). Meanwhile, length percentages of different coastline types in different periods were calculated within the scope of coastal zone in the East China Sea, and an area graph was drawn (Figure 3) to analyze coastline type structure. On the whole, up to 2015, the length proportion of natural coastline in total coastline length in the East China Sea continued to drop from 68.06% in 1990 to 46.12% by nearly 14.18%, while the proportion of artificial coastline already reached 53.88%.
Coastline transitional intensities (Figure 4) in the East China Sea in 6 periods were calculated according to equation (1). During the 25 years, overall transitional intensity of coastlines in the East China Sea was -0.38%. On the whole, transitional intensities of the coastlines in different phases presented fluctuating trends, where transitional intensity during 2005–2010 reached the maximum of 0.96%, and coastline was lengthened transiently during 1995–2000 with transitional intensity of 0.14%, so 1995–2000 was a phase with the slowest coastline change.
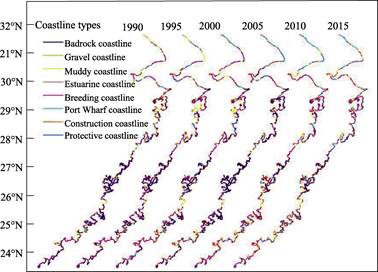
Figure 2 Temporal and spatial distribution of the continental coastline from 1990 to 2015 in the
East China Sea
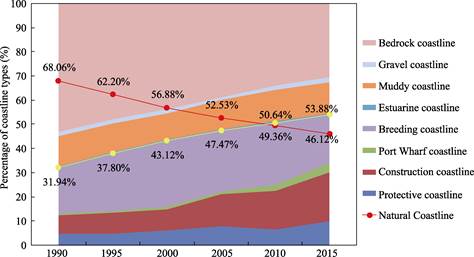
Figure 3 Structural changes in the continental coastline of the East China Sea
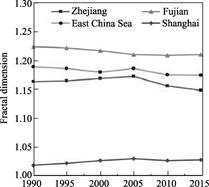
The continental coastline is long in the East China Sea with significant spatial differences in coastline forms. Therefore, coastal fractal dimensions (Figure 5) in the selected city and provinces were calculated to reflect coastline curvature and complexity changes in each region. The results showed that average fractal dimension of coastlines in the East China Sea presented a declining trend in a fluctuating way with the form developing towards flat, straight and regular direction. Fractal dimension of continental coastline in Fujian Province was higher than average overall value in the East China Sea, while the situation was the contrary for Shanghai city and Zhejiang province.
|

|
|
|
Figure 4 The intensity of coastline changes in various provinces and cities in the East China Sea
from 1990 to 2015
|
Figure 5 Spatio-temporal variation of fractal dimension of shoreline in each region
|
5 Conclusion
As an important oceanic area in the middle of China, the East China Sea is of enormous marine economic development potential, thus it is more necessary to understand spatiotemporal distribution and transition of the coastal zone. The established continental coastline dataset in the East China Sea will be of critical significance for studying continental coastline change in the East China Sea, understanding coastline development and use intensity, analyzing regional landscape layout change and protecting regional eco-environment, and it is also especially an indispensable basic geographic database[8–10].
References
[1] Zhang, J. Y., Su, F. Z., Zuo, X. L., et al. Research on the spatial differentiation of coastal land development surrounding South China Sea [J]. Acta Geographica Sinica, 2015, 70(2): 319–332.
[2] Li, J. L., Tian, P., Shao, S. Y., et al. East China Sea coastline changes dataset in five-year increments (1990–2015) [DB/OL]. Global Change Research Data Publishing & Repository, 2019. DOI: 10.3974/geodb.
2019.04.14.V1.
[3] GCdataPR Editorial Office. GCdataPR data sharing policy [OL]. DOI: 10.3974/dp.policy.2014.05 (Updated 2017).
[4] Gao, Z. Q., Liu, X. Y., Ning, J. C., et al. Analysis on changes in coastline and reclamation area and its causes based on 30-year satellite data in China [J]. Transactions of the Chinese Society of Agricultural Engineering (Transactions of the CSAE), 2014, 30(12): 140–147.
[5] Shi, Y. Y., Lv, X., Huang, X. J., et al. Arable land use transitions and its response of ecosystem services value change in Jiangsu coastal areas [J]. Journal of Natural Resources, 2017, 32(6): 961–976.
[6] Hou, X. Y., Wu, T., Hou, W., et al. Characteristics of coastline changes in mainland China since the early 1940s [J]. Scientia Sinica (Terrae), 2016, 46(8): 1065–1075.
[7] Ma, J. H., Liu, D. X., Chen, Y. Q., et al. Random prefractal dimension and length uncertainty of the continental coastline of China [J]. Geographical Research, 2015, 34(2): 319–327.
[8] Li, J. L., Ye, M. Y., Pu, R. L, et al. Spatiotemporal change patterns of coastlines in Zhejiang province, China, over the last twenty-five years [J]. Sustainability, 2018, 10(2): 477.
[9] Liu, C., Shi, R. X., Zhang, Y. H., et al. Global multiple scale shorelines dataset based on Google Earth images (2015) [DB/OL]. Global Change Research Data Publishing & Repository, 2019. DOI: 10.3974 /geodb.2019.04.13.V1.
[10] Liu, C., Shi, R. X., Zhang, Y. H., et al. 2015: How many islands (isles, rocks), how large land areas, and how long of shorelines in the world? —Vector data based on Google Earth images [J]. Journal of Global Change Data & Discovery, 2019, 3(2): 124–148. DOI: 10.3974/geodp.2019.02.03.