Element Concentration and Statistical Feature Dataset of Surface Sediments in Prydz Bay,Antarctica
Lan, M. S.1 Zhang, H. S.2* Pan, J. M.2 Yu, P. S.2 Han, Z. B.2 Hu, C. Y.2 He, J. F.1
1. Key Laboratory for Polar Science (SOA), Polar Research Institute of China, Shanghai 200136, China;
2. Lab of Marine Ecosystem and Biogeochemistry, Second Institute of Oceanography, SOA, Hangzhou 310012, China
Abstract:The Element concentration and statistical feature dataset of surface sediments in Prydz Bay, Antarctica consisted of concentrations of 13 elements, i.e., C (OC), N (TN), S, Al, Ba, Mn, Fe, K, Ti, Rb, Zr, Ca and Sr. measured in 21 surface sediment samples collected between CHINARE18 and CHINARE 27 ( 2001-2011) from Prydz Bay, Antarctica. The maximum, minimum, mean and standard deviations were calculated respectively, and their variation coefficients were analyzed subsequently. Statistical results showed that elements were classified in two clusters: one comprised OC, TN, and S, and another included the rest of elements. This paper introduced the data measurement method, data processing procedures, and statistical results, which is the new data input for environmental studies and source analysis of sediment in Prydz Bay. The data was archived in Excel format with the compressed data size of 31 KB.
Keywords: Prydz Bay; Antarctica; Sediment; Element concentration; Statistical feature
1 Introduction
Marine sediment, as a repository of circulating substances in the ocean, preserves the most complete historical records of marine environments and plays an important role in the marine biogeochemical cycle. Elemental concentration and ratio within the sediments are effective indicators for environment and source of sediment[1–6]; organic materials are directly associated with biological productivity, and OC/TN ratio (ratio of organic carbon and total nitrogen) was usually used to indicate the source of organic matters within the sediments[7].
Element concentration and statistical dataset of surface sediments in Prydz Bay, Antarctica (EleConStatistic_Antarctic)[8], was produced through the analysis of 21 surface sediments collected between the 18th-27th Chinese National Antarctic Research Expedition (CHINARE, 2001-2011). It contained the concentration data of 13 elements within the sediments, including C (OC), N (TN), aluminum (Al), barium (Ba), sulfur (S), potassium (K), Calcium (Ca), titanium (Ti), manganese (Mn), ferrum (Fe), rubidium (Rb), strontium (Sr) and zirconium (Zr), and their statistical results. A paper based on this dataset has been published [9], this data paper presents more background information for broader data sharing.
2 Metadata of Dataset
The metadata of the “EleConStatistic_Antarctic” dataset were summarized in Table 1, which include the dataset full name, short name, corresponding author, authors, geographical regions, year of the dataset, etc.
Table 1 Summary of the element concentration and statistical feature dataset of surface sediments in Prydz Bay, Antarctica metadata
|
Items
|
Description
|
|
Dataset full name
|
The statistical characteristics of element content in surface sediments of Prydz Bay,
Antarctica
|
|
Dataset short name
|
EleConStatistic_Antarctic
|
|
Authors
|
Lan, M. S. J-6914-2017, Polar Research Institute of China, lanmusheng@pric.org.cn
Zhang, H. S. Second Institute of Oceanography (SOA), zhangsoa112355@163.com
Pan, J. M. Second Institute of Oceanography (SOA), jmpan@sio.org,cn
Yu, P. S. Second Institute of Oceanography (SOA), yuppe@163.com
Han, Z. B. Second Institute of Oceanography (SOA), hanzbing@gmail.com
Hu, C. Y. Second Institute of Oceanography (SOA), hcysio@163.com
He, J. F. Polar Research Institute of China, hejianfeng@pric.org.cn
|
|
Geographical region
|
66.5°S-69.5°S, 70°E-78°E Time 2013
|
|
Spatial resolution
|
Mainly Prydz Bay, Antarctica
|
|
|
|
Data format
|
.xlsx
|
Data Size
|
31 KB
|
|
Dataset and data files
|
The dataset consists of one file. It is EleConStatistic_Antarctic.xlsx. Data size is 31 KB
|
|
Foundation(s)
|
National Natural Science Foundation of China (41376193, 41006118, 41076134); State
Oceanic Administration of P. R. China (CHINARE2014-04-01, CHINARE2014-01-04,
CHINARE2014-04-04)
|
|
Data Publisher
|
Global Change Research Data Publishing and Repository, http://www.geodoi.ac.cn/
Address: No.11A, Datun Road, Chaoyang District, Beijing 100101, China
|
|
Data sharing policy
|
Data from the Global Change Research Data Publishing & Repository includes metadata, datasets (data products), and publications (in this case, in the Journal of Global Change Data & Discovery). Data sharing policy includes: (1) Data are openly available and can be free down-loaded via the Internet; (2) End users are encouraged to use Data subject to citation; (3) Users, who are by definition also value-added service providers, are welcome to redistribute Data subject to written permission from the GCdataPR Editorial Office and the issuance of a Data redistribution license; and (4) If Data are used to compile new datasets, the ‘ten percent principal’ should be followed such that Data records utilized should not surpass 10% of the new dataset contents, while sources should be clearly noted in suitable places in the new dataset [10]
|
3 Methods
3.1 Study Area
The “EleConStatistic_Antarctic” dataset is associated with the areas of 65.5°S-69.5°S and 70°E-78°E (Figure 1), which includes the shelf area, center area and slope area of Prydz Bay and seas nearby, eastern Antarctica. The water depths range from 100 m to 3,000 m.
3.2 Sample Collection
|
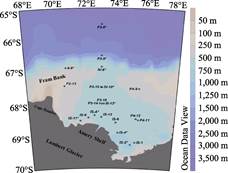
Figure 1 Sampling locations in Prydz Bay[9]
|
Twenty one sediment samples were collected from CHINARE (18th-27th). The top 1 cm of the sediment samples were collected for further analysis.
3.3 Sample Analysis
We measured the concentration of OC and TN by Elementar Vario MICRO cube (Elementar Co., Ltd, German). After pretreatment, a ICP-AES (Inductively Coupled Plasma—Atomic Emission Spectrometer) was used to analyze the concentration of Al and Ba. With powder samples being pressed into piece and encircled with boric acid, a method for XRFA (X Ray Flourescence Analysis) was established on the basis of matrix and standard curve corrections, and was used to measure the concentrations of S, K, Ca, Ti, Mn, Fe, Rb, Sr and Zr. All instruments for element analysis had been certified by metrology[9–11].
3.4 Data Statistical Analysis
Correlation analysis and cluster analysis were carried out on the measurement results of element concentrations by SPSS 17.0. The cluster analysis was based on Ward method, and Pearson correlation was used as interval metric.
4 Data Product and Validation
4.1 Data Product
The concentrations of multi-elements in surface sediments in Prydz Bay are listed in Table 2. The results showed that the variation of concentrations of multi-elements in surface sediments was complex in gradient or variation (Figure 2). Two kinds of typical patterns in
element distribution were observed in Prydz Bay[9]. The concentrations of OC, TN and S were higher at southeastern and center area than those at forefront of ice shelf and continental shelf. On the contrary, the concentrations of other elements were much higher at forefront of ice shelf and continental shelf area.
The results of cluster analysis showed that elements were devised into two groups: One group consisted of OC, TN and S, and another consisted of the rest elements (Figure 3). Correspondingly, correlation analysis indicated that elements in the same cluster mainly had positive relationship. The distribution of two groups indicated the difference source of the elements.
4.2 Data Validation
The concentration of OC and TN were measured by Elementar Vario MICRO cube. The analysis error were verified <1% against GB7314 (China’s National Standard Sample). The concentration of Al and Ba were measured by ICP-AES. The analysis error were verified to
Table 2 Concentrations of multi-elements in surface sediments
|
Station
|
OC
(10‒2)
|
TN
(10‒2)
|
S
(10‒6)
|
K
(10‒6)
|
Ca
(10‒6)
|
Ti
(10‒6)
|
Mn
(10‒6)
|
Fe
(10‒6)
|
Rb
(10‒6)
|
Sr
(10‒6)
|
Zr
(10‒6)
|
Ba
(10‒6)
|
Al
(10‒2)
|
|
IV-8*
|
0.19
|
0.04
|
2,340
|
16,513
|
14,309
|
3,048
|
455
|
23,975
|
78
|
246
|
281
|
671
|
5.79
|
|
IV-10*
|
1.05
|
0.16
|
2,899
|
10,627
|
6,971
|
2,195
|
509
|
28,173
|
90
|
124
|
72
|
713
|
3.12
|
|
II-9*
|
0.23
|
0.04
|
2,283
|
16,199
|
44,333
|
2,874
|
568
|
25,524
|
88
|
316
|
171
|
561
|
4.03
|
|
III-13*
|
0.99
|
0.17
|
2,632
|
10,236
|
6,919
|
2,005
|
346
|
25,452
|
82
|
117
|
85
|
640
|
3.05
|
|
IS-4*
|
0.53
|
0.08
|
1,065
|
15,147
|
39,083
|
1,951
|
358
|
21,612
|
83
|
299
|
178
|
675
|
4.88
|
|
IS-2*
|
0.97
|
0.17
|
4,052
|
9,105
|
8,124
|
2,033
|
238
|
24,438
|
81
|
155
|
109
|
551
|
3.24
|
|
IS-9
|
0.19
|
0.04
|
984
|
23,070
|
9,067
|
5,111
|
539
|
25,142
|
112
|
162
|
452
|
913
|
4.36
|
|
P3-14
|
0.75
|
0.13
|
3,125
|
10,943
|
7,671
|
1,985
|
339
|
30,002
|
81
|
135
|
104
|
|
|
|
P4-12
|
1.02
|
0.17
|
3,443
|
9,800
|
8,029
|
2,126
|
232
|
21,657
|
79
|
144
|
144
|
603
|
3.18
|
|
IS-11*
|
0.19
|
0.03
|
2,353
|
19,142
|
65,616
|
4,008
|
456
|
23,328
|
95
|
249
|
419
|
|
|
|
IS-A*
|
0.79
|
0.13
|
2,583
|
10,065
|
7,917
|
2,125
|
253
|
22,587
|
86
|
143
|
138
|
597
|
3.55
|
|
P2-13
|
0.14
|
0.02
|
1,512
|
21,896
|
10,495
|
4,685
|
1,050
|
56,469
|
132
|
169
|
144
|
375
|
3.43
|
|
P3-6*
|
0.30
|
0.07
|
1,670
|
22,863
|
10,307
|
4,751
|
1,059
|
56,902
|
133
|
170
|
140
|
1,945
|
6.28
|
|
P3-9*
|
0.31
|
0.07
|
1,693
|
22,821
|
10,583
|
4,822
|
1,094
|
56,910
|
132
|
169
|
147
|
879
|
5.74
|
|
IS-1
|
1.17
|
0.20
|
2,934
|
3,324
|
5,274
|
1,228
|
114
|
13,921
|
67
|
131
|
83
|
355
|
2.34
|
|
IS-6
|
1.14
|
0.20
|
4,011
|
8,333
|
6,392
|
1,635
|
169
|
19,431
|
82
|
124
|
72
|
513
|
2.65
|
|
IS-12
|
0.59
|
0.11
|
2,340
|
16,513
|
14,309
|
3,048
|
455
|
23,975
|
89
|
157
|
148
|
630
|
4.25
|
|
P3-15
|
0.85
|
0.16
|
2,899
|
10,627
|
6,971
|
2,195
|
509
|
28,173
|
87
|
117
|
70
|
654
|
2.87
|
|
P3-16
|
0.82
|
0.15
|
2,283
|
16,199
|
44,333
|
2,874
|
568
|
25,524
|
84
|
124
|
81
|
|
|
|
P4-9
|
0.38
|
0.07
|
2,632
|
10,236
|
6,919
|
2,005
|
346
|
25,452
|
102
|
181
|
187
|
874
|
4.66
|
|
P4-11
|
1.08
|
0.19
|
1,065
|
15,147
|
39,083
|
1,951
|
358
|
21,612
|
75
|
143
|
145
|
550
|
2.94
|
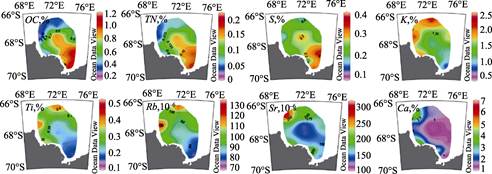
Figure 2 Distributions of element concentrations of surface sediments[9]
be <5% against GB7314 and GB7315. Parallel samples were analyzed and the values of RSD (Relative Standard Deviation) were controlled as less than 5% and 2.5%, respectively. Mn, Fe, K, Ti, Rb, Zr, Ca and Sr were measured by XRFA with a repetitive measurement and corrected by calibration curves. Firstly, we established calibration curves by National Standard Substance GBW07301-GBW07305, and GBW07307-GBW07312, and verified them using GBW07314. Then, a repetitive measurement was used 12 times to reduce the possible systemic error. After that, removing the maximum and minimum value and using Q-statistics (Q=0.9) to test the rest results. Finally, we calculated the concentrations of elements using arithmetic mean value of tested results by established calibration curves. The RSD of measured results showed <5% except for S and Zr (5.05% and 5.23%, respectively).
|

Figure 3 Results of cluster analysis by SPSS[9]
|
5 Discussion and Conclusion
“EleConStatistic_Antarctic” dataset was based on 21 surface sediments samples collected during CHINARE18-E27 (2001-2011). It consisted of both concentration data and statistic data, obtained through chemical and statistical analysis, respectively.
Author Contributions
He, J. F. designed the study. Lan, M. S., Zhang, H. S. and Pan, J. M. wrote the paper. Yu, P. S., Han, Z. B. and Hu, C. Y. contributed to the data processing and analysis.
Acknowledgements
The cruise members of CHINARE18-CHINARE27 are appreciated for helping to collect the samples. We sincerely thank the great aids from Lab of Marine Ecosystem and Biogeochemistry.
References
[1] Zhao, H. G., Liu, C. Y. Approaches and prospects of provenance analysis [J]. Acta Sedimentologica Sinica, 2003, 21(9): 409-415.
[2] Bhatia, M, R., Taylor, S. R. Trace-element geochemistry and sedimentary provinces: a study from the Tasman Geosyncline [J]. Chemical Geology, 1981, 33(1/2):115-125.
[3] Roser, B. P., Korsch, R. J. Provenance signatures of sandstone-mudstone suites determined using discriminant function analysis of major element data [J]. Chemical Geology, 1988, 67, 119-139.
[4] Jia, B. W., Zhou, A. C., Gu, D. Q. Geochemistry and provenance analysis of late Paleozoic volcanic event deposits in the west Liaoning [J]. Acta Sedimentologica Sinica, 1999, 17(3): 473-479.
[5] Du, D. X., Luo, J. N., Chen, M., et al. Tectonic settings of the provenances for the Triassic Bayan Har Basin deduced from petrogeo-chemical characteristics: examples from the Aba-Zoige, Xiaojin-Barkam and Yajiang Basins in western Sichuan [J]. Sedimentary Facies And Palaeogeography, 1999, 19(2): 1-19.
[6] Chen, Y. J., Yang, Z. F., Zhao, T. P. The method and current research of source analysis and crustal components using trace elements [J]. Geology-Geochemistry, 1996, 15(3):7-11.
[7] Stevenson, F. J., Cheng, C. N. Organic geochemistry of the Argentine Basin sediments: carbon-nitrogen relationships and Quaternary correlations [J]. Geochimica et Cosmochimica Acta, 1972, 7:143-162.
[8] Lan, M. S., Yu, P. S., Han, Z. B., et al. The statistical characteristics of element content in surface sediments of Prydz Bay, Antarctica [DB/OL]. Global Change Research Data Publishing & Repository, 2015. DOI: 10.3974/geodb.2015.01.04.V1.
[9] Lan, M. S., Yu, P. S., Han, Z. B., et al. Statistic evaluation of the elemental composition and source analysis of surface sediments in Prydz Bay, Antarctica [J]. Chinese Journal of Polar Research, 2015, 27(1): 9-16.
[10] GCdataPR Editorial Office. GCdataPR Data Sharing Policy [OL]. DOI: 10.3974/dp.policy.2014.05 (Updated 2017).
[11] Ji, A. Zhuo, S. J., Li, G. H. Energy Dispersive X-ray Fluorescence Spectrometry [M]. Beijing: Science Press, 2011, 210-320.