1 km/5 day NDVI Data Product over China-ASEAN (2013)
Li, J. Zeng, Y. L. Liu, Q. H.* Zhong, B. Wu, S. L. Peng, J. J.
State Key Laboratory of Remote Sensing Science, Institute of Remote Sensing and Digital Earth, Chinese Academy of Sciences, Beijing 100101, China
Abstract: A synergized algorithm is developed to generate 1 km/5 day Normalized Difference Vegetation Index (NDVI) product using multi-source remote sensing dataset over China and the Association of Southeast Asian Nations (ASEAN) for 2013 (MuSyQ-NDVI-1km-2013). The multi-source dataset include five satellite data at 1 km spatial resolution including Terra/MODIS, Aqua/MODIS, NOAA18/AVHRR, FY3A/VIRR, and FY3B/VIRR. The quality of the multi-source observation data varies with sensors and atmospheric conditions. For the effective use of the dataset, the proposed algorithm firstly classifies the multi-angular observations into three levels by the residual thresholds of 10%, 20% and “larger than 20%” in a robust NDVI-weighted kernel-driven Bidirectional Reflectance Distribution Function (BRDF) model. The observations with the residual larger than 20% are considered as cloudy and will be excluded for following NDVI compositing. Then the NDVI is composited by the main algorithm or backup algorithm according to the number of good quality observations. The composited NDVI is compared with the MODIS NDVI data product in the Heihe River basin, China. Results indicate that the number of good quality observations increase by the multi-source synergized retrieval, and the temporal resolution is increased from quasi-8-day to 5 day. The evaluation by the ASTER images at the 15 m resolution indicates that the determination coefficient (R2) is significantly higher for the multi-source NDVI, than the MODIS-only NDVI data product. The China-ASEAN NDVI data product is produced in the Sinusoidal tile grid, and is distributed in 40 adjacent non-overlapping tiles that are approximately 10°×10° (at the equator). The spatial/temporal resolution of the product is 1 km/5 days. The dataset is archived in .tif format, and is compressed in 40 .zip files with the data size of 9.89 GB.
Keywords: NDVI; China; ASEAN; BRDF; kernel driven model; quality degrading.
1 Introduction
Vegetation index (VI) is a group of linear or nonlinear combination of the satellite remote sensing signals in the visible and near-infrared bands according to the vegetation spectral reflective and absorptive properties. VI is sensitive to ground vegetation cover changes, and has a close relationship with many vegetation biophysical parameters, such as leaf area
index (LAI) and Net Primary Productivity (NPP). The Normalized Difference Vegetation Index (NDVI) is one of the most widely used VI until now. The current global scale NDVI data products are all generated from single sensor observations. Due to the restriction of poor weather conditions by clouds and high aerosols, the number of observations provided by single sensor is limited during the composite period. The longer composite period will reduce the accuracy of the composited NDVI data product and will make it more difficult to identify the vegetation change. To determine the composite period, the primary factor is to guarantee the number of good quality observations to ensure the composite accuracy. The shortest composite period is 10 days for the global scale NDVI data products using single sensor data. A possible way to decrease the composite period is to improve the number of good quality observations from the on-orbit multi-sensor.
The multi-source dataset has collected most of the available satellite data at 1-km
spatial resolution from platforms including Terra/MODIS, Aqua/MODIS, NOAA18/AVHRR, FY3A/VIRR and FY3B/VIRR. A synergized retrieval algorithm is developed to generate 1km/5days composited NDVI data product after the analyses of the multi-source dataset and the current NDVI data products and algorithms. Compared with the single sensor data, the multi-source dataset can provide more good quality observations with varying angles. The
quality of the multi-source observation data varies with sensors and weather conditions. For the effective use of the dataset, the proposed algorithm is making the multi-angular observations system into three levels. The Level 3 in the observation system considered as cloud contaminated observations, which is not used for the NDVI composite process. The
proposed VI composite algorithm mainly comes from MODIS VI, including the BRDF
angular normalization method based on the semi-empirical Walthall model, the CV-MVC method and the MVC method. The Level 1 and Level 2 in observation system are used for the NDVI composite using the proposed algorithm with data quality flags. The composited NDVI is compared with high resolution images and the MODIS NDVI data product in the Heihe River basin, China.
2 Metadata of Dataset
The metadata of 1 km/5 day NDVI data product over China-ASEAN for 2013[1] is summarized in Table 1. It includes the dataset full name, short name, authors, year of the dataset, temporal resolution, spatial resolution, data format, data size, data files, data publisher, and data sharing policy, etc.
3 Methods
3.1 Algorithm Principles
The aim of the composite algorithm is to make full use of the multi-angular good quality observations from multi sensors to improve the temporal resolution and accuracy of the NDVI data products. Due to the effects of sensor noise or poor weather conditions, large error may exist for the observations after data pre-processing. Therefore, a VI composite algorithm is developed based on the observation qualities. The NDVI is composited by the main algorithm or back-up algorithm according to the number of good quality observations.
3.1.1 Quality Grading of the Multi-source Dataset
The proposed algorithm firstly classifies the multi-angular observations from multi-sensor. Due to effects of residual clouds or high aerosols, the directional NDVI will be smaller, and thus NDVI can be used as an indicator to identify the quality of the land surface reflectance products. Because NDVI varies significantly with the solar illumination and viewing geometry, it is necessary to use the kernel driven model to normalize the directional NDVI to equivalent nadir-view NDVI before comparison. The quality degrading of the multi-source dataset includes four steps:
Table 1 Summary of 1 km/5 day NDVI data product over Chin-ASAEN for 2013 metadata
|
Items
|
Description
|
|
Dataset full name
|
1 km/5-day NDVI data product over China and the Association of Southeast Asian Nations for 2013
|
|
Dataset short name
|
MuSyQ-NDVI-1km-2013
|
|
Authors
|
Li, J. R-7298-2016, State Key Laboratory of Remote Sensing Science, Institute of Remote Sensing and Digital Earth, CAS, lijing01@radi.ac.cn
Zeng, Y. L. G-6465-2017, State Key Laboratory of Remote Sensing Science, Institute of Remote Sensing and Digital Earth, CAS, zengyl@radi.ac.cn
Liu, Q. H. S-1647-2016, State Key Laboratory of Remote Sensing Science, Institute of Remote Sensing and Digital Earth, CAS, liuqh@radi.ac.cn
Zhong, B. L-4528-2016, State Key Laboratory of Remote Sensing Science, Institute of Remote Sensing and Digital Earth, CAS, zhongbo@radi.ac.cn
Wu, S. L., S-1572-2016, State Key Laboratory of Remote Sensing Science, Institute of Remote Sensing and Digital Earth, CAS, wsl0579@163.com
Peng, J. J. S-1261-2016, 1State Key Laboratory of Remote Sensing Science, Institute of Remote Sensing and Digital Earth, CAS; 2Peking University.rspeggy@163.com
|
|
Geographic region
|
The geographical region is from 10°55′12″S to 53°32′24″N, 73°37′12″E to141°0′36″E
The region covers the area of the following 11 nations, including Brunei, Cambodia, China, Indonesia, Laos, Malaysia, Myanmar, Philippines, Singapore, Thailand, and Vietnam
|
|
Year
|
2013
|
|
Temporal resolution
|
5 days
|
|
Spatial resolution
|
1 km
|
|
Data format
|
.hdf
|
|
|
|
Data size
|
9.89 GB
|
|
|
|
Data files
|
The 1 km/ 5 day NDVI data product over China and the Association of Southeast Asian Nations for 2013 is produced in the Sinusoidal tile grid, and is distributed in 40 adjacent non-overlapping tiles that are approximately 10°×10° (at the equator). The file name is taken as MuSyQ_VI_1km_YYYYDDD000000_HXXVYY_001 * where YYYY is the year of the dataset (2013), DDD is the Julian day, HXXVYY is the Tile Grid number (e.g., H23V04)
|
|
Foundation(s)
|
Ministry of Science and Technology of P. R. China ( 2012AA12A304, 2013AA12A301)
|
|
Data publisher
|
Global Change Research Data Publishing & Repository, http://www.geodoi.ac.cn
|
|
Address
|
No. 11A, Datun Road, Chaoyang District, Beijing 100101, China
|
|
Data sharing policy
|
Data from the Global Change Research Data Publishing & Repository includes metadata, datasets (data products), and publications (in this case, in the Journal of Global Change Data & Discovery). Data sharing policy includes: (1) Data are openly available and can be free downloaded via the Internet; (2) End users are encouraged to use Data subject to citation; (3) Users, who are by definition also value-added service providers, are welcome to redistribute Data subject to written permission from the GCdataPR Editorial Office and the issuance of a Data redistribution license; and (4) If Data are used to compile new datasets, the ‘ten per cent principal’ should be followed such that Data records utilized should not surpass 10% of the new dataset contents, while sources should be clearly noted in suitable places in the new dataset[2]
|
Step 1: Set the best quality sensor, e.g., MODIS, as the reference sensor, and make a cross-sensor correction for the bands from other sensors. Project all of the reflectance data to the same coordinate system, and conduct the data screening, such as the cloud detection.
Step 2: If the number of observations that pass the initial data screening in Step 1 (N) is no less than 5, then the mean directional NDVI of all the observations minus 0.3 is set as the threshold. The observations with the directional NDVI less than the threshold are considered as cloud contaminated observations and are identified as Level 3 data. If the number of observations excluding the Level 3 data (N) is still no less than 5, then go to Step 3; if N is less than 5, then go to Step 4.
Step 3: If the good quality MODIS observations that pass Step 2 (M) is no less than 5, then use all of them to fit the kernel driven model and get the kernel coefficients; if M is less than 5, then the MODIS BRDF product is acquired to get the kernel coefficients. Use the kernel coefficients to normalize the directional NDVI to equivalent nadir-view NDVI, and set the second largest equivalent nadir-view NDVI as the benchmark. Classification of the multi-angular observations was made in three levels (L1-L3) by the relative error threshold of 10% and 20%.
Step 4: If the number of observations that pass the data screening in Step 1 or pass the outlier removal in Step 2 is less than 5 (N), then the MODIS BRDF product is acquired to get the kernel coefficients. Use the kernel coefficients to normalize the directional NDVI to equivalent nadir-view NDVI, and set the second largest equivalent nadir-view NDVI as the benchmark. Classification of the multi-angular observations is made in two levels (L2-L3) by the relative error threshold of 20%.
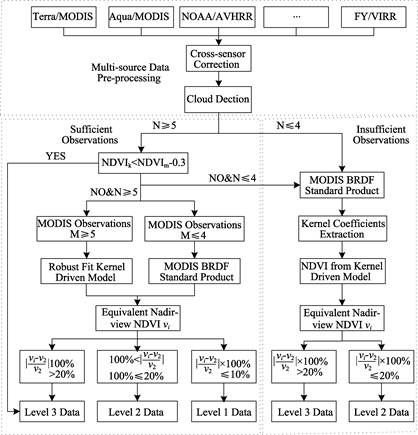
Figure 1 The flow chart of the data grading for the multi-source datasets
3.1.2 Algorithm and Method
With the development of noise removal technology, especially the BRDF correction, the VI angular normalization algorithm has improved. This method uses the BRDF model to standardize reflectances to nadir view angle at a given solar zenith angle, and then calculate the composite value[3–5]. The varying solar/view geometry is the main source of the VI directional effect, and biophysical parameters such as LAI and fPAR are mostly derived from the nadir-view VI. The angular normalization algorithm can remove the effects from sun-target-sensor geometry, which represents the main advances and future directions of the VI composite algorithm. Leeuwen, et al.[6] compared several VI composite methods, and they found that the Walthall BRDF model achieved the highest accuracy to derive the equivalent nadir-view VI. Thus when the number of L1 observations is no less than 5, or the sum of the L1 and L2 is no less than 5, the Walthall model is used to standardize reflectances to nadir view angle and to calculate the nadir-view VI[7]. The Walthall model is
 (1)
(1)
where ρλ is the reflectance??θv is the view zenith angle, and φs and φv are the solar zenith angle and solar azimuth angle, respectively. The parameters aλ, bλ and cλ can be fitted by the least square method. The VI composite equation is
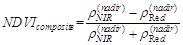 (2)
(2)
3.1.3 Back-up Algorithm
(1) Mean Compositing (MC): If the sum of L1 and L2 observations is between 2 and 4, the MC method calculates VI by the mean reflectance of each band during each composite period[8]. The MC method can reduce the differences among sensors and make the composite results more stable.
(2) VI direct calculation (VI)??If the sum of L1 and L2 observations is 1, the VI composite method calculates the VI of the only good quality observation directly. This method does not fully consider the surface non-Lambertian properties and varying view geometry, and it can be influenced by factors including residual clouds, haze and sensor noise.
(3) Maximum Value Composite (MVC): If there is no L1 or L2 observations, the MVC method is adopted to calculate the VI of all the observations, and then selects the maximum VI as the composited value. This method is firstly designed to consider the atmospheric effects, and thus the composited value is more close to the nadir view observation. The shortcoming of this method is the neglect of the surface non-Lambertian properties.
3.2 Framework of the Algorithm
The VI is composited by different algorithms according to the number of good quality observations as in Figure 2. If the qualified observations is N, and after classification of the data quality into L1-L3, N=L1+L2+L3. The detailed processes are:
(1) If L1≥5, then use the Walthall model to composite VI with the L1 data. In this condition the good quality observations are sufficient, and thus the composite accuracy is the highest. The quality assessment (QA) description is set as 0.
(2) If L1<5 and (L1+L2)≥5, then use the Walthall model to composite VI with the L1 and L2 data. In this condition, the best quality L1 observations are not sufficient enough to fit the Walthall model, and thus the L1 and L2 data are combined used. The inconsistency of the observations increase and thus the composite accuracy decreases. The QA is set as 1.
(3) If 1<(L1+L2)<5, then the Walthall model cannot be used due to the limited number of good quality observations. Thus MC method in the back-up algorithm is used to calculate the mean reflectance of each band. In this condition, the composite results can be affected by the VI angular effects, and the significance of the angular effects depends on the view angle distribution. The QA is set as 2.
(4) If L1+L2=1,then the VI composite method is used and the QA is set as 3.
(5) If L1+L2=0 and N>0, then the MVC method is used and the QA is set as 4.
(6) If N=0, which means there is no cloud-free observations, the Fill Value is set as -999.
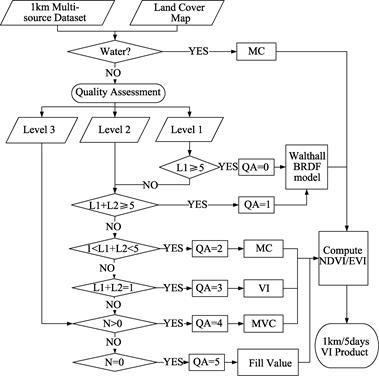
Figure 2 The framework of the VI composite process
4 Results and Validation
4.1 Data Products
The composited NDVI map over China-ASEAN is shown in Figure 3. From the visual inspection, the spatial consistency of the products is good, and the ratio of the missing data is relatively low, which can meet the needs to monitor the vegetation conditions on large scale.
4.2 Validation
4.2.1 Direct Validation
The ASTER image at 15 m resolution over the Heihe River basin, China, was reprocessed
by radiometric calibration and atmospheric correction, as shown in Figure 4. Then the ASTER image was cross-sensor corrected to the MODIS sensor, projected to the same coordinate system as the composited VI product, and aggregated to 1 km resolution as the benchmark to validate the composited VI product. The main cover types of the area were cropland and desert. A 22 km×24 km cropland area, which corresponds to 528 pixels with the resolution of 1 km, was chosen as the direct validation region.
There are 4 types of NDVI data products with the aggregated ASTER reference map at the Figure 4. These products were using MODIS+FY multi-sensor, MODIS single-sensor, FY single-sensor, and MOD13A2 product. The determination coefficient (R2) can indicates the correlation between the NDVI data products and NDVI reference map. Figure 5 suggests that compared with the products using MODIS or FY single-sensor, the products generated by multi-source dataset can improve the R2 from 0.337 or 0.107 to 0.395, which means that the NDVI data pro-duct by multi-sensor has a better relationship with the NDVI reference map. Besides, the root mean squared errors (RMSE) and Resi-dual of the products generated by multi-source data were 0.102 and 0.038, respectively, which were also smaller than that by singe-sensor data.
Overall, the NDVI data product by MODIS single-sensor data has a good relationship with the reference map, but the Residual is relatively large (0.042). The NDVI data product by FY single-sensor has a relatively small RMSE, but the Residual is large (0.044), and the R2 is low (0.107), which suggests the relationship with the reference map is not very well. The above analysis suggests that the NDVI data product by multi-source data is more accurate and stable than that generated by single-sensor data.
|
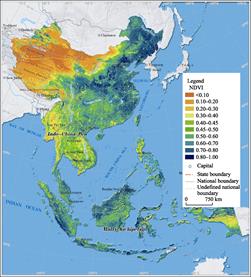
Figure 3 1 km/5 day NDVI data product over
China-ASEAN (DOY216)
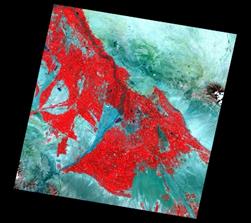
Figure 4 The false color composite map over the Heihe River basin, China (DOY192)
|
Compared with the MOD13A2 product, the NDVI data product by multi-sensor data has similar RMSE and Residual with the reference map, but the R2 is higher, which suggests that the NDVI data product by multi-source data has a better correlation with the reference map than that by single-sensor dataset. In addition, the temporal resolution for the MOD13A2 product is 16 days, while the NDVI data product by multi-sensor data is 5 days, which suggests the temporal resolution has been significantly improved.
4.2.2 Cross-validation
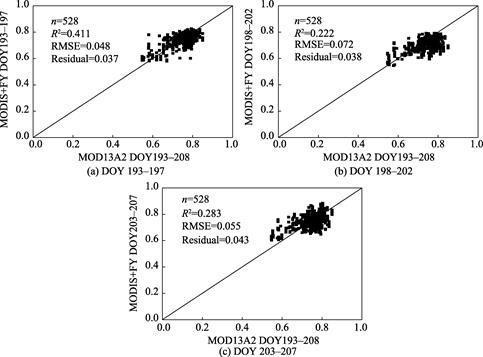
Cross-validation is an indirect validation way to compare different products at the same coordinate system and spatial resolution. The spatial-temporal consistency can be evaluated at widely distributed sites which can represent a wide range of vegetation types. (1) Comparison at the same time-phase. The same 22 km×24 km cropland area, which corresponds to 528 pixels at 1 km resolution, was chosen as the cross-validation region. The composited NDVI data product at 5 days resolution was compared with MOD13A2 product at 16 day resolution as in Figure 6.
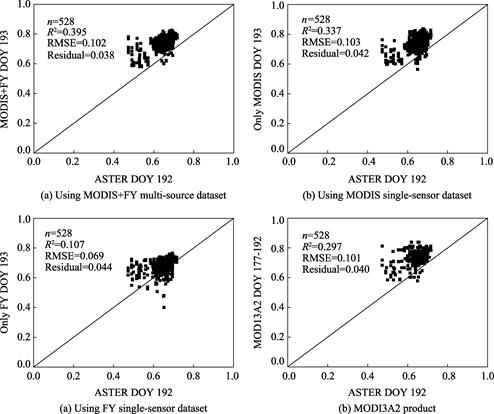
Figure 5 The comparison between the composited NDVI data products and the reference map
at the cropland site over the Heihe River basin, China (DOY192)
The time periods of the multi-source data composited NDVI data product were DOY193-197, DOY198-202 and DOY203-207. The time period of the MOD13A2 product is DOY193-208. Figure 6 suggests that compared with the MOD13A2 product, the composited NDVI data product has the RMSE of 0.048, 0.072 and 0.055, and the Residual of 0.037, 0.038 and 0.043, and the mean error is less than 0.1. The temporal resolution has been improved from 16 days for the MOD13A2 product to 5 days for the multi-source data composited NDVI data product.
(2)Time series analysis
One of the key functions for the composited NDVI data product is to monitor the vegetation dynamics. Five pixels were selected for the time series analysis at the cropland site over the Heihe River basin, China as in Figure 7. The starting time for the MOD13A2 product is DOY177, 193 and 209, respectively, while for the multi-source data composited NDVI data product is DOY183, 188, 193, 198, 203 and 208. Figure7 indicates that from DOY177 to DOY209, both the MOD13A2 and the multi-source data composited NDVI data product experienced the up-down tendency. The time series curve of the MOD13A2 product is smoother due to the composite during the 16 day period, while that of the multi-source data composited NDVI shows the detailed information with a shorter 5 day composite period.
MOD13A2 product suggests that all of the 5 sites reached the peak on DOY193, but the multi-source data composited NDVI data product with a higher temporal resolution suggests
|
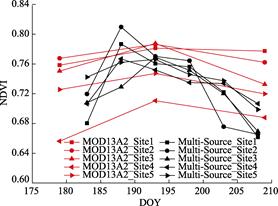
Figure 7 The time series of the multi-source data composited NDVI data product and the MOD13A2 product at the
cropland site over the Heihe River basin, China
|
Figure 6 The comparison between the multi-source data composited NDVI data product and the reference map at the cropland site over the Heihe River basin, China
that Site 3 and Site 5 reached the peak on DOY193, while Site 1, Site 2 and Site 4 had already reached the peak on DOY 188. If the MOD13A2 product at the 16 day resolution is used over this region, the exact growth peak time information can be hardly captured, which suggests that the high temporal resolution is conducive to accurately extract the vegetation growth peak information and to monitor the vegetation changes.
5 Discussion and Conclusion
With the increasing of satellites on orbit, there are multiple sensors observing the same area on the same day or even at near time phase. The multi-sensor provides multi-angular observations at different solar/viewing geometry. Compared with the single-sensor, the multi-sensor has more abundant angular and observation information, which provides the opportunity to improve the accuracy and temporal resolution of the composited VI products. In this study, a synergized retrieval algorithm is developed to generate 1 km/5 day composited Normalized Difference Vegetation Index (NDVI) product using multi-source remote sensing dataset. For the effective use of the multi-sensor dataset, the proposed algorithm firstly classification of the multi-angular observations into three levels by a robust NDVI-weighted kernel driven BRDF model. Then the NDVI is composited by the main algorithm or back-up algorithm according to the number of good quality observations.
The two potential issues in the algorithm implementation are (1) uncertainties of the input parameters, especially the reflectance data; and (2) the insufficient number of good quality observations, which will stop the data quality degrading and bring uncertainties to the composited results.
(1) Uncertainties of the input parameters
There exist uncertainties in each step of the multi-source data pre-processing, such as the cross-sensor radiometric calibration, geometric correction, atmospheric correction, and cross-sensor correction, which will lead to biases for the reflectance data, and will ultimately influence the accuracy of the VI composite result. The cloud detection result will affect the selection of the main algorithm or back-up algorithm. Especially for the BRDF fitting
approach, the residual cloud contaminated pixels will influence the reflectance values and eventually affect the VI composite result.
(2) The insufficient number of good quality observations
Although data quality check has been designed for the proposed algorithm, the quality degrading cannot be conducted when the good quality observations are insufficient. In this condition the data quality check only depends on the outlier removal with threshold of maximum directional NDVI minus 0.3. Thus all of the observations pass the outlier removal process will be used for the VI composite, which may cause bias for the composited VI due to residual cloud.
Author Contributions
Li, J., Zeng, Y. L. and Liu, Q. H. designed the algorithms of dataset. Zhong, B., Wu, S. L. and Peng, J. J. contributed to the data processing and analysis. Li, J. and Zeng, Y. L. wrote the data paper.
References
[1] Li, J., Zeng, Y. L, Liu, Q. H., et al. 1 km/5-day NDVI product over China and the Association of Southeast Asian Nations for 2013 [DB/OL]. Global Change Research Data Publishing & Repository, 2015. DOI: 10.3974/geodb.2015.01.16.V1.
[2] GCdataPR Editorial Office. GCdataPR Data Sharing Policy [OL]. DOI: 10.3974/dp.policy.2014.05 (Updated 2017).
[3] Duchenmin, B., Berthelot, B., Dedieu, G., et al. Normalization of directional effects in 10-day global syntheses derived from VEGETATION/SPOT: II. Validation of an operational method on actual data sets [J]. Remote Sensing of Environment, 2002, 81(1): 101-113.
[4] Huete, A. R., Didan, K., Miura, T., et al. Overview of the radiometric and biophysical performance of the MODIS vegetation indices [J]. Remote Sensing of Environment, 2002, 83(1/2): 195-213.
[5] Leeuwen, W. J. D. V., Huete, A. R., Laing, T. W. MODIS vegetation index compositing approach: a prototype with AVHRR data [J]. Remote Sensing of Environment, 1999, 69(99): 264-280.
[6] Leeuwen, W. J. D. V., Huete, A. R., Jia, S., et al. Comparison of vegetation index compositing scenarios: BRDF versus maximum VI approaches [C]. IEEE Geoscience and Remote Sensing Symposium, 1996, 1423-1425.
[7] Walthall, C. L., Norman, J. M., Welles, J. M., et al. Simple equation to approximate the bidirectional reflectance from vegetative canopies and bare soil surfaces [J]. Applied Optics, 1985, 24(3): 383-387.
[8] Vancutsem, C., Pekel, J. F., Bogaert, P., et al. Mean compositing, an alternative strategy for producing temporal syntheses [J]. International Journal of Remote Sensing, 2007, 28(22): 5123-5141.