Cropland Area Dataset of the Russian
Empire/
Union of Soviet Socialist
Republics during the Past
Millennium (1000–2000)
Zhao, Z. L.* Li, J. Fang, X. Q. Ye, Y.
Faculty of Geographical
Science, Beijing Normal University, Beijing 100875, China
Abstract: Reconstruction
of historical land use/cover change is the core task of land use/cover change
research at regional and global scales. In this study, we reconstructed
cropland areas of the Russian Empire/Union of Soviet Socialist Republics over
the period of 1000–2000
using historical data, including cropland area, population, grain yield, and
town. The dataset included 5 sets of spatial data and 3 sets of tabular data.
Spatial data include the boundary data of the European part of the Russian
Empire in 1000, 1533, and 1900, the boundary data of the European section of
the Union of Soviet Socialist Republics in 1958, and the boundary data of
Siberia. The tabular data include (1) sheet-1: cropland area data of the
Russian Empire/Union of Soviet Socialist Republics over the period of 1000–2000; (2)
sheet-2: cropland area data of the European part of the Russian Empire/Union of
Soviet Socialist Republics over the period of 1000–2000; and (3) sheet-3: cropland
area data of Siberia over the period of 1590–2000. The dataset is archived in
.shp and .xlsx formats and consists of 41 files with a data size of 2.18 MB
(compressed to 1 file, 1.11 MB).
Keywords: land use/cover change; cropland area; past millennium;
Eastern Europe; Union of Soviet Socialist Republics
DOI: https://doi.org/10.3974/geodp.2022.02.11
CSTR: https://cstr.escience.org.cn/CSTR:20146.14.2022.02.11
Dataset Availability Statement:
The dataset
supporting this paper was published and is accessible through the Digital Journal of
Global Change Data Repository at: https://doi.org/10.3974/geodb.2022.01.05.V1 or https://cstr.escience.org.cn/CSTR:20146.11.2022.01.05.V1.
1 Introduction
As a human-induced global environmental change,
land use and cover change (LUCC) has dramatically modified the Earth??s surface[1–3]
and significantly influenced global and regional climate change and the carbon
cycle through biogeochemical and biogeophysical mechanisms[4–7].
Therefore, LUCC has historically been the core task of international global
change research[8–11].
The origin and development of agriculture was a major event in the
Holocene[12]. Since the emergence of agricultural civilization in
the Neolithic Age, especially since the Industrial Revolution, LUCC caused by
agricultural development has affected many aspects of the global environment[13].
Cropland is one of the most representative types of land use in human
agricultural activities[13,14]. Reconstructing historical cropland
cover change could not only improve our understanding of the anthropogenic
roles of historical land cover changes and climate changes[15] but
also help us cope with the challenges of environmental problems created by land
cover conversion, promote the development of global change research and provide
a reference for promoting the sustainable development of human society[16–18].
Since the 1990s, a number of international research projects, such as the
Land Use/Cover Change Project, the BIOME300, the Global Land Programme and the
LandCover 6k, have been implemented to promote historical LUCC reconstruction.
Several representative global datasets on historical land cover have been
developed, for example, the History Database of the Global Environment (HYDE)[14],
Global Land Use Database of the Center for Sustainability and the Global
Environment (SAGE)[19], KK10 dataset[20], and PJ dataset[21].
However, it has been noted that many uncertainties of the global datasets
existed due to the defects of the original data at the regional scales by many
regional scale reconstructions, which are more likely to represent the real
historical LUCC[22–24]. At present, with abundant historical
materials, LUCC reconstruction on regional scales is often conducted around the
major agricultural regions of the world[25–27].
The history of agricultural reclamation in Russia originated in the period
of 5000 B.C.–6000 B.C.[28]. During the past millennium, Russia acted
as a vital agricultural country in the world, with a long history of exporting
grain to other countries within Europe[28]. The cropland area in
modern Russia accounted for 8.11% of the total arable land area in 2015
worldwide[14]. According to historical documents, a number of
studies have reconstructed historical cropland data on regional scales, such as
Vladimir, Yaroslavl, Nizhni Novgorod and Chernigov[29–33], and have
covered the period since the 1870s. However, a longer-term reconstruction of
cropland data and a broader spatial scale in Russia requires accelerated
research.
We have mined some historical data related to cropland use and cover, such
as population, cropland area, grain yield, and town in Russia, during the past
millennium from historical materials. Based on the experience of relevant
scholars in the reconstruction of cropland data in Russia, the cropland area
dataset of the Russian Empire/Union of Soviet Socialist Republics during the
past millennium was constructed in this study. The results of this study could
provide relevant references for reconstructions of historical LUCC.
2 Metadata of the Dataset
The metadata of the Cropland area dataset of Russian
Empire/Union of Soviet Socialist Republics during the past millennium
(1000–2000)[34] are summarized in Table 1, including name, authors,
geographical region, year of the dataset, data files, data publisher, and data
sharing policy, etc.
3 Methods
3.1 Data Collection
The reconstruction period of this dataset covered
five historical periods of Russia, including the Kievan Rus, the Grand Duchy of
Moscow, the Russian Empire, the Union of Soviet Socialist Republics, and the
Russian Federation. Before Yermark??s eastward expedition to Siberia in 1581,
the territory of the Russian regime was mainly distributed in Europe[35].
Considering that the boundaries of the Russian regime changed frequently in
different historical periods, the spatial scopes of cropland area
reconstruction in this dataset should correspond to the territories of the
Russian regime in the historical periods. At the same time, because the
territory of Russia can be divided into the European part and Siberian part, we
also conducted the cropland area reconstruction of the above two parts in this
study, and the data we used are shown in Table 2. Furthermore, the boundary
data of the Russian regime are listed in Table 2. However, due to the acquirability of historical
materials, we only listed the boundary data of the European part of the Russian
regime and Siberia in several historical periods in Table 2.
3.2 Methods for Reconstructing Cropland Area
In this study, except that the cropland area data
in some historical periods were sourced from the literature, the cropland area
in other periods was calculated by the following formula.
(1) To calculate cropland area by per capita
cropland area and population
 (1)
(1)
where  denotes the per
capita cropland area in year i (km2),
denotes the per
capita cropland area in year i (km2),  denotes the cropland area in year i
(km2), and
denotes the cropland area in year i
(km2), and  denotes the population in year i (people). Equation (1) was used to reconstruct the
cropland area of Siberia in 1590 and 1700.
denotes the population in year i (people). Equation (1) was used to reconstruct the
cropland area of Siberia in 1590 and 1700.
However, there were only population records and no records of the per
capita cropland area in the materials of some historical periods, such as 1719.
In the reconstruction of cropland area, we assumed that the change in per
capita cropland area before and after 1719 was approximately linear[26].
The cropland area in 1719 was calculated using Equation (2).
 (j<i<h) (2)
where denotes the cropland area in the year i
(km2),  denotes the
cropland area in the year h (km2), the year h after the year
i,
denotes the
cropland area in the year h (km2), the year h after the year
i,  denotes the
cropland area in the year j (km2), the year j before the
year i. denotes the
population in year i (people),
denotes the
cropland area in the year j (km2), the year j before the
year i. denotes the
population in year i (people),  denotes the population in year h (people), and
  denotes the population in year j (people). Equation (2) was used to reconstruct the
cropland area of the European part of the Russian Empire in 1719.
denotes the population in year j (people). Equation (2) was used to reconstruct the
cropland area of the European part of the Russian Empire in 1719.
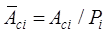
(2) Interconversion between cropland area and
fractional cropland area
 (3)
(3)
where denotes the cropland area in year i
(km2),  denotes the land
area in year i (km2), and
denotes the land
area in year i (km2), and  denotes the
fractional cropland area in year i (%). Equation (3) was used to reconstruct the cropland
area of the European part of the Russian Empire in 1887 and 1914.
denotes the
fractional cropland area in year i (%). Equation (3) was used to reconstruct the cropland
area of the European part of the Russian Empire in 1887 and 1914.
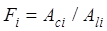
(3) To calculate cropland area by grain yield and
grain yield per unit area
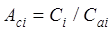 (4)
(4)
where denotes the
cropland area in year
i (km2),  denotes the grain yield in
year i
(kg), and
denotes the grain yield in
year i
(kg), and  denotes the grain yield per unit area in year
i (kg/km2). Equation (4) was used to reconstruct
the cropland area of Siberia in 1913.
denotes the grain yield per unit area in year
i (kg/km2). Equation (4) was used to reconstruct
the cropland area of Siberia in 1913.
Table 1 Metadata summary of the Cropland area
dataset of Russian Empire/Union of Soviet Socialist Republics during the past
millennium (1000–2000)
|
Items
|
Description
|
|
Dataset
full name
|
Cropland
area dataset of Russian Empire/Union of Soviet Socialist Republics during the
past millennium (1000–2000)
|
|
Dataset
short name
|
CroplandChangewRussia_1000–2000
|
|
Authors
|
Zhao, Z. L. ABH-1134-2021, Beijing Normal University, zhaozhilong@bnu.edu.cn
Li, J., Beijing Normal
University, 201931051018@mail.bnu.edu.cn
Fand, X. Q., Beijing Normal
University, xfang@bnu.edu.cn
Ye, Y., Beijing Normal
University, yeyuleaffish@bnu.edu.cn
|
|
Geographical
region
|
the European part of Russian
Empire/Union of Soviet Socialist Republics, and Siberia
|
|
Year
|
1000–2000
|
|
Data
format
|
.shp, .xlsx
|
|
|
|
Data
size
|
1.11 MB??after compression??
|
|
|
|
Data
files
|
(1)
Spatial data includes: the boundary data of the European part of Russian
Empire in 1000, 1533, and 1900; the boundary data of the European part of
Union of Soviet Socialist Republics in 1958; and the boundary data of Siberia
(2) The tabular data includes: Sheet-1: cropland area data of Russian
Empire/Union of Soviet Socialist Republics over the periods of 1000–2000; (2)
Sheet-2: cropland area data of the European part of Russian Empire/Union of
Soviet Socialist Republics over the periods of 1000–2000; (3) Sheet-3:
cropland area data of Siberia over the periods of 1590–2000
|
|
Foundation
|
Ministry of Science and Technology of the People??s Republic of China
(2017YFA0603304)
|
|
Data computing
environment
|
Microsoft Excel 2019;
ArcGIS
|
|
Data
publisher
|
Global Change Research Data Publishing &
Repository, http://www.geodoi.ac.cn
|
|
Address
|
No.
11A, Datun Road, Chaoyang District, Beijing 100101, China
|
|
Data
sharing policy
|
Data from the Global Change Research Data
Publishing & Repository includes metadata, datasets (in the Digital Journal of Global
Change Data Repository), and publications (in the Journal of Global
Change Data & Discovery).
Data sharing
policy includes: (1) Data are openly available and can
be free downloaded via the Internet; (2) End users are encouraged to use Data
subject to citation; (3) Users, who are by definition also value-added
service providers, are welcome to redistribute Data subject to written
permission from the GCdataPR Editorial Office and the issuance of a Data
redistribution license; and (4) If Data are used to compile new
datasets, the ??ten per cent principal?? should be followed such that Data
records utilized should not surpass 10% of the new dataset contents, while
sources should be clearly noted in suitable places in the new dataset[36]
|
|
Communication and searchable system
|
DOI, CSTR, Crossref, DCI,
CSCD, CNKI, SciEngine, WDS/ISC, GEOSS
|
(4) To calculate cropland area inferred from the
number of towns
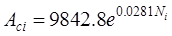 (5)
(5)
where denotes the
cropland area in year i
(Units: km2), and  denotes the number of towns in
year i
(Units: pcs). Using the data in Table 2 and Equations (2) and (3), we can reconstruct
the cropland area of the European region of Russia from 1500 to 2000 in this
study. We found that there was a correlation between the cropland area and the
number of towns during this period, that is, Equation (5) (R2=0.92, p<0.01).
Since it was difficult to mine the cropland area data of Russia before 1500, we
used Equation (5) and the number of towns in Table 2 to reconstruct the
cropland area of the European part of the Russian Empire from 1000 to 1400 in
this study.
denotes the number of towns in
year i
(Units: pcs). Using the data in Table 2 and Equations (2) and (3), we can reconstruct
the cropland area of the European region of Russia from 1500 to 2000 in this
study. We found that there was a correlation between the cropland area and the
number of towns during this period, that is, Equation (5) (R2=0.92, p<0.01).
Since it was difficult to mine the cropland area data of Russia before 1500, we
used Equation (5) and the number of towns in Table 2 to reconstruct the
cropland area of the European part of the Russian Empire from 1000 to 1400 in
this study.
(5) Interpolation of cropland area
According to the
data in Table 2 and the above equations, we can reconstruct two cropland area
series, including the cropland area of the European part of Russia from 1000 to
2000 and the cropland area of Siberia from 1590 to 2000. However, the time
sections corresponding to the two cropland area series were inconsistent. To
explore the changes in the two cropland area series in each century, it was
proposed to reconstruct the cropland area data of 13 time periods, including
1000, 1100, 1200, 1300, 1400, 1500, 1600, 1700, 1800, 1850, 1900, 1950 and
2000. In the two reconstructed cropland area series for the European
Table 2 Data sources
for the dataset development
|
Time
|
Type of data
|
Coverage area
|
Data Sources
|
|
1000–2000
|
The number of towns
|
The European part of Russian Empire
|
Euratlas Shop: Georeferenced Historical Vector
Data 1500
|
|
1000
|
Boundary data
|
The European part of Russian Empire
|
The Routledge Atlas of Russian History [37]
|
|
1500, 1540, 1585
|
Cropland area
|
The European part of Russian Empire
|
The agriculture of Grand Duchy of Moscow in
the 16th century[38]
|
|
1533
|
Boundary data
|
The European part of Russian Empire
|
The Routledge Atlas of Russian History [37]
|
|
1590
|
Per capita cropland area, population
|
Siberia
|
Review and Prospect of the development of the eastern region of the
Union of Soviet Socialist Republics—four hundred years of the development of
Siberia[39]
Comparative development history[40]
|
|
1700
|
Per capita cropland area, population
|
Siberia
|
The history of Siberia[41]
The history of Siberia: From Russian conquest
to Revolution[42]
Siberia: A history of the people[43]
|
|
1696, 1725, 1763, 1796, 1856
|
Cropland area, population
|
The European part of Russian Empire
|
Life History of the Tsarist Russia Age[44]
|
|
1719
|
Population
|
The European part of Russian Empire
|
Life History of the Tsarist Russia Age[44]
|
|
1858
|
Cropland area
|
Siberia
|
Commonalities and characteristics of Siberian
agricultural development from the second half of the 19th century to the
beginning of the 20th century[45]
|
|
1887, 1914
|
Fractional cropland area, land area
|
The European part of Russian Empire
|
Life History of the Tsarist Russia Age[44]
|
|
1900
|
Boundary data
|
The European part of Russian Empire
|
Life History of the Tsarist Russia Age[44]
|
|
1913
|
Grain yield, grain yield per unit area
|
Siberia
|
Stalin, Siberia and the crisis of The New
Economic Policy[46]
|
|
1937,1954
|
Cropland area
|
Siberia
|
The history of Siberia[41]
|
|
1958
|
Boundary data
|
The European part of Union of Soviet Socialist Republics, Siberia
|
http://www.gadm.org/
|
|
1958, 2000
|
Cropland area
|
The European part of Union of Soviet Socialist Republics/Russian Federation,
Siberia
|
Statistical yearbook of national economy of the Union of Soviet
Socialist Republics in 1959 [47], Russian Statistical Yearbook 2003[48]
|
|
1983
|
Cropland area
|
Siberia
|
Agriculture in Siberia and the Far East of the Union of Soviet Socialist
Republics[49]
|
part of Russia and Siberia, if there were no data
at the 13 time sections, it was necessary to adopt the method of the annual
average growth rate for the interpolation of cropland area at these time
sections with no data[50]. Then, by adding the cropland area of the
European part of Russia and Siberia, we can obtain the reconstruction data of
cropland area in the Russian Empire/Unions of the Soviet Socialist Republics
during the past millennium.
4 Data Results and Validation
4.1 Dataset Composition
The metadata of the Cropland area dataset of
Russian Empire/Union of Soviet Socialist Republics during the past millennium
(1000–2000) included 5 sets of spatial data and 3 sets of tabular data, as
follows. Spatial data included the boundary data of the European part of the
Russian Empire in 1000, 1533, and 1900; the boundary data of the European part
of the Union of Soviet Socialist Republics in 1958; and the boundary data of
Siberia. The tabular data included cropland area data of the Russian
Empire/Union of Soviet Socialist Republics over the period of 1000–2000;
cropland area data of the European part of the Russian Empire/Union of Soviet
Socialist Republics over the period of 1000–2000; and cropland area data of
Siberia over the period of 1590–2000.
4.2 Data Results and Validation
|
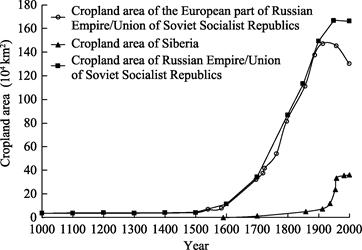
Figure 1 Cropland area change in the
Russian Empire or Union of Soviet Socialist Republics during the past
millennium
|
The cropland area change of the Russian Empire/Union
of Soviet Socialist Republics during the past millennium is shown in Figure 1.
From 1000–2000, the total cropland area of the study area increased from 3.69??104 km2 to
166.27??104 km2 (Figure 1). From 1000 to 1500, the total
cropland area was small, and it increased from 3.69??104 km2
to 4.26??104 km2 and remained no more than 5??104
km2. From 1600 to 1950, the total cropland area increased
continuously, from 11.38??104 km2 to 166.85??104
km2. From 1950 to 2000, the total cropland area showed a slight
declining trend, decreasing from 166.85??104 km2 to
166.27??104 km2.
In 1581, Yermark made an eastward expedition to Siberia. In 1586, after
entering Siberia, Russia established the first city, Tyumen, which is located
next to the Tuul river. Then, Russia continued to advance eastward and
completed its control of Siberia in 1860[42,43]. Before 1586, the
territory of the Russian regime was mainly distributed in Europe. Therefore,
the cropland area of the European part of the Russian Empire should be equal to
that of the Russian Empire in the periods before 1586. From 1000 to 1585, the
cropland area of the European part of the Russian Empire increased from 3.69??104
km2 to 8.02??104 km2. From 1585 to 1914, the
cropland area of the European part of the Russian Empire increased continuously,
from 8.02??104 km2 to 147.40??104 km2.
Then, the cropland area of the European part of the Russian regime continued to
decline, and it decreased to 130.12??104 km2 in 2000
(Figure 1).
In this study, we reconstructed the cropland area of Siberia over the
period of 1590–2000. During this period, the cropland area of Siberia increased
from 0.01??104 km2 to 36.15??104 km2.
From 1590 to 1913, the cropland area of Siberia did not exceed 10??104
km2. The cropland area of Siberia increased continuously in the
period of 1937–2000, from 11.96??104 km2 to 36.15??104
km2.
To evaluate the credibility of the reconstructed results in this study, we
compared them with the available values in other published literature. The
differences in cropland area were less than 10%. This means that the results in
this study are credible[51].
5 Discussion and Conclusion
This dataset reconstructed the cropland area of
the Russian Empire/Union of Soviet Socialist Republics from 1000 to 2000 based
on historical documents. In this study, it can be seen that the total cropland
area of the Russian Empire/Union of Soviet Socialist Republics increased from
3.69??104 km2 to 166.27??104 km2
during 1000–2000, with the phasic characteristics of slow increase
(1000–1600)–continuous increase (1600–1950)–slight decrease (1950–2000).
Analysing the regularity of cropland change can provide a data and scientific
basis for LUCC and related agricultural research in Russia for historical
periods. Furthermore, this dataset can provide a reference for relevant
research on cropland reconstruction in historical periods all over the world.
Author Contributions
Fang, X. Q. and Ye, Y. designed the study; Li, J.
and Zhao, Z. L. completed the data processing and analysis; Zhao, Z. L. drafted
the paper.
Conflicts of Interest
The authors declare no conflicts of
interest.
References
[1]
Sterling, S.
M., Ducharne, A., Polcher, J. The impact of global land-cover change on the
terrestrial water cycle [J]. Nature Climate Change, 2012, 3(4): 385–390.
[2]
Mooney, H. A.,
Duraiappah, A., Larigauderie, A. Evolution of natural and social science interactions
in global change research programs [J]. Proceedings of the National Academy of Sciences
of the United States of America,
2013, 110(Sup.1): 3665–3672.
[3]
Santana-Cordero,
A. M., Monteiro-Quintana, M. L., Hern??ndez-Calvento, L. Reconstruction of the
land uses that led to the termination of an arid coastal dune system: The case
of the Guanarteme dune system (Canary Islands, Spain), 1834–2012 [J]. Land
Use Policy, 2016, 55: 73–85.
[4]
Pongratz, J.,
Reick, C. H., Raddatz, T., et al. Biogeophysical versus biogeochemical
climate response to historical anthropogenic land cover change [J]. Geophysical
Research Letters, 2010, 37(8): L08702.
[5]
Ellis, E. C.,
Kaplan, J. O., Fuller, D. Q., et al. Used planet: a global history [J]. Proceedings
of the National Academy of Sciences of the United States of America, 2013,
110(20): 7978–7985.
[6]
Gaillard, R.
K., Jones, C. D., Ingraham, P., et al. Underestimation of N2O emissions
in a comparison of the DayCent, DNDC, and EPIC models [J]. Ecological
Applications, 2017, 28(3): 694–708.
[7]
Houghton, R.
A., Nassikas, A. A. Global and regional fluxes of carbon from land use and land
cover change 1850–2015 [J]. Global Biogeochemical Cycles, 2017, 31(3): 456–472.
[8]
IPCC. Climate
change and land: An IPCC special report on climate change, desertification,
land degradation, sustainable land management, food security, and greenhouse
gas fluxes in terrestrial ecosystems [DB/OL]. https://www.ipcc.ch/srccl/.2019.08.
[9]
Zhang, L. S.,
Fang, X. Q., Ren, G. Y. Global Change (second version) [M]. Beijing: Higher Education Press,
2017.
[10]
Fang, X. Q.,
He, F. N., Wu, Z. L., et al. General characteristics of the agricultural
area and fractional cropland cover changes in China for the past 2000 years
[J]. Acta Geographica Sinica, 2021, 76(7): 1732–1746.
[11]
Chen, Q. Q.,
Liu, F. G., Fang, X. Q., et al. Reconstruction of cropland distribution
in the Late Neolithic period in Northern China [J]. Geographical Research,
2019, 38(12): 2927–2940.
[12]
Fang, X. Q.,
Ye, Y., Zhang, C. P., et al. Cropland cover change and its environmental
impacts in the history of China [J]. Journal of Palaeogeography (Chinese Edition), 2019,
21(1): 160–174.
[13]
Gaillard, M.
J., Morrison, K. D., Madella, M., et al. Past land use and land-cover
change: the challenge of quantification at the subcontinental to global scales
[J]. PAGES Magazine, 2018, 26(1): 1–44.
[14]
Klein
Goldewijk, K., Dekker, S. C., van Zanden, J. L. Per-capita estimations of
long-term historical land use and the consequences for global change research
[J]. Journal of Land Use Science, 2017, 12(5): 313–337.
[15]
International
Geosphere-Biosphere Programme (IGBP). PAGES science plan and implementation
strategy, Rep. 57 [M]. Stockholm, Sweden: IGBP Secr, 2009.
[16]
Fuchs, R.,
Verburg, P. H., Clevers, J. G. P. W., et al. The potential of old maps
and encyclopaedias for reconstructing historic European land cover/use change
[J]. Applied Geography, 2015, 59: 43–55.
[17]
Kaplan, J. O.,
Krumhardt, K. M., Gaillard, M., et al. Constraining the deforestation
history of Europe: evaluation of historical land use scenarios with
pollen-based land cover reconstructions [J]. Land, 2017, 6(4): 91.
[18]
Li, M. J., He,
F. N., Li, S. C., et al. Reconstruction of the cropland cover changes in
eastern China between the 10th century and 13th century
using historical documents [J]. Scientific Reports, 2018, 8(1): 13552.
[19]
Ramankutty, N.,
Foley, J. A. Estimating historical changes in global land cover: croplands from
1700 to 1992 [J]. Global Biogeochemical Cycles, 1999, 13(4): 997–1027.
[20]
Kaplan, J. O.,
Krumhardt, K. M., Ellis, E. C., et al. Holocene carbon emissions as a
result of anthropogenic land cover change [J]. The Holocene, 2011,
21(5): 775–791.
[21]
Pongratz, J.,
Reick, C. H., Raddatz, T., et al. A reconstruction of global
agricultural areas and land cover for the last millennium [J]. Global
Biogeochemical Cycles, 2008, 22(3): GB3018.
[22]
Yang, X. H.,
Jin, X. B., Du, X. D., et al. Multi–agent model–based historical
cropland spatial pattern reconstruction for 1661–1952, Shandong province, China
[J]. Global and Planetary Change, 2016, 143: 175–188.
[23]
Fang, X. Q.,
Xiao, L. B., Su, Y., et al. Social impacts of climate change on the
history of China [J]. Journal of Palaeogeography (Chinese Edition), 2017, 17(4): 745–752.
[24]
Yuan, C., Ye,
Y., Tang, C. C., et al. Accuracy comparison of gridded historical
cultivated land data in Jiangsu and Anhui Provinces [J]. China Geographical
Sciences, 2017, 27(2): 273–285.
[25]
Wei, X. Q., Ye,
Y., Zhang, Q., et al. Reconstruction of cropland change over the past
300 years in the Jing-Jin-Ji area, China [J]. Regional Environmental Change, 2016, 16(7): 2097–2109.
[26]
He, F. N., Li,
M. J., Li, S. C. Reconstruction of Lu-level cropland areas in the Northern Song
Dynasty (AD976–1078) [J]. Journal of Geographical Sciences, 2017, 27(5): 606–618.
[27]
Li, S. C.,
Wang, Z. F., Zhang, Y. L. Crop cover reconstruction and its effects on sediment
retention in the Tibetan Plateau for 1900–2000 [J]. Journal of Geographical
Sciences, 2017, 27(7): 786–800.
[28]
Kalesnik, S. V.
The General Introduction of Geography in the Union of Soviet Socialist
Republics [M]. Changchun: Jilin People??s Publishing House, 1978.
[29]
Victor, M.,
Alexander, V. P., Martin, R. J., et al. Spatial determinants and
underlying drivers of land-use transitions in European Russia from 1770 to 2010
[J]. Journal of Land Use Science, 2019, 14(4/6): 362–377.
[30]
Novenko, E.,
Shilov, P., Khitrov, D., et al. The last hundred years of land use
history in the southern part of Valdai Hills (European Russia): reconstruction
by pollen and historical Data [J]. Studia Quaternaria, 2017, 34(2): 73–81.
[31]
Chernova, O.
V., Ryzhova, I. M., Podvezennaya, M. A. The effect of historical and regional
features of land use on the size and structure of carbon pools in the southern
Taiga and forest-steppe zones of European Russia [J]. Eurasian Soil Science,
2018, 51(6): 709–719.
[32]
Tomson, P.,
Bunce, R. G. H., Sepp, K. The role of slash and burn cultivation in the
formation of southern Estonian landscapes and implications for nature
conservation [J]. Landscape and Urban Planning, 2015, 137: 54–63.
[33]
Kukushkina, O.
V., Alyabina, I. O., Golubinskii, A. A. Experience in reconstruction of
agricultural land use for Balakhna District of Nizhniy Novgorod Gubernia in the
18th–19th centuries (on the basis of cartographic
sources) [J]. Eurasian Soil Science, 2018, 51(7): 803–813.
[34]
Zhao, Z. L., Li, J., Fang, X. Q., et al. Cropland area dataset of
Russian Empire / Union of Soviet Socialist Republics during the past millennium
(1000–2000) [DB/OL]. Digital Journal of Global Change Data Repository,
2022. https://doi.org/10.3974/geodb.2022.01.09.V1. https://cstr.escience.org.cn/CSTR:20146.11.2022.01.05.V1.
[35]
GCdataPR
Editorial Office. GCdataPR data sharing policy [OL].
https://doi.org/10.3974/dp.policy.2014.05 (Updated 2017).
[36]
Zibaoluha, ??.
M. Conquering Siberia: from Yermark to Bering [M]. Beijing: China Social
Sciences Press, 2017.
[37]
Gilbert, M. The
Routledge Atlas of Russian History [M]. Beijing: China Youth Press, 2012.
[38]
Department for
History and Philosophy of Lomonosov Moscow State University. The agriculture of
Grand Duchy of Moscow in the 16th century [M]. Moscow: Lomonosov Moscow State
University Press, 1899.
[39]
Xu, J. X.
Review and Prospect of the development of the eastern region of the Union of
Soviet Socialist Republics—four hundred years of the development of Siberia
[M]. Changchun: Northeast Normal University Press, 1988.
[40]
He, S. G.
Comparative development history [M]. Beijing: World Publishing Corporation,
2002.
[41]
Xu, J. X. The
history of Siberia [M]. Harbin: Heilongjiang Education Press, 1991.
[42]
Alan, W. The
history of Siberia: From Russian conquest to Revolution [M]. London and New
York: Routledge, 1991.
[43]
Janet, M. H.
Siberia: A history of the people [M]. New Haven and London: Yale University
Press, 2014.
[44]
Mironov, B. N.
Life History of the Tsarist Russia Age [M]. Beijing: The Commercial Press,
2012.
[45] Gorushkin, L. M., Song,
J. H. Commonalities and characteristics of Siberian agricultural development
from the second half of the 19th century to the beginning of the 20th century
[J]. Siberian Studies, 2004, 31(1): 52–59.
[46]
Hughes, J. Stalin, Siberia and the crisis of the New
Economic Policy [M]. Cambridge: Cambridge University Press, 1991.
[47]
Central Bureau
of Statistics of the Council of Ministers of the Union of Soviet Socialist
Republics. Statistical yearbook of national economy of the Union of Soviet
Socialist Republics in 1959 [M]. Beijing: World Affairs Press, 1960.
[48]
Federal State
Statistics Service. Russian Statistical Yearbook 2003 [M]. Moscow: Rosstat,
2003.
[49]
Zhang, Z. E.
Agriculture in Siberia and the Far East of the Union of Soviet Socialist
Republics [J]. Journal of Foreign Studies, 1986, 1: 55–59.
[50]
Li, S. C., He,
F. N., Chen, Y. S. Gridding reconstruction of cropland spatial patterns in
Southwest China in the Qing dynasty [J]. Progress in Geography, 2012,
31(9): 1196–1203.
[51]
Zhao,
Z. L., Fang, X. Q., Ye, Y., et al. Reconstruction of cropland area in
the European part of Tsarist Russia from 1696 to 1914 based on historical
documents [J]. Journal of Geographical Sciences, 2020, 30(8): 1307–1324.