Relief Degree of Land Surface Dataset of China (1 km)
You, Z.1 Feng, Z. M.1,2* Yang, Y. Z.1,2
1. Institute of Geographic Sciences and Natural Resources Research, Chinese Academy of Sciences, Beijing 100101, China;
2. University of the Chinese Academy of Sciences, Beijing 100049, China
Abstract: Relief Degree of Land Surface (RDLS) is a comprehensive representation of regional altitude and surface roughness. Using the re-sampled Digital Elevation Model data, the RDLS of China at 1 km resolution was developed based on the model of Feng et al. (2007). The dataset includes the spatial distribution data for RDLS at 1 km covering China and each national province and the statistic data for average RDLS for provinces, cities and counties in China. The dataset was archived in ArcGIS Grid and .xlsx data format, consisting of 522 data files. The data size was 126 MB (compressed to one data file in 11.2 MB).
Keywords: altitude; relief degree of land surface; surface roughness; China; km gird; Digital Evaluation Model
1 Introduction
Relief degree of land surface (RDLS) is a comprehensive representation of regional altitude and surface cutting. Since the concept of RDLS was proposed, using it as an important index to classify geomorphic patterns has gradually become an important component of map compilation worldwide. Furthermore, as interdisciplinary research has become more common, RDLS has been widely applied to geologic and environmental evaluations[1–5]. Studying its relationship with regional population, economics, and society has become more popular[6–10] in humanities and social sciences. Due to the differing applications between disciplines, its definition, extraction method and expression have become key factors in improving the effectiveness and practicality of studying RDLS.
Therefore, based on the definition and equations provided by Feng et al.[6] for evaluating China’s human settlement environment, a dataset providing China’s RDLS at 1 km resolution was produced using Digital Evaluation Model (DEM) data and the spatial analysis module in ArcGIS. Based on this dataset, this study used provinces, cities, and counties as statistical units and calculated their RDLS. The dataset reflects the spatial distribution patterns of RDLS at different spatial scales in China, and provides data support for studying different spatial scales.
2 Metadata of Dataset
Table 1 summarizes the main metadata elements of the Rdls China1km dataset[13].
Table 1 Metadata summary of relief degree of land surface dataset of China (1 km)
|
Items
|
Description
|
|
Dataset full name
|
Relief degree of land surface dataset of China (1km)
|
|
Dataset short name
|
RdlsChina1km
|
|
Authors
|
You, Z. M-5487-2018, Institute of Geographic Sciences and Natural Resources Research, CAS, youz@igsnrr.ac.cn
Feng, Z. M. M-5550-2018, Institute of Geographic Sciences and Natural Resources Research, CAS, fengzm@igsnrr.ac.cn
Yang, Y. Z. M-5556-2018, Institute of Geographic Sciences and Natural Resources Research, CAS, yangyz@igsnrr.ac.cn
|
|
Geographic region
|
3°52'N-53°33'N, 73°40'E-135°2'30"E
|
|
Year
|
2014
|
|
Spatial resolution
|
1 km
|
|
Data format
|
Grid, .xlsx Data size 126 MB (11.2 MB after compression)
|
|
Data files
|
The dataset consists of two types of documents. One is for the whole country and 34 provinces based on the 1 km grid. The other is the statistics based on provinces, prefectures, and counties
|
|
Foundation(s)
|
Ministry of Science and Technology of P. R. China (2016FYC0503500); National Natural Science Foundation of China (41430861)
|
|
Data publisher
|
Global Change Research Data Publishing & Repository, http://www. geodoi.ac.cn
|
|
Address
|
No. 11A, Datun Road, Chaoyang District, Beijing 100101, China,
|
|
Data sharing policy
|
Data from the Global Change Research Data Publishing & Repository includes metadata, datasets (data products), and publications (in this case, in the Journal of Global Change Data & Discovery). The Data sharing policy includes: (1) Data, which are openly available and can be free downloaded via the Internet; (2) end users are encouraged to use Data subject to citation; (3) users, who are by definition also value-added service providers, are welcome to redistribute Data subject to written permission from the GCdataPR Editorial Office and the issuance of a Data redistribution license, and; (4) if Data are used to compile new datasets, the ‘ten percent principal’ should be followed such that Data records utilized should not surpass 10% of the new dataset contents, while sources should be clearly noted in suitable places in the new dataset[14]
|
3 Methodology
3.1 Algorithm Principle
In this study, RDLS is defined as the topographic relief above the horizontal surface of average elevation in a certain area, and it is an important index for evaluating environment conditions. Based on Feng et al.[6], this study defines the relevant parameter as follows:
 (1)
(1)
where RDLS is relief degrees of land surface; ALT is the average elevation in a grid cell (m); Max(H) and Min(H) represent the highest and lowest altitudes in this grid cell respectively (m); P(A) is the area of flat land (km2); and A is the total area of the extraction unit.
The denominator (500 m) in equation (1) brings RDLS geographical significance because the altitude of 500 m is used as the dividing elevation between mountain and hill (benchmark mountain) in Landform Classification System of China[11]: If the RDLS is several times of 1, relief degree of land surface is the several times of the height of benchmark mountain. If the values are less than 1, relief degree of land surface is below the height of a benchmark mountain. This study is based on 1 km´1 km raster data for extraction, which serves as a macro scale regional assessment. After referencing the method for Chinese geomorphologic mapping and the results of classifying relief degree of land surface[12,15], the size of the statistical unit was determined as 25 km2. Therefore, a maximum altitude difference of less than or equal to 30 m in a 5 km´5 km raster window is regarded as flat land.
3.2 Description of Data Sources
The original data for calculating DEM data were obtained from the Resource and Environment Science Data Center of the Chinese Academy of Sciences (http://www.resdc.cn); the data are based on radar topographic mapping SRTM (Shuttle Radar Topography Mission) data collected by the U.S. Space Shuttle Endeavour. The data used for calculations were 1 km resolution, based on resampling from 90 m SRTM data. The Albers authalic conical projection (Krasovsky_1940_Albers) was applied.
3.3 Calculation Process
The RDLS was extracted primarily based on the window analysis method using the Neighborhood sub-module of the spatial analysis module in ARC/INFO software. Taking a 5 km´5 km grid as the basic research unit for the whole country, the value was extracted from the basic unit. The calculation process is as follows (Figure 1):
(1) The average elevation, maximum elevation, and minimum elevation in the grid area is extracted. Focus statistics in the neighborhood analysis is used with A as the total area of the extraction unit. Because the extraction unit is a 5 km´5 km grid, the value of A is 25 km2. The average elevation, maximum elevation, and minimum elevation are then calculated for each unit.
(2) The maximum elevation difference is extracted for the grid area, 5 km´5 km. The differences between the maximum and minimum data layers obtained in the previous step are calculated using the raster calculator and the maximum elevation difference as the unit.
(3) The proportion of non-flat land in the raster area is then calculated. The proportion of the non-flat ground ([1-P(A)/A]) is calculated in the raster area using the raster calculator.
(4) The RDLS is extracted. The absolute RDLS in the region can be calculated by dividing the average elevation, which is obtained from the step (1), by 1,000. Multiplying the result layer from steps (2) and (3) and dividing the result by 500 provides the relative RDLS. Then, the RDLS of the unit can be obtained by adding the results of the absolute and relative value.
(5) The dataset is adjusted to give each grid a visible value; the previous data is multiplied by 100 and rounded. Then, the RDLS raster data value is divided by 100.
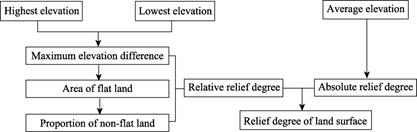
Figure 1 Flow chart for relief degree of land surface (RDLS) extraction
4 Results
|
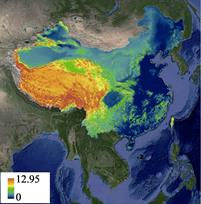
Figure 2 Distribution of relief degree of land surface as an altitude and topographic relief composite index for China at 1 km resolution
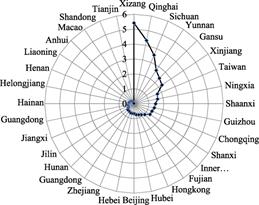
Figure 3 Topographic relief in the provinces of China
|
In the Figure 2, the values of China’s RDLS lie between 0 and 12.95. Generally, China’s RDLS can be characterized spatially by a three-step distribution of terrain conditions. The overall spatial distribution of topographic relief is higher in the west than in the east, and higher in the south than in the north. The highest values are distributed in the southeastern part of the Tibet-Hengduan Mountains and Tianshan Mountains.
At the provincial level (Figures 3-5), Shanghai and Tibet are the provinces (municipalities) with the lowest and highest RDLS in China, respectively. The values for Shanghai, Jiangsu, Tianjin, and Shandong Provinces are low and all are less than 0.1. In contrast, values for Tibet, Qinghai, Sichuan, Yunnan Provinces are more than 2.5, and these provinces are mainly distributed in the Tibetan Plateau and Yunnan Guizhou Plateau region. Among the 34 provinces, 61.76% of the province’s topographic relief is less than 1, and only 17.65% of the province’s topographic relief is greater than 2 (Figure 3).
|
Table 2 Statistics of degree of relief for the prefecture-level cities in China
|
RDLS
|
0–0.5
|
0.5–1
|
1–2
|
2–3
|
>3
|
|
Number of cities
|
183
|
52
|
75
|
22
|
30
|
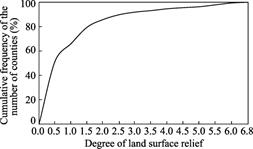
Figure 4 Cumulative curve of topographic relief in China
|
At the prefecture level, the distribution of topographic relief in China is basically in agreement with the distribution trends for the three terrain levels. The RDLS for the eastern coastal areas and Sichuan basin is low, while that for central China, i.e., Inner Mongolia, the Loess Plateau, and Yunnan-Guizhou Plateau are moderate, and values for the Qinghai-Tibet Plateau in southwestern China are highest. In the 362 prefecture-level cities (excluding Taiwan), cities with the RDLS less than 1 account for 64.92%, mainly in the eastern part of China (Table 2, data file: Rdls_China.xlsx).
At the county level, relief degree of land surface for most Chinese counties is low. When the value reaches 0.5, the cumulative frequency of the number of counties reaches 51.76%. When the value reaches 1, the cumulative frequency of the number of counties reaches 66.17%. When the value reaches 2, and 3, the cumulative frequency of the number of counties has reaches 85.90% and 91.48%, respectively (Figure 4).
5 Discussion and Conclusion
The result shows that the relief values in China are between 0 and 12.95. Shanghai and Tibet are the lowest and highest value in China, respectively. The distribution of topographic relief in China’s prefecture-level cities is generally in agreement with the spatial patterns for the
three terrain levels. For most counties, the values are low, with two-thirds of the counties having values less than 1.
Author Contributions
You, Z. was primarily responsible for the dataset design, model calculation, and writing. Feng, Z. M. and Yang, Y. Z. were mainly responsible for model design and guidance on writing and manuscript revision.
References
[1] Saha, A. K., Gupta, R. P., Sarkar, I., et al. An approach for GIS-based statistical landslide susceptibility zonation: with a case study in the Himalayas [J]. Landslides, 2005, 2(1): 61-69.
[2] Chen, J. J., Zhang, S. W., Li, H. X. Assessment on sensitivity of soil erosion in Jilin province [J]. Bulletin of Soil and Water Conservation, 2005, 25(3): 49-53.
[3] Yan, C. M., Li, H. M., Wang, G. Q. Quantitative assessment of geological—environmental quantity of the land along Guangdong coast [J]. Journal of Engineering Geology, 2000, 8(2): 416-425.
[4] You, Z., Yang, Y. Z., Jiang, L. G. The study on relief degree of land surface in the Lancang-Mekong River basin [J]. Journal of Yunnan University (Natural Science), 2012, 34(4): 393-400.
[5] Qi, W. J., Yang, X. M. Mountain and plain vegetation boundaries extraction in Duchang county, Jiangxi province [J]. Journal of Geo-information Science, 2017, 19(4): 559-569.
[6] Feng, Z. M., Tang, Y., Yang, Y. Z. Relief degree of land surface in China and its correlation with population distribution [J]. Acta Geographica Sinica, 2008, 18(2): 237-246.
[7] Hu, X. Study on driving mechanism of rural residential area in Changsha [J]. Economic Research Guide, 2014(22): 22-25, 95.
[8] Feng, Z. M., Zhang, D., Yang, Y. Z. Relief degree of land surface in China at county level based on GIS and its correlation between population density and economic development [J]. Jilin University Journal Social Science Edition, 2011, 51(1): 146-160.
[9] Leng, Z. M., Tang, S. Estimation and spatio-temporal evolution analysis of self-development capacity in Wuling Mountain Areas based on county data of 2005, 2008 and 2011 [J]. Acta Geographica Sinica, 2014, 69(6): 782-796.
[10] Zhang, J., Wang, G. L. The relationship between spatial distribution of Xinzhou’s settlements and the degree of landform fluctuation [J]. Journal of Xinyang Normal University Nature Science Edition, 2015, 28(2): 195-198.
[11] Strategy research group of sustainable development of Chinese Academy of Sciences. 2005 Strategic Report: China’s Sustainable Development [M]. Beijing: Science Press, 2005: 273.
[12] Chen, Z. M., Liu, Z. D., Yu, X. B. Compilation of Chinese geomorphological maps [J]. Map, 1995: 36-38.
[13] You, Z., Feng, Z. M., Yang, Y. Z. Relief degree of land surface dataset of China (1 km) [DB/OL]. Global Change Research Data Publishing & Repository, 2018. DOI: 10.3974/geodb.2018.03.16.V1.
[14] GCdataPR Editorial Office. GCdataPR data sharing policy [OL]. DOI: 10.3974/dp.policy.2014.05 (Updated 2017).
[15] Chen, Z. M. On the principle, contents and methods used to compile the Chinese geomorphological maps- taking the 1??4,000,000 Chinese geomorphological map as an example [J]. Acta Geographica Sinica, 1993, 48(2): 105-113.