Characteristics
of Pre-flood Season Flow Velocity in Southeastern Tibet,
China
Pu, H. C.1,2,3 Chen, B.1,2,3* Xiao, Y.1,2,3 Liu, L. Y.1,2,3 Shi, P. J.1,2,3 Yan, P.1,2,3
Zhang, G.M.1,2,3 Liu,
J. F.1,2,3
1. The
State Key Laboratory of Earth Surface Processes and Resource Ecology, Beijing
Normal University, Beijing 100875, China;
2. The Key Laboratory of Environmental Change and
Natural Disaster, Beijing Normal University, Beijing 100875, China;
3. Faculty
of Geographical Science, Beijing Normal University, Beijing 100875, China
Abstract: The
Tibetan Plateau is increasingly threatened by floods under climate change. The
densely distributed rivers and relatively more developed socioeconomic
conditions in southeastern Tibet make it necessary to survey flood
characteristics across this region. Using a handheld radar current meter
(RD-60) and outdoor rangefinders, a dataset of 141 samples from 85 rivers in
southeastern Tibet was collected during a field survey from mid to late June
2021 (the pre-flood season). Based on this dataset, we investigated the
relationship between stream flow velocity and Strahler stream order and the pattern of flow velocity from the river mouth to the
channel head for the Sangqu, Lengqu and Puqu rivers. The results showed
that during the pre-flood season in southeastern Tibet: (1) the stream flow
velocity is generally higher than that measured for nonmountainous rivers; (2)
the average stream flow velocity increases exponentially with Strahler stream
order; and (3) the flow velocity decreases from the mouth to the head of a
stream, owing to the decrease in stream discharge toward the head. The dataset
includes (1) flow velocity, river width, channel slope, Strahler order and
floodplain width measured at 141 locations on 85 rivers in Southeast Tibet and
(2) the distances of the sampling points measured from the river mouths for the
Sangqu, Lengqu and Puqu rivers. The dataset is archived in .shp and.xlsx data
formats, consists of 8 data files and has a size of 159 KB (compressed into a single
file of 37.3 KB).
Keywords: Tibetan
Plateau; stream flow
velocity; flood; floodplain characteristics
DOI: https://doi.org/10.3974/geodp.2022.01.13
CSTR: https://cstr.escience.org.cn/CSTR:20146.14.2022.01.13
Dataset Availability Statement:
The dataset supporting this paper
was published and is accessible through the Digital Journal of Global Change Data Repository
at: https://doi.org/10.3974/geodb.2021.10.03.V1
or https://cstr.escience.org.cn/CSTR:20146.11.2021.10.03.V1.
1 Introduction
The Qinghai-Tibet Plateau is the origin of many
major rivers in Asia such as the Yangtze river, the Yellow river, the
Yaluzangbu river, the Ganges river and the Mekong river, and is crucial for the
ecological security of Asia[1]. Southeast Tibet is demonstrably affected by the summer monsoon. Therefore, there are more extreme
precipitation events[2], and the climate is warmer and wetter than
that in the northwest[3]. The population and economy are more
densely distributed in Southeast Tibet than in Northwest Tibet[4].
With the spatial configuration of terrain and climate, natural disasters occur
frequently in the Qinghai-Tibet Plateau, particularly in Southeast Tibet.
Floods often cause secondary disasters such as landslides and debris flows,
which are highly destructive to the population, the economy, and transportation
routes[5]. With the increasing trends of extreme precipitation under climate change[1,6,7] and
socio-economic development, the risk of flood and flood-geological disaster
cascades may increase in the Qinghai-Tibet Plateau[3]. The
Qinghai-Tibet Plateau covers a vast area and has relatively sparse
population, and there are relatively few hydrological data due to the sparse
distribution of hydrological stations[8,9]. Therefore, conducting
field surveys of flood characteristics in the Qinghai-Tibet Plateau is of
practical significance to facilitate risk prevention of floods and their
disaster cascades in this region.
Table 1 Metadata summary of the Pre-flood
environment field survey dataset in Southeastern Tibet
of China (2021)
|
Items
|
Description
|
|
Dataset full
name
|
Pre-flood
environment field survey dataset in Southeastern Tibet of China (2021)
|
|
Dataset
short name
|
Pre-flood
_SETibet_2021
|
|
Authors
|
Pu, H. C., Faculty of Geographical Science, Beijing
Normal University, 202121051170@mail.bnu.edu.cn
Chen, B.,
AAA-2670-2022, Faculty of Geographical Science, Beijing Normal
University, bochen@bnu.edu.cn
Xiao, Y., Faculty of Geographical Science, Beijing
Normal University, 202021051173@mail.bnu.edu.cn
Liu, L. Y.,
Faculty of Geographical Science, Beijing Normal University, lyliu@bnu.edu.cn
Shi, P. J.,
Faculty of Geographical Science, Beijing Normal University, spj@bnu.edu.cn
Yan, P.,
Faculty of Geographical Science, Beijing Normal University, yping@bnu.edu.cn
Zhang, G. M.,
Faculty of Geographical Science, Beijing Normal University, zgm@bnu.edu.cn
Liu, J. F,
Faculty of Geographical Science, Beijing Normal University,
liujifu@bnu.edu.cn
|
|
Geographical
region
|
Southeastern
Qinghai-Tibet Plateau
|
|
Year
|
June 15 to
June 26, 2021 Data format .xlsx, .shp
|
|
Data size
|
159 KB
(before compression); 37.3 KB (after compression)
|
|
Data files
|
8 files
(compressed into 1 file)
(1) .xlsx
table file: sheet 1 is the stream flow velocity, river width, channel slope,
Strahler order and floodplain width at 141 measuring points in southeastern
Tibet. Sheets 2, 3 and 4 are the distances from the measuring point of Puqu
river, Sangqu river and Lengqu river to their river mouth, respectively
(2) Preflood
_SETibet_2021 shp folder:.shp format file of the location of 141 measurement
points in southeastern Tibet
|
|
Foundations
|
Ministry of
Science and Technology of P. R. China (2019QZKK0906, 2016YFA0602404)
|
|
Data
publisher
|
Global Change Research Data Publishing & Repository,
http://www.geodoi.ac.cn
|
|
Address
|
No. 11A,
Datun Road, Chaoyang District, Beijing 100101, China
|
|
Data sharing
policy
|
Data
from the Global Change Research Data Publishing & Repository includes metadata,
datasets (in the Digital Journal of Global Change Data Repository),
and publications (in the Journal of Global Change Data & Discovery). Data sharing
policy includes: (1) Data are openly available and can
be free downloaded via the internet; (2) end users are encouraged to use Data
subject to citation; (3) users, who are by definition also value-added
service providers, are welcome to redistribute Data subject to written
permission from the GcdataPR Editorial Office and the issuance of a Data
redistribution license; and (4) if Data are used to compile new
datasets, the ??ten percent principal?? should be followed such that Data
records utilized should not surpass 10% of the new dataset contents, and
sources should be clearly noted in suitable places in the new dataset[11]
|
|
Communication and searchable system
|
DOI, CSTR, Crossref, DCI,
CSCD, CNKI, SciEngine, WDS/ISC, GEOSS
|
2 Metadata of
the Dataset
The metadata of the Pre-flood environment field
survey dataset in
Southeastern Tibet of China (2021)[10] is summarized in Table 1.
3 Data
Acquisition Method
3.1 Acquisition Time
The
data were collected from June 15 to June 26, 2021, during the early stage of
the flood season for the entire Qinghai-Tibet Plateau and its southeast. Figure
1a displays the monthly distribution of
long-term average precipitation (1961?C2017) and flood disasters (1961?C2010).
Precipitation and flood disasters on the Qinghai-Tibet Plateau mainly occur
during the period from June to August. The precipitation and flood disaster
distribution from June to August accounts for 58% and 81% of the entire year,
respectively. Compared with May, the proportion of precipitation and number of
flood events in June increased by approximately 8% and 14%, respectively and
were second only to levels in July and August. The precipitation in July
accounts for the largest proportion of the annual total, about 20%, and the
number of flood disasters accounts for approximately 34% of the total for the
year.
In Southeast Tibet, in June, precipitation
accounts for a large proportion of the entire year, and river runoff begins to
rise, which is approximately 1?C2 months prior to the time of peak monthly
runoff. Using the hydrological and meteorological (Figure 1 ) data for Nuxia (the main channel of the
middle reaches of the Yaluzangbu river, located in Pai town, Milin county,
Linzhi city), Lasa (Lasa river) and Changdu (the upper reaches of the Lancang
river) as examples, the monthly runoff in June accounts for 10%?C13% of the
total annual volume and ranks fourth for the year; monthly precipitation in
June accounts for 17%?C20% of the annual total precipitation and ranks third for
the year. In addition, the timing of peak runoff varies across regions. The
monthly peak runoffs of the Nuxia and Lasa stations occur in July, whereas that
of the Changdu station occurs in August. Conducting surveys at the beginning of
the flood season can not only describe the hydrological characteristics of the
flood to a certain extent, but help to safely record the hydrological
characteristics of floods.
3.2
Acquisition Method
Measurements
were made for stream flow velocity, stream width, floodplain width and channel
slope during the field survey. Flow velocity was measured using a RD-60
handheld radar flow meter (Figure 2a).
The instrument uses K-band radar to measure the flow velocity of rivers, sewage
and oceans without contact. It has the advantages of compact size, a battery
power supply, handheld operation and being simple to use. The instruments for
measuring river width and floodplain width were two types of handheld outdoor
rangefinders that use pulses to measure distance and can ensure accuracy under
various lighting conditions. The measuring ranges were 1,500 m (Figure 2b) and 1,000 m (Figure 2c). River width refers to the maximum width of the water at the
time of measurement, and floodplain width refers to the distance between the
riverside vegetation zones on both banks. The channel slope at the measurement
point is the ratio of the elevation difference at 200 m upstream and downstream
of the measurement point to the flow length (400 m). Channel slope measurements
were completed indoors using Google Earth.
Velocity was mainly measured from bridges for two reasons: first, a
velocity measuring instrument is recommended
for use on bridges; second, on the Qinghai-Tibet Plateau, bridges are
ideal locations to approach water flow because it is convenient to select
appropriate measurement points and control the measurement angle, which ensures
the accessibility and accuracy of measurement[15] (Figure 3).
The bridges selected for the survey were located on rivers of different sizes such as the
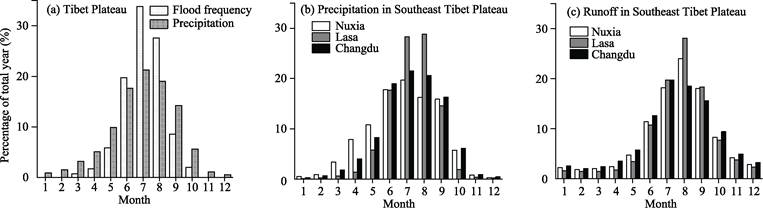
Figure 1 The precipitation and runoff
characteristics of the Qinghai-Tibet Plateau and its southeastern region: (a)
monthly precipitation and flood frequency on the Qinghai-Tibet Plateau (based
on Ma 2019[12], modified); (b) percentage of precipitation relative
to the annual total at three weather stations in southeastern Tibet (based on
Ruan 2000[13], modified); and (c) percentage of runoff relative to
the annual total at three hydrological stations in southeastern Tibet (based on
Liu 1992[14] and Ruan 2000[13], modified)

Figure 2 Data acquisition equipment:
(a) the handheld radar current meter (RD-60) for measuring stream flow
velocity, and two outdoor rangefinders; (b) and (c), used to measure river
width and floodplain width
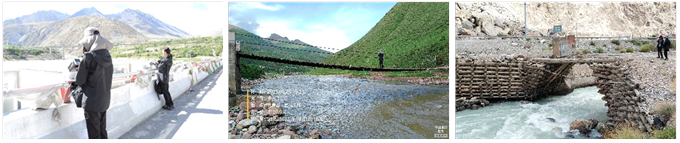
Figure 3
Measuring flow velocity on
rivers of various sizes
Tongmaiteda bridge (across the Yigongzangbu river, a tributary of the Palongzangbu river,
with
a total length of 415.8 m), the medium-sized Padang bridge (across the
Yaluzangbu river, with a total length of 225 m), and the small wooden and iron
bridges (such as the QuXiao bridge and Labu bridge, both of which are 2?C3 m
long). In the process of data acquisition, the single-point
method is used to measure the velocity near the channel thalweg. In general
river velocity measurement, firstly, five or more measurement vertical lines
from the river surface to the river bottom are set on the wetted cross section,
and then the velocity is measured at different water depths by single- point,
three-point or five-point vertical line method on each vertical line[16].
Because the Qinghai-Tibet Plateau has the characteristics of a deep river
valley with rapid water and strong winds, the typical flow velocity measurement
approach is dangerous and often not feasible. In addition, the flood survey
covered a large area and had a tight schedule. Therefore, flow velocities were
measured using the single point approach at river centerlines. The widths of
the rivers and floodplains were generally measured at both ends of the bridge
or at the nearest bank point. To reduce measurement error, three measurements
of flow velocity, river width and floodplain width were made at each sampled
location, and the average was taken as the final value.
3.3 Data Coverage
The data were collected at 141 locations on 85
rivers in 23 counties over more than 2,000 km of river (Figure 4). Among the rivers surveyed there were: (1)
41 survey locations for large rivers (Strahler order[17] greater
than 5), including 19 major rivers in Tibet such as the Yaluzangbujiang river,
Nujiang river, Lancangjiang river, and Niyanghe river; (2) 80 survey locations
for medium rivers (Strahler order 3?C5), including 45 rivers such as the
Gengzhangqu river, Miduiqu river, Puqu river and Lengqu river; and (3) 20 survey
locations for small rivers (Strahler order 1?C2), including approximately 10
rivers such as the Bindaqu river and Daqu river. In addition to flow velocity
measurements, we also conducted a detailed survey for a few watersheds of
various sizes, including the Puqu river (Figure 4a), Lengqu river (Figure 4b),
Sangqu river (Figure 4c), Zhaqu river, Langxuejiegou river, and Miduiqu river.
As shown in Figure 4, high flow velocities tended to cluster southeast of the
surveyed area, and flow velocity appears to increase gradually downstream from
the mountainous area.

Figure 4 Distribution of
survey locations
4 Data Results
Based
on the data collected by the survey, flow velocity characteristics in the
southeastern Qinghai-Tibet Plateau are analyzed, including the relationship
between velocity and Strahler order and the pattern of velocity from the river
mouth to its headwater.
4.1 Statistical Summary of Flow Velocities
The flow velocity and channel slope are
relatively large in Southeast Tibet, which is a region with high discharge[18].
Figure 5 shows the statistical distribution of stream flow velocity and slope
in Southeast Tibet from June 15 to June 26, 2021. As shown in Figure 5a, among
the 141 measuring points, 70 measuring points have velocities above 2 m/s,
accounting for approximately 50% of points; 15 measuring points (10.6%) fall
within the velocity range of (1.25, 1.5]. There are 11 measuring points with
velocities above 4 m/s, mainly located in the southeast of the surveyed region
(Figure 4). Included in these measurements are velocities from the Sangqu river
(3 measurements), the Miduiqu River in Midui glacier (2 measurements) and the
Bomi county section of the Egongzangbu river (2 measurements). The maximum
velocity of survey (5.32 m/s) was measured at the Daxing middle bridge over the
Egongzangbu river in Daxing village of Bomi county. As shown in Figure 5b, the
channel slopes of river in Southeast Tibet are generally large and distributed
exponentially. The channel slope of the measuring points for approximately 80%
is greater than 10% and for more than 50% of the measured points is greater
than 2%. There are 3 measurement points where the channel slope is greater than
30% (48%, 35% and 32%). The largest two channel slopes are located on the Ganongqu
tributary at the Zhamo Highway and at the Yanatongqu near Guoluo village, Basu
county, Changdu. The point where the channel slope is 32% is located at
Renatongqu river near Guoluo village, Basu county, Changdu. These three
measuring points belong to rivers that flow into the valley from steep
hillsides at an angle close to the vertical valley. In southeastern Tibet,
rivers flow fast, and the slopes are steep. After heavy rainfall, the
confluence time of floods is short, so flash floods with short occurrence times
and high intensities often form, resulting in large economic losses and
casualties of human and livestock[19].
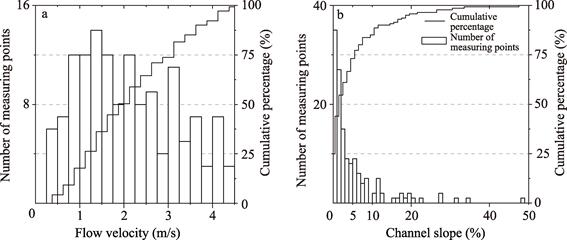
Figure 5 Statistical
distribution of measured flow velocity (a) and channel slope (b).
4.2
The Relationship between Stream Flow Velocity and Strahler Order
Based
on the collected data, the velocity of rivers in the southeastern Qinghai-Tibet
Plateau is exponentially related to the Strahler order (Figure 6). Using the traditional Strahler river
characteristic analysis method[20], the flow velocity and
characteristic values were classified according to the Strahler order. Although
the velocity of the same order river varies greatly, in general, the average
velocity (v) of the river increases exponentially with the increase in
Strahler order (w).
The fitted exponential function is:
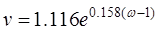 (1)
(1)
|
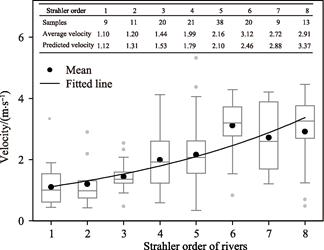
Figure 6 The relationship between river velocity
and Strahler order in the southeastern Qinghai-Tibet Plateau
|
At a significance level of p < 0.001, the Strahler order of the river
explained 91% of the variance in the average river velocity (R2 = 0.911). The average
velocity of the first order rivers measured in the southeastern Qinghai-Tibet
Plateau is 1.10 m/s, and the fitted value based on Equation (1) is 1.12 m/s.
Although there is some fitting error in the velocity- Strahler order
relationship of the river, the relationship can be used for the simple
calculation of velocity in areas with scarce data in the southeastern
Qinghai-Tibet Plateau.
4.3 Pattern of Flow
Velocity from the River Mouth to Its Source
Taking
the Sangqu, Lengqu and Puqu rivers as examples, Figure 7 shows the changes in the stream flow velocity, river width and
slope of the three rivers (Sangqu, Lengqu and Puqu rivers) from the river mouth
to the source of the river. From the simple linear fit between flow velocity
and the distance from the river mouth to the
source, the slopes of all fitted lines are negative (?C0.009, ?C0.017 and ?C0.044,
respectively, excluding singular values). The significance levels of the fit
relationship were < 0.01, < 0.01 and < 0.1 (excluding singular
values). The flow velocity of the three rivers gradually decreases from the
river mouth to the source. This result is inconsistent with the general
impression that rivers in mountainous areas have relatively steep slopes, and
so the flow velocity is greater than that of rivers in relatively flat areas
downstream.
According to
the Manning equation, the channel slope and hydraulic radius (when the river
width is much greater than the water depth, the hydraulic radius is
approximately equal to the water depth) are the main factors influencing stream
flow velocity[21]. Generally, the slope upstream is greater, but the
runoff (or water depth) downstream increases with the increase in catchment area
or the number of confluence tributaries. Therefore, the change in velocity from
the source area to the river mouth along the same river is the combined effect
of slope and flow.
The above data and analysis show that for the Sangqu, Lengqu and
Puqu rivers, the closer the distance to the river mouth, the larger the
catchment area and/or the greater the number of tributaries. Although the
stream flow velocity decreases from the river mouth to the source, the overall
trend may show small fluctuations due to local river slope and river width
changes. For example, the Puqu river shows the stream flow velocity that
differs from the overall trend at the maximum value of river width and the
maximum value of channel slope (Figure 7). When these two singular points are
included, the slope of the general curve fitting equation is ?C0.004, and the statistical test is not
significant. When they are not included, the downward trend of the velocity
tracing becomes 0.044 m/s per kilometer and passes the statistical significance
test at the level of p = 0.1. It
shows that there are fewer tributaries on both sides of the Puqu river, and the
increase in river water volume is not as great as that in the Sangqu river and
Lengqu river.
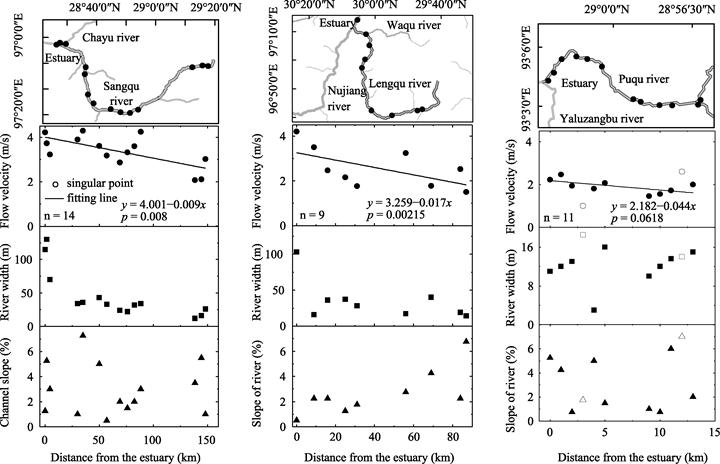
Figure 7 Changes in velocity, width and
slope of the Sangqu river, Lengqu river and Puqu river from the river mouths to
their sources
5 Discussion and Conclusion
The
dataset was developed through field measurements based on a handheld radar
current meter (RD-60) and outdoor rangefinders. By analyzing the statistical
distribution characteristics of the data, the relationship between the
velocity and the Strahler order of river, and the pattern of flow velocity from
the river mouth to the channel head, the following conclusions are drawn:
compared with plain areas, the flow velocity of the Qinghai-Tibet Plateau is
generally higher; as a whole, the higher the Strahler order, the faster the
river flows; in some rivers on the Qinghai-Tibet Plateau, the closer the
distance to the river mouth, the higher the stream flow velocity, and the
increase of stream flow velocity mainly comes from the increase in runoff.
Author
Contributions
Chen, B., Pu, H. C., and Xiao, Y.
designed the survey and compiled the dataset. Xiao, Y., Pu, H. C., and Chen, B.
contributed to the data collection, processing and analysis. Pu, H. C. and
Chen, B. wrote the paper. Liu, L.Y., Shi, P. J., Yan, P., Zhang, G. M., and
Liu, J. F. discussed the data collection plan and revised the manuscript.
Acknowledgements
We thank Professor Yang, W. T. for helpful discussion and Ouzhu, P. J. and others
for their patient and kind help with data collection.
Conflicts
of Interest
The authors declare no conflicts of interest.
References
[1]
Fu, M. N. The response of
climate change in the Qinghai Tibet Plateau to the challenge of disaster
prevention and reduction in China [J]. Disaster
Reduction in China, 2021(7): 46?C49.
[2]
Wang, X. J., Cheng, S. M.
Analysis of major climate characteristics in Tibet [J]. Plateau and Mountain Meteorology Research, 2009, 29(4): 81?C84.
[3]
Ma,
W. D., Liu, F. G., Zhou, Q., et al. Characteristics of extreme precipitation over the Qinghai-Tibet
Plateau from 1961 to 2017 [J]. Journal of
Natural Resources, 2020, 35(12): 3039?C3050.
[4]
Qi, W., Liu, S. H., Zhou, L.
Regional differentiation of population in Tibetan Plateau: insight from the ??Hu
Line?? [J]. Acta Geographica Sinica,
2020, 75(2): 255?C267.
[5]
Wu, J. L., Cheng, Z. S., Geng,
X. Y. Formation of dam from debris flow in the Southeast Tibet [J]. Mountain Research, 2005(4): 4399?C4405.
[6]
Li,
L., Chen, X. G., Wang, Z. Y, et al. Climate change and its regional differences over the Tibetan
Plateau [J]. Climate Change Research,
2010, 6(3): 181?C186.
[7]
Xu,
L. J., Hu, Z. Y., Zhao, Y. N., et al. Climate change characteristics in Qinghai-Tibetan Plateau during
1961 2010 [J]. Plateau Meteorology,
2019, 38(5): 911?C919.
[8]
Gong,
T. L., Wang, X. J., Xie, Y. H., et al. The spatial distribution characteristics of Tibet hydrological
monitoring network [J]. Journal of China
Hydrology, 2004(6): 41?C43.
[9]
Lan,
C., Zhang, Y. X., Zhu, F. X., et al.
Characteristics and changes of streamflow on the Tibetan Plateau: a review [J].
Journal of Hydrology: Regional Studies, 2014, 2: 49?C68.
[10]
Pu,
H. C., Chen, B., Xiao, Y., et al. Pre-flood environment field survey dataset in Southeastern Tibet
of China (2021) [J/DB/OL]. Digital
Journal of Global Change Data Repository, 2021. https://doi.org/10.3974/ geodb.2021.10.03.V1. https://cstr.escience.org.cn/CSTR:20146.11.2021.10.03.V1.
[11]
GCdataPR Editorial Office. GCdataPR data sharing
policy [OL]. https://doi.org/10.3974/dp.policy.2014.05 (Updated 2017).
[12]
Ma, W. D. Characteristics of
extreme precipitation in Qinghai-Tibet Plateau and estimation of critical
rainfall for flood disasters [D]. Xining: Qinghai Normal university, 2019.
[13]
Ruan, B. Q., Wang, H. Resource
conditions and discussion on possible quantity of water transfered from the
southwest to north China [J]. Journal of
Tsinghua University (Science and
Technology), 2000(S1): 101?C106.
[14] Liu, G. W. Hydrometeorological characteristics of the Tibet Plateau
[J]. Journal of Hydraulic Engineering,
1992(5): 1?C8.
[15]
Zong, X. G., Wang, J., Xu, W. G.
The Application of bridge survey technology in the tour survey in the plain
area of North Shandong province [J]. Journal
of China Hydrology, 2004, 24(3): 46?C50.
[16]
Zuo,
J., Deng, S., Zhang, H. X., et al. Representative study of surface velocity at Baihe Hydrological
Station [J]. Journal of China Hydrology,
2021, 41(3): 19?C24.
[17]
Strahler, A. N. Quantitative
analysis of watershed geomorphology [J]. Eos, Transactions
American Geophysical Union, 1957, 38(6): 913?C920.
[18]
Zhang, D. L. The temporal and
spatial variations of water resources over the Tibetan Plateau [D]. Lanzhou: Lanzhou
university, 2013.
[19]
Gao, M. F., Qiu, J. J.
Characteristics and distribution law of major natural disasters in Tibetan
Plateau [J]. Journal of Arid Land
Resources and Environment, 2011, 25(8): 101?C106.
[20]
Downing, J. A., Cole, J. J.,
Duarte, C. M., et al. Global
abundance and size distribution of streams and rivers [J]. Inland Waters, 2012, 2(4): 229?C236.
[21] Jain, S. C. Open-channel Flow [M]. Hoboken: John Wiley & Sons,
2000.