Global Population-weighted Carbon Emissions Dataset (0.1°×0.1°, 2014)
Fan, Z. X.1 Su, Y.1,2* Fang, X. Q.1,2
1. Faculty of Geographical Science, Beijing Normal University, Beijing 100875, China;
2. Key Laboratory of Environmental Change and Natural Disaster, Ministry of Education, P. R. China, Beijing Normal University, Beijing 100875, China
Abstract: Since mid of 20th century, anthropogenic greenhouse gas emissions have increased, it is very possible of being driven largely by economic and population growth, and causing the global warming. Based on the global carbon emissions data of 2014 in each country from CDIAC (Carbon Dioxide Information Analysis Center) and population density data in 2015 from SEDAC (Socioeconomic Data and Applications Center), the population based global carbon emissions dataset in 0.1° resolution (2014) was developed by the model of integrating population density as an economic-population composite indicator to weighted carbon emissions. The result shows the main carbon emission areas are located in the eastern United States, eastern China, Japan, Korea, India, Southeast Asia and Europe, and there are spatial differences in each region. The result can reflect spatial distribution of the current global carbon emissions and provide basic data for global change research. The dataset was archived in .tif data format with the data size of 22.7 MB (3.92 MB in compressed file).
Keywords: global; carbon emissions; population density weighted; spatial distribution; 0.1° resolution
1 Introduction
Anthropogenic greenhouse gas (GHG) emissions have increased since the pre-industrial era, driven largely by economic and population growth, and they are continuing to increase. The emissions have led to atmospheric concentrations of carbon dioxide, methane and nitrous oxide that are unprecedented in at least the last 800,000 years. Their effects, together with those of other anthropogenic drivers, have been detected throughout the climate system and they are extremely likely to be the dominant cause of the observed warming since the mid-20th century[1]. The current domestic and international research on carbon emissions is mainly conducted on a national scale; there are fewer smaller scale quantitative carbon emission studies. However, because regional economic development is uneven and population density is very variable in different countries or regions, differences in anthropogenic greenhouse gas emissions exist at less than a national scale. Therefore, we cannot treat a “country” as the smallest geographic unit of carbon emissions. To establish a more accurate spatial distribution pattern of global carbon emissions, we mapped carbon emission data to a unified small-scale geographic grid and transformed the carbon emission spatial distribution data from administrative boundaries to pixel based grid. This research has significance for the study of global warming attribution and the development of future emission reduction policies.
There is a close relationship between population (size and distribution) and GHG emissions. The elasticity coefficient of population-to-carbon dioxide emissions is between 1 and 1.65[3–5]. As the population increases, there is a concomitant increased demand for energy and changes in land use, both leading to an increase in GHG emissions[6]. The mapping of population density to small grids is a closer representation of the actual distribution of population compared to population density data set to arbitrary administrative units. Grid-based population mapping is an important way to improve the comprehensive management of population, resources and environment by combining population data with other socioeconomic statistics, resource and environmental data[7]. Therefore, in this study we treat population density as a comprehensive factor of economic activity and we calculate the current global carbon emission spatial distribution weighted by population density.
Based on global carbon emissions data for 2014 from the Carbon Dioxide Information Analysis Center (CDIAC); population density data for 2015 from the Socioeconomic Data and Applications Center (SEDAC), and using the spatial analysis tools of ArcGIS®, we calculate a more accurate spatial distribution of global carbon emissions than has been available previously. The resolution of the dataset is 0.1°×0.1°, and it can reflect the spatial distribution pattern of carbon emissions in different regions of the world (2014), as well as provide basic data for global change research.
2 Metadata of Dataset
The descriptions of the “Population Based Global Carbon Emissions Dataset in 0.1° Resolution (2014)”[8] dataset are summarized in Table 1. The information includes the full dataset name, short dataset name, geographical region, dataset creation year, dataset spatial and temporal resolution, dataset format and size, dataset publisher and sharing platform, and the data sharing policy.
3 Methods
3.1 The Data
Carbon emissions data describe the amount of carbon dioxide released from fossil fuels by 220 countries and regions worldwide according to the CDIAC of the US Government’s Oak Ridge National Laboratory (http://cdiac.ornl.gov/). The data year is 2014, and the resolution is by country and region (as defined by the CDIAC).
The population density data are grid data of global population density as released by the SEDAC of Columbia University (http://sedac.ciesin.columbia.edu/). The data year is 2015, and the data resolution is 0.05°×0.05°. The data covers all global land masses except Antarctica.
Table 1 Summary of the GlobalPopCarbonEmis2014 metadata
|
Items
|
Description
|
|
Dataset full name
|
Population based global carbon emissions dataset in 0.1° resolution (2014)
|
|
Dataset short name
|
GlobalPopCarbonEmis2014
|
|
Authors
|
Fan, Z. X. M-9949-2017, fanzhixin0213@mail.bnu.edu.cn
Su, Y. N-1155-2017, suyun@bnu.edu.cn
Fang, X. Q. A-3191-2017, xfang@bnu.edu.cn
|
Faculty of Geographical Science, Beijing Normal University
|
|
Geographical region
|
The region covers all global land masses except Antarctica
|
|
Time
|
2014
|
|
Temporal resolution
|
1 year Spatial resolution 0.1° × 0.1°
|
|
Data format
|
.tif
|
|
Dataset size
|
22.7 MB (3.9 MB in Compressed file)
|
|
Dataset
|
The dataset consists of one group of .tif files, which are the global carbon dioxide emissions data in 2014
|
|
Project funding
|
Ministry of Science and Technology of P. R. China (2016YFA0602704)
|
|
Data publisher
|
Global Change Research Data Publishing & Repository, http://www.geodoi.ac.cn
|
|
Address
|
No. 11A, Datun Road, Chaoyang District, Beijing 100101, China
|
|
Data sharing policy
|
Data from the Global Change Research Data Publishing & Repository includes metadata, datasets (data products), and publications (in this case, in the Journal of Global Change Data & Discovery). Data sharing policy includes: (1) Data are openly available and can be free downloaded via the Internet; (2) End users are encouraged to use Data subject to citation; (3) Users, who are by definition also value-added service providers, are welcome to redistribute Data subject to written permission from the GcdataPR Editorial Office and the issuance of a Data redistribution license; and (4) If Data are used to compile new datasets, the ‘ ten per cent principal’ should be followed such that Data records utilized should not surpass 10% of the new dataset content, while sources should be clearly noted in suitable places in the new dataset[9]
|
3.2 Methods of Processing
We weight the carbon emission data using population density data. Thus, we redistribute the raw total carbon emission data for each country or region using the grid of global population density and calculate a more accurate distribution pattern than exists with current presentations. The main calculations were for the carbon emission redistribution ratio and carbon emission spatial redistribution, defined as follows:
The carbon emission redistribution ratio for each grid cell equals the population in a single population density grid divided by the total population in all population density grids.
The carbon emission spatial redistribution equals the product of the carbon emission redistribution ratio and the regional total carbon emissions.
Figure 1 shows the flow chart of developing the dataset of global carbon emissions based on population density. The calculations were made in the following steps.
(1) Normalize carbon emission data and population data grids.
Make a 0.1°×0.1° grid template using the “Fishnet” in ArcGIS®. Combining the “To Raster” tools in ArcGIS®, the 2014 carbon emissions metadata for countries and regions are gridded. The world carbon emission data at a resolution of 0.1°×0.1° is obtained. Use the “Join & Relate” feature of the attribute table to distinguish the administrative boundaries of a country. Population density metadata are raster data of 0.05°×0.05°. Use the “Union” tool in ArcGIS® to merge them and then transform the world grid density data into 0.1°×0.1° grids.
(2) Calculate carbon emission data redistribution ratio.
First, count the population density of each country or region in the population density grid layer. Use the “Zonal Statistics” tool in ArcGIS®: The “Input raster or feature zone data” is set as a vector layer of the country (or region), “Zone field” is the column of attributes for a country or region, “Value raster” is the raw population density grid and “Statistics type” is chosen as “Sum”. The total population density calculated for each country or region provides the basis for subsequent calculation of the redistribution ratio.
|
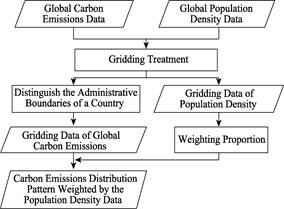
Figure 1 Flow chart of developing the global carbon emissions based on population density
|
Use the “Raster Calculator” to calculate the proportion of per population density grid in all population densities within countries or regions. According to Step (1), input the formula in the “Raster Calculator” window, and obtain the redistribution ratio of the total carbon emissions.
(3) Spatial redistribution of carbon emission data.
According to the redistribution ratio calculated based on Step (2), use the “Raster Calculator” tool to redistribute the country carbon emissions data again and obtain the carbon emissions distribution pattern weighed by the population density data.
4 Results
The GlobalPopCarbonEmis2014 dataset consist of one group of .tif file named GlobalPopCarbonEmis2014.tif. The data size is 22.7 MB (3.92 MB in compressed). In this file, the carbon emission value in each grid of 0.1°×0.1° ranges from 0 to 8,000 Gg C. Values are displayed using the class-break renderer method. According to the distribution of data, different data intervals are used at different classification intervals. The range of values is divided into 18 classes: 0 (null value), 0-1, 1-2, 2-3, 3-4, 4-5, 5-10, 10-15, 15-20, 20-40, 40-60, 60-80, 80-100, 100-500, 500-1,500, 1,500-3,500, 3,500-6,500, and 6,500-8,000 (Figure 2 to Figure 5). The result shows the proportion of those regions were about 61%, where the carbon emission was between 0 and 1 Gg C in each grid of 0.1°×0.1° (Figure 2). Spatially, in 2014, the main regions where the carbon emission value was much higher include eastern North America, Europe, Eastern and Southern of Asia and there are obvious spatial differences in these regions (Figure 3, figure 5). In 2014, the mean carbon emission of the global land mass was 6.21 Gg C in each grid cell. The proportion of grid cells with values below this average is 88%; while 12% of grid cells have values above the average (Figure 4).

Figure 2 The proportion of carbon emissions

Figure 3 The spatial distribution of global carbon emission
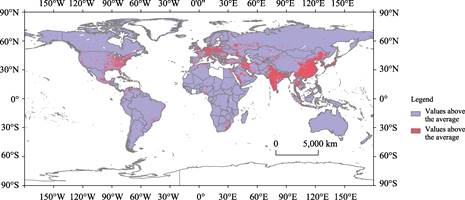
Figure 4 The spatial distribution of different carbon emissions
5 Discussion and Conclusion
Representing carbon emissions on a country scale as the geographical unit does not take into
account the impact of regional economy on carbon emissions. Therefore, in this paper,
population density is used as an integrated economic-population index in order to calculate carbon emissions at a much smaller scale. Based on the carbon emission data (2014) and population density data (2015), and using the spatial analyst tools in ArcGIS®, we calculate the spatial distribution pattern of global carbon emissions based on the population density. The results show that the main areas of global carbon emissions are the eastern North America, Europe, eastern and southern of Asia, but there are spatial differences within these regions. The dataset can provide basic data and a scientific basis for studying global
warming attribution and emission reduction policies.
However, the dataset considers only the influence of population density on the weight of the spatial distribution of carbon emissions and uses population density as the economic-population comprehensive index for the weighting calculation. There remain some imperfections in this approach. In addition to population density, the age structure of population[10], consumer behavior[11], urbanization development level[12] and other aspects have an impact on carbon emissions. In future research, we will gradually improve the carbon emission spatial distribution scenarios under the combined influence of multiple factors.

Figure 5 The spatial distribution of carbon emissions in different regions
References
[1] Climate Change 2014: Synthesis Report. Contribution of Working Groups I, II and III to the Fifth Assessment Report of the Intergovernmental Panel on Climate Change [M]. Core Writing Team, Pachauri, R. K., Meyer, L. A. (eds). IPCC, Geneva, Switzerland, 2014: 151.
[2] Tong, X., Li, X. S. Literature review of regional carbon emission and emission reduction path [J]. Inquiry into Economic Issues, 2017 (1): 169-176.
[3] Dietz, T.??Rosa, E. A??Effects of population and affluence on CO2 emissions [J]. Proceedings of the National Academy of Sciences, 1997, 94(1): 175-179.
[4] York, R., Rosa, E. A., Dieta, T. STIPAT, PAT and IMPACT: analytic tools forum packing the driving forces of environment impacts [J]. Ecological Economics, 2003, 46(3):351-365.
[5] Shi, A. The impact of population pressure on global carbon dioxide emissions, 1975-1996: evidence from pooled cross country data [J]. Ecological Economics, 2003, 44(1): 29-42.
[6] Birdsall, N. Another look at population and global warming: population, health and nutrition policy research [C]. Washington D. C.: World Bank, WPS 1020, 1992.
[7] Zhuo, L., Chen, J., Shi, P. J., et al. Modeling population density of China in 1998 based on DMSP/OLS nighttime light image [J]. Acta Geographica Sinica, 2005, 60(2): 266-276.
[8] Fan, Z. X., Su, Y., Fang, X. Q. Population based global carbon emissions dataset in 0.1° resolution (2014) [DB/OL]. Global Change Research Data Publishing & Repository, 2017. DOI: 10.3974/geodb.2017.03.12.V1.
[9] GCdataPR Editorial Office. GCdataPR Data Sharing Policy [OL]. DOI: 10.3974/dp.policy.2014.05 (Updataed 2017).
[10] Dalton, M., O’Neill, B., Prskawetz, A., et al. Population aging and future carbon emissions in the United States [J]. Energy Economics, 2008, 30: 642-675.
[11] Schipper, L., Bartlett, S., Hawk, D., et al. Linking life-styles and energy use: a matter of time? [J]. Annual Review of Energy, 1989, 14: 271-320.
[12] Lu, Z. D. Impact of urbanization on carbon dioxide emissions in China [J]. Forum on Science and
Technology in China, 2011 (7): 134-140.