Development
of Gridded Dataset of Extreme Temperature Index in China Based on ETCCDI
Chen, Q. Y.1,2 Zhang, Y.1,2* Liu, X. Y.2,3 Lian, Q. L.2,3 Xu, J. J.1,4
1. South China Sea Institute of Marine Meteorology, Guangdong Ocean
University, Zhanjiang 524088, China;
2. Laboratory for coastal Ocean Variation
and Disaster Prediction, College of Ocean and Meteorology, Guangdong
Ocean University, Zhanjiang 524088, China;
3. Key Laboratory of Climate, Resources and Environment in
Continental Shelf Sea and Deep Sea, Guangdong Ocean University, Zhanjiang
524088, China;
4. Shenzhen Institute of Guangdong Ocean University, Shenzhen
518120, China
Abstract:
Extreme weather and climatic events are occurring frequently
in the context of global warming. To unify the definitions of extreme climate
events in different countries and regions, the World Meteorological
Organization (WMO) established the Expert Group on Climate Change Detection and
Index (ETCCDI), which provides 26 representative extreme temperature and
precipitation indices to regulate research on global extreme climate events.
This study used the Dataset of daily values of basic meteorological elements of
national surface meteorological stations in China (V3.0) to calculate 16
extreme temperature indices defined by ETCCDI in the Chinese region, including
the hottest day (TXx), coldest day (TXn), warmest night (TNx), coldest night
(TNn), warm days (TX90p), cool days (TX10p), warm nights (TN90p), cool nights
(TN10p), summer days (SU), tropical
nights (TR), ice days (ID), frost days (FD), warm spell duration index (WSDI),
cold spell duration index (CSDI), diurnal temperature range (DTR), and growing
season length (GSL). For the convenience of researchers in different
disciplinary fields, this study adopted the angular distance weighting (ADW) method
to interpolate station data into a spatial resolution of 0.25????0.25?? longitude
and latitude grid, stored in .NetCDF format from 1961 to 2020 and with an
annual or monthly temporal resolution. The total data amount was 1.43 GB,
compressed to 353.0 MB. This dataset was named SimmEX_1961-2020_1.0. In
addition to providing data support for the study of various extreme temperature
event characteristics, it also has broad application prospects in the fields of
the environment, economy, and energy.
Keywords: climate change; ETCCDI; extreme climate
index; SimmEX
DOI: https://doi.org/10.3974/geodp.2024.01.08
CSTR: https://cstr.escience.org.cn/CSTR:20146.14.2024.01.08
Dataset Availability Statement:
The
dataset supporting this paper was published and is accessible through the Digital
Journal of Global Change Data Repository at: https://doi.org/10.3974/geodb.2024.05.06.V1
or https://cstr.escience.org.cn/CSTR:20146.11.2024.05.06.V1.
1 Introduction
The
IPCC AR6[1] shows that, in the context of global warming, the
frequency and intensity of extreme weather and climate events, such as extreme
heat events, heavy rainfall, and droughts, are increasing globally. This is
having a serious impact on the development of human societies[2] and
the balance of ecosystems[3]. Recognizing the characteristics of
these extreme events and formulating scientific responses to them are of great
significance for disaster prevention and reduction. An extreme climate index
dataset with high spatial and temporal coverage and resolution was the basis
for the above research. Although many scholars and institutions have produced
extreme climate index datasets, such as Wang et al.[4], who calculated the extreme temperature index
in the coastal areas of China, and Ma et
al.[5] and Zhou et al.[6],
who produced extreme precipitation datasets for the Tibetan Plateau and Wei
River Basin, respectively. These datasets have played an important role in
local or regional research. However, to study the entire region of China, the
spatial coverage of the dataset must be expanded further. The US National
Aeronautics and Space Administration and UK Met Office??s Hadley Center launched
their own global extreme climate index products, M2SMNXEDI and HadEX,
respectively. Although they cover the entire Chinese region, these extreme
index products were created using fewer original observation stations
(approximately 400?C500 stations) and have lower spatial resolution
(1.25????1.875??)[7], which limits their reliability and applicability.
In order to obtain a
high-spatiotemporal-resolution dataset of extreme temperature indices in China,
we first utilized the Python programming language and the daily maximum
(minimum) temperature and average temperature of 2,481
ground meteorological stations provided by the National Meteorological
Information Center of the China Meteorological Administration to calculate 16
extreme temperature indices (Table 1) specified by the
Expert Team on Climate Change Detection and Indices (ETCCDI). Then, a grid
dataset of extreme temperature indices in China from 1961 to 2020 was generated
using the angular distance
Table 1 16 extreme temperature indices
|
Index
|
Name
|
Definition
|
Unit
|
|
TXx
|
Hottest day
|
Annual/monthly
maximum value of TX (daily maximum temperature)
|
??
|
|
TXn
|
Coldest day
|
Annual/monthly
minimum value of TX
|
??
|
|
TNx
|
Warmest night
|
Annual/monthly
maximum value of TN (daily minimum temperature)
|
??
|
|
TNn
|
Coldest night
|
Annual/monthly
minimum value of TN
|
??
|
|
TX90p
|
Warm days
|
Annual/monthly
percentage of days when TX > 90th percentile
|
%
|
|
TX10p
|
Cool days
|
Annual/monthly
percentage of days when TX < 10th percentile
|
%
|
|
TN90p
|
Warm nights
|
Annual/monthly
percentage of days when TN> 90th percentile
|
%
|
|
TN10p
|
Cool nights
|
Annual/monthly
percentage of days when TN < 10th percentile
|
%
|
|
SU
|
Summer days
|
Annual/monthly
count of days when TX > 25 ??
|
day
|
|
TR
|
Tropical nights
|
Annual/monthly
count of days when TN > 20 ??
|
day
|
|
ID
|
Ice days
|
Annual/monthly
count of days when TX < 0 ??
|
day
|
|
FD
|
Frost days
|
Annual/monthly
count of days when TN < 0 ??
|
day
|
|
WSDI
|
Warm spell
duration index
|
Annual count of days with at least six consecutive days when TX >
90th percentile
|
day
|
|
CSDI
|
Cold spell
duration index
|
Annual count of days with at least six consecutive days when TN <
10th percentile
|
day
|
|
DTR
|
Diurnal
temperature range
|
Annual/monthly
mean difference between TX and TN
|
??
|
|
GSL
|
Growing season
length
|
Annual count
between first span of at least 6 days with TG (daily mean temperature) >5
?? and first span after July 1st of 6 days with TG < 5 ??
|
day
|
weighting (ADW) method. The dataset, named SimmEX_1961-2020_1.0 and abbreviated as
SimmEX, was created by the Extreme Climate
Research Group of the South China Sea Institute of Marine Meteorology of
Guangdong Ocean University (GDOU-SIMM). The dataset provides fundamental data
support for the study of extreme temperature events across China or at finer
spatiotemporal scales, which will help to enhance people??s understanding of
extreme temperature events. Meanwhile, it also has significant applications in
climate modeling and scientific responses to climate change in the fields of the
environment, economy, and energy.
2 Metadata of the Dataset
The
metadata of the Grid dataset of extreme temperature index in China (1961?C2020)
(V1.0)[8] dataset is summarized in Table 2. It includes the dataset
full name, short name, authors, year of the dataset, temporal resolution,
spatial resolution, data format, data size, data files, data publisher, and
data sharing policy, etc.
Table 2 Metadata summary of Grid dataset of
extreme temperature index in China (1961?C2020) (V1.0)
|
Items
|
Description
|
|
Dataset full
name
|
Grid dataset of
extreme temperature index in China (1961?C2020) (V1.0)
|
|
Dataset short
name
|
SimmEX_1961-2020_1.0
|
|
Authors
|
Chen, Q. Y.,
South China Sea Institute of Marine Meteorology, Guangdong Ocean University,
chenqiuyuan@stu.gdou.edu.cn
Zhang, Y., South
China Sea Institute of Marine Meteorology, Guangdong Ocean University,
zhangyu@gdou.edu.cn
Liu, X. Y.,
South China Sea Institute of Marine Meteorology, Guangdong Ocean University,
liuxiaoyu@stu.gdou.edu.cn
Lian, Q. L.,
South China Sea Institute of Marine Meteorology, Guangdong Ocean University,
lianqinlai@stu.gdou.edu.cn
Xu, J. J., South
China Sea Institute of Marine Meteorology, Guangdong Ocean University,
jxu@gdou.edu.cn
|
|
Geographical
region
|
China (excluding
territorial waters)
|
|
Year
|
1961?C2020
|
|
Temporal
resolution
|
Annual, monthly
|
|
Spatial
resolution
|
0.25????0.25??
|
|
Data format
|
.NetCDF
|
|
|
|
Data size
|
1.43 GB (353.0 MB
after compression)
|
|
|
|
Data files
|
29 .NetCDF files
in total, 16 (13) of which have a time resolution of annual (monthly)
|
|
Foundations
|
National Nature Science Foundation of
China (72293604, 42130605); Shenzhen Science and Technology Plan (JCYJ20210324131810029)
|
|
Data publisher
|
Global Change Research Data Publishing & Repository,
http://www.geodoi.ac.cn
|
|
Address
|
No. 11A, Datun
Road, Chaoyang District, Beijing 100101, China
|
|
Data sharing
policy
|
(1) Data are openly available and can be
free downloaded via the Internet; (2) End users are encouraged to use Data subject to citation; (3) Users,
who are by definition also value-added service providers, are welcome to
redistribute Data subject to
written permission from the GCdataPR Editorial Office and the issuance of a Data redistribution license; and (4)
If Data are used to compile new
datasets, the ??ten percent principal?? should be followed such that Data records utilized should not
surpass 10% of the new dataset contents, while sources should be clearly
noted in suitable places in the new dataset[9]
|
|
Communication
and searchable system
|
DOI, CSTR, Crossref, DCI, CSCD, CNKI,
SciEngine, WDS/ISC, GEOSS
|
3 Methods
3.1 Data Collection
The foundational
meteorological data for the development of this dataset were obtained from the
Dataset of daily values of basic meteorological elements of national surface
meteorological stations in China (V3.0), produced by the National
Meteorological Information Center of the China Meteorological Administration.
It includes daily maximum, minimum, and average temperature data from 2,481
national-level ground observation stations across the country. The establishment
and production processes of this dataset have undergone rigorous quality
control, and corrections have been made to existing errors to ensure a high
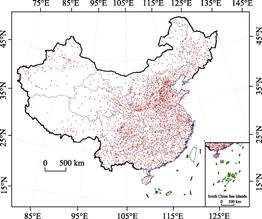
degree of credibility. The specific station distribution is shown in Figure 1.
3.2 Interpolation Method
|
Figure
1 Spatial
distribution of meteorological stations in the original dataset
|
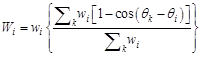
ADW is a method for interpolating discrete
irregular station data into grid data in a certain space using a certain
mathematical relationship. This method comprehensively considers the distance
and azimuth relationship between stations and regular grid points and can
achieve a better interpolation effect. Dunn[10] created the HadEX3
dataset using this method. The specific formula is as follows: equation 1
refers to the grid point as the center, the correlation between the surrounding
stations and the index value at this grid point presents an e-exponential
decay, where x is the distance between the station and grid point, and x0
is the search radius. In equation 2, wi is the distance
weight of each station and m is used to adjust the attenuation rate. In
equation 3, the azimuth and distance are comprehensively considered, and Wi
is the angular distance weight, where  is the azimuth of
the station relative to the grid point and k is
the number of stations within the search range. Since 1961, most meteorological stations
have been relocated owing to changes in the underlying surface and surrounding
environment, especially during the 20 years from 1961 to 1980, and the number
of stations has increased rapidly. Therefore, the weight calculation of each
station at each grid point was divided into five periods, 1961?C1965, 1966?C1970,
1971?C1975, 1976?C1980, and 1981?C2020, which not only considered the weight change
but also made the interpolation calculation efficient. This study used the
Python programming language to calculate equations 1?C3. First, the azimuth
angle and distance between the station and the grid point are calculated
through the custom function, that is, x in equation 1 and in equation 3 are
obtained, and then equations 1?C3 are written to establish the angular distance
weighting interpolation method.
is the azimuth of
the station relative to the grid point and k is
the number of stations within the search range. Since 1961, most meteorological stations
have been relocated owing to changes in the underlying surface and surrounding
environment, especially during the 20 years from 1961 to 1980, and the number
of stations has increased rapidly. Therefore, the weight calculation of each
station at each grid point was divided into five periods, 1961?C1965, 1966?C1970,
1971?C1975, 1976?C1980, and 1981?C2020, which not only considered the weight change
but also made the interpolation calculation efficient. This study used the
Python programming language to calculate equations 1?C3. First, the azimuth
angle and distance between the station and the grid point are calculated
through the custom function, that is, x in equation 1 and in equation 3 are
obtained, and then equations 1?C3 are written to establish the angular distance
weighting interpolation method.
 (1)
(1)
 (2)
(2)
 ,
,  ??
?? (3)
(3)
3.3 Methodolgy
The
establishment process of the Chinese extreme temperature index grid dataset is
presented in Figure 2 and mainly includes four
parts: pre-processing of the basic dataset, calculation of the 16 indices for the
stations, interpolation to the latitude and longitude grid points, and output
of the file.
(1) First, Python
is used to perform data preprocessing on the Dataset of daily values
of basic meteorological elements of national surface meteorological stations in
China (V3.0). This included the positioning of station
latitudes and longitudes, and conversion of data units, resulting in daily
temperature data for 2481 stations in China from 1961 to 2020.
(2) Among the 16
extreme temperature indices, the calculation of TX90p, TN90p, TX10p, TN10p,
WSDI, and CSDI, a total of six indices, required their relative thresholds to
be determined. This was achieved using the percentile threshold method to
calculate the climatological state thresholds for the period of 1961?C1990,
while also excluding stations with more than 5% missing data. Subsequently,
Python was utilized to calculate the 16 extreme temperature indices and obtain
the calculation results for the stations. Considering the specific definitions
of these indices, the temporal resolutions of the GSL, WSDI, and CSDI are only
yearly, not monthly.
(3) ADW was used
to interpolate and obtain the calculation results of the stations to the
latitude and longitude grid points.
(4) According to the geographical scope of China,
data masking was conducted, retaining only the data of the Chinese region
(excluding territorial waters) and replacing the interpolation results of the
remaining areas with missing measurement values. Python was used to input the
dataset information (dataset name, creator, spatiotemporal resolution, etc.)
and index information (index definition, units, etc.) for each file, specifying
the data accuracy and missing data markers. Finally, the file was saved to
generate the SimmEX dataset.
Figure 2 Flowchart
of the technical process of SimmEX production
4 Data Results and Validation
4.1 Data Composition
The
compressed package contained two folders, ANN and MON, storing 16 annual and 13
monthly indices, respectively. Each file was in .NetCDF format and named
SimmEX_xx_ANN or SimmEX_xx_MON, where xx is the index code (Table 3).
Table 3 Dataset
compositionand
description
|
Folder name
|
Nomenclature
|
Flie
introduction
|
File record
|
File format
|
Single file
size
|
|
ANN
|
SimmEX_????_ANN
|
Annual ???? index
|
16
|
.NetCDF
|
About 8.57 MB
|
|
MON
|
SimmEX_????_MON
|
Monthly ???? index
|
13
|
.NetCDF
|
About 102.72 MB
|
|
|
|
|
|
|
|
4.2 Data Results
and Validation
Figure 3 takes the four indices of TXx, TX90p, SU, and WSDI as examples
to show the results comparing the SimmEX and HadEX3 datasets of the Hadley
Center in the United Kingdom. The spatial resolution of SimmEX is 0.25????0.25??,
whereas that of HadEX3 is 1.25????1.875??. As can be seen from the spatial
distribution of the climate states of these four indices, the TXx values
(Figure 3a and 3b) of the two datasets were pathologically presented as low
regions in Qinghai, Tibet, and western Sichuan and high regions in other
regions. The TX90p values in the SimmEX dataset (Figure 3c) were smaller
overall than those in the HadEX3 dataset (Figure 3d). SU (Figure 3e and 3f)
showed low values in South China and
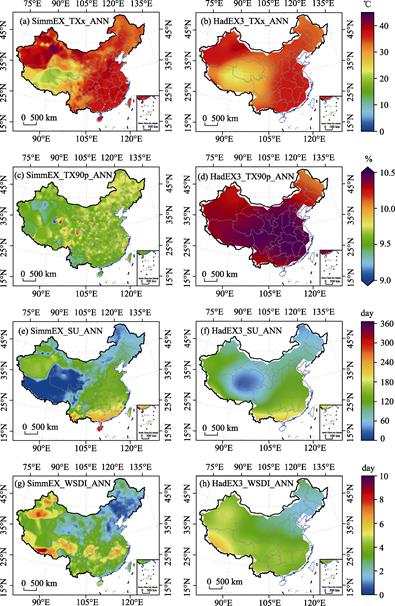
Figure 3
Climatological
distribution maps (1961?C1990) of TXn (a), TX10p (b), TR (c), and CSDI (d) in SimmEX and
HadEX3
high values in North China, while WSDI
(Figure 3g and 3h) showed low values in Northeast China and high values in West
China. It should be noted that the SimmEX dataset has a higher spatial
resolution; therefore, it reflects more refined distribution characteristics.
For example, the SimmEX WSDI presented high-value centers in small areas, such
as Xinjiang, Tibet, Sichuan, and East China. However, the lower-resolution
HadEX3 dataset could not reflect the fine-grained structural features at this
small scale.
Figure 4 shows the interannual changes in
TXx, TX90p, SU, and WSDI for the SimmEX and HadEX3 datasets. The comparison
indicated that the four indices of the two datasets, in terms of interannual
changes, the year with high and low values, and the changing trend,
corresponded relatively well, with good consistency, especially TXx, TX90p, and
WSDI (Figure 4a, b, and d), and the difference between the two sets of data is
small. The SU index of the two datasets (Figure 4c) was the most different;
SimmEX was lower than HadEX3 overall, but the interannual variation was
consistent. In addition, the TNx, TNn, SU, TR, DTR, GSL, and other indices of
the two datasets were also high or low, and there were certain differences that
are not shown. In general, the indices of the two datasets were the same in
terms of interannual variation, but there were different degrees of global
deviation in the different indices. Although SimmEX and HadEX3 use the same
definition for calculations and the same spatial interpolation method, SimmEX
uses more original station data and denser spatial coverage, which is the main
reason for the differences between the two datasets.
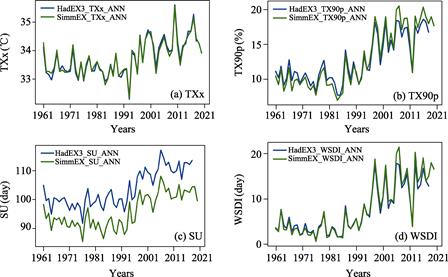
Figure 4 Interannual
variations in TXx (a), TX90p (b), SU (c), and WSDI (d) in SimmEX and HadEX3
Figures 3 and 4 compare and analyze the
spatial distribution and interannual variation differences of various indices
in the SimmEX and HadEX3 datasets. We now scientifically evaluate the quality
of the two datasets using statistics. The specific practices are as follows:
each index of the two datasets was interpolated to 2,481 stations, and the
root-mean-square error (RMSE) was used as the objective evaluation standard.
The formula is given in Equation 4, where  is the value of
the data in the dataset interpolated to the stations,
is the value of
the data in the dataset interpolated to the stations,  is the observed
value of the stations, and
is the observed
value of the stations, and  is the number of
files.
is the number of
files.
 (4)
(4)
Figures 5a and 5b show the evaluation results
of the middle-age index data in the ANN folder. The figure shows that the
average RMSE values of TXx, TXn, TNx, and TNn in SimmEX were approximately 2 ??
lower than that of HadEX3. The average RMSE of TX90p, TX10p, TN90p, and TN10p
in SimmEX were approximately 2% lower than those in HadEX3. The average RMSE
values of the five indices in SimmEX, including ID, FD, SU, TR, and GSL, were
10?C25 d lower than those in HadEX3. The average RMSE values of WSDI and CSDI in
SimmEX were 1?C2 days lower than those in HadEX3. Additionally, the RMSE
volatility of each index in SimmEX was smaller than that in HadEX3, indicating
that it was more stable than HadEX3.
Figure 5c presents the evaluation results of
the monthly index data for the MON folder. The figure shows that the average
RMSE values of TXx, TXn, TNx, and TNn in SimmEX were approximately 2 ?? lower
than those in HadEX3. The average RMSE levels of TX90p, TX10p, TN90p, and TN10p
in SimmEX were 2%?C4% lower than those in HadEX3. The average RMSE levels of FD,
SU, and TR in SimmEX were 1?C2 days lower than those in HadEX3. The RMSE of each
index in SimmEX was less volatile than that in HadEX3. Each index in the SimmEX
dataset outperformed that in the HadEX3 dataset.
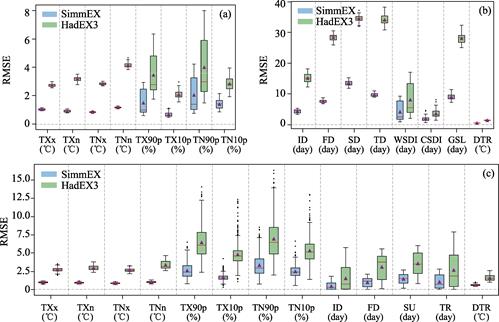
Figure 5
RMSE
of each index in SimmEX and HadEX3, where (a) and (b) are annual files and (c)
presents monthly files
5 Discussion and Conclusion
Based
on the dataset of
daily values of basic meteorological elements of national surface
meteorological stations in China (V3.0) and the Python
programming language, 16 extreme temperature indices from 2,481 stations in
China were calculated according to the international standard definition
provided by ETCCDI. A gridded SimmEX extreme temperature index dataset was
generated by interpolating the station data to longitude and latitude grid
points using the ADW interpolation method. Through evaluation, it was found
that the dataset quality was greatly improved compared with HadEX3. However,
the following issues should be noted when using this dataset. Owing to the
small number of stations in Western China, their distribution was sparser than
that in Eastern China, so the reliability of data for Eastern China was higher
than that of data for Western China. In particular, in the western Tibetan
Plateau with sparse stations and complex topography, the data in this region
were extrapolated and their reliability should to be considered; therefore, it
is recommended to use it as appropriate. In the future, based on station data,
we will integrate satellite remote sensing, reanalysis, and other multi-source
data as basic data to compensate for the poor quality of this dataset in areas
with sparse stations, such as western China.
Author Contributions
Chen,
Q. Y. completed the calculation and processing of the dataset, and wrote the
paper; Zhang, Y. provided the overall idea of dataset development and reviewed
and revised the paper; Liu, X. Y. wrote the Python script of angular distance
weighting method and corrected the paper. Lian, Q. L. helped improve the
calculation script, to improve the efficiency of index calculation; Xu, J. J.
provided the idea for the construction of the dataset.
Conflicts
of Interest
The authors
declare no conflicts of interest.
References
[1]
IPCC. Climate Change 2021: the Physical Science Basis [M/OL].
Cambridge: Cambridge University Press, 2021 [2024-05-08]. https://www.ipcc.ch/report/ar6/wg1/downloads/report/IPCC_AR6_WGI_Full_
Report.pdf.
[2]
Wu, S. H., Yin, Y. H. Impacts of climate extremes on human
systems [J]. Climate Change Research,
2012, 8(2): 99-102.
[3]
Piao, S. L., Zhang, X. P., Chen, A. P., et al. The
impacts of climate extremes on the terrestrial carbon cycle: A review [J]. Science China Earth Sciences, 2019(49):
1321-1334.
[4]
Wang, X. L., Hou, X. Y. Raster dataset of extreme temperature
in the coastal area of China [J]. Journal
of Global Change Data & Discovery,
2019, 3(1): 54-58.
[5]
Ma, W. D., Liu, F. G., Zhou, Q., et al. Development of extreme
precipitation dataset of Qinghai-Tibet Plateau (1961?C2017) [J]. Journal of Global Change Data & Discovery, 2021, 5(1): 67-72.
[6]
Zhou, Q., Zhang, H. N., Ren, Y. X. Methodology of dataset
development on extreme precipitation indexes in Weihe River Basin (1961?C2016)
[J]. Journal of Global Change Data & Discovery, 2021, 5(1): 62-66.
[7]
Caesar, J., Alexander, L., Vose, R. Large-scale changes in
observed daily maximum and minimum temperatures: Creation and analysis of a new
gridded data set [J]. Journal of
Geophysical Research: Atmospheres, 2006, 111(D5): D05101.
[8]
Chen, Q. Y., Zhang, Y., Liu, X. Y., et al. Grid dataset of
extreme temperature index in China (1961?C2020) (V1.0) [J/DB/OL]. Digital Journal of Global Change Data
Repository, 2024. https://doi.org/10.3974/geodb.2024.05.06.V1.
https://cstr.escience.org.cn/CSTR:20146.11.2024.05.06.V1.
[9]
GCdataPR Editorial Office. GCdataPR data sharing policy [OL].
https://doi.org/10.3974/dp.policy.2014.05 (Updated 2017).
[10]
Dunn, R. J. H., Alexander, L. V., Donat, M. G., et al.
Development of an updated global land in situ-based dataset of temperature and
precipitation extremes: HadEX3 [J]. Journal
of Geophysical Research: Atmospheres,
2020, 125(16): e2019JD032263.