A Multi-dimensional Data Format (MDD) and Analysis Tool
Zhang, L. F.1 Sun, X. J.1* Zhang, X.1 Wang, N.1 Zhang, M. Y.1,2
Lin, Y. K.1,2 Huang, H.1 Cen, Y.1 Huang, C. P.1 Yang, H.1
Zhang, H. M.1 Liu, J.1 Tong, Q. X.1
1. Institute of Remote Sensing and Digital Earth, Chinese Academy of Sciences, Beijing 100101, China;
2. University of Chinese Academy of Sciences, Beijing 100049, China
Abstract: Earth observation remote sensing data can provide a wealth of information regarding the earth objects, including spatial, temporal, spectral, scale, as well as attribute features. It is difficult to be interactive operated and inter-data analyzed, if these features or information derived from remotely sensed data are separately stored in different data formats or files. In meeting the need in the big data environment, a multi-dimensional dataset (MDD) format was developed for providing a mode both for time series of remote sensing and Geographical Information System data. The spatio-temporal-spectral information contained in remote sensing data was systematically organized in the MDD data format, which consisted of five parts: Temporal Sequential in Band (TSB), Temporal Sequential in Pixel (TSP), Temporal Interleaved by Band (TIB), Temporal Interleaved by Pixel (TIP), and Temporal Interleaved by Spectrum (TIS). A corresponding operational software tool was developed for the MDD formatted data, enabling data generation/organization, reading, storing, interactive analyses, and format conversion.
Keywords: MDD; data format; multi-dimensional data; data analysis; MARS
1 Introduction
Remote sensing data is one of the most important resources in studies of global change; the Landsat Thematic Mapper (TM) and the MODerate-resolution Imaging Spectroradiometer (MODIS) have become the most widely used remote sensing data. Time series remote sen-
sing data have been widely used in the global change studies, including monitoring forest disturbance/recovery[1], automatic reconstruction of forest historical data[2], quantitative analysis of forest biomass variations[3], and monitoring land cover changes[4–5]. MODIS long time series data have been used for crop phenology monitoring[6–7] and in other applications.
We have hereby developed a multi-dimensional data format referred to as a multi-
dimensional data format (MDD) based on the multi-temporal, multi-spatial, and multi-spectral features of remote sensing data. According to the order in which the multi-dimensional data is stored, the MDD includes five basic data storage formats: Temporal Sequential in Band (TSB), Temporal Sequential in Pixel (TSP), Temporal Interleaved by Band (TIB), Temporal Interleaved by Pixel (TIP), and Temporal Interleaved by Spectrum (TIS). In order to access the MDD data, a multi-dimensional data analysis tool (MDA) was developed to simplify the reading, organizing, and analysis of the multi-dimensional remote sensing and geo-spatial data.
2 MDD Data Format
MDD is a multi-dimensional data format that can integrate the temporal, spatial, and spectral features of remote sensing data. Generally, remote sensing data have a data cube architecture; for example, an “hdr” file, includes three dimensions (3D), i.e., spatial (two-dimensional, 2D) and spectral (one-dimensional, 1D) information. Moreover, the MDD file has a multi-phase data cube architecture. Therefore, compared with traditional remote-sensed data, the MDD file has four dimensions at least, i.e., temporal (1D), spatial (2D), and spectral (1D). If
necessary, a MDD file can be extended to five or even more dimensions, i.e., temporal (1D), spatial (3D), and spectral (1D or more)
2.1 Characteristics of the MDD Data Format
The characteristics of the MDD data format are as follows:
Flexibility: Five storage structures are available for the multi-dimensional image data and can be converted to each other. Any data structure can be selected according to the data analysis required.
Multi-dimensionality: The MDD has a multi-dimensional format that allows users to integrate the spatial-temporal-spectral information into one dataset.
Extendibility: It is easy to realize the expansion of the time dimension. For example, newly acquired image data can be added to the generated MDD file according to the operator’s needs.
Integrity: In addition to the raster image data, the MDD also includes comprehensive attribute information, such as time, size, geographical projection, and other features.
2.2 Physical Storage Structure of the MDD
The MDD has two files: a header file and a data file.
The header file records information regarding the image data itself as well as descriptive information. It includes the size of each dimension, interleave, and data type. The data file includes the coordinate projection, affine transform coefficients, file name, file type, and data offset values. Data files are actually stored image data files, and are divided into five data storage structures (TSB, TSP, TIB, TIP and TIS) according to the storage order of the data.
2.2.1 MDD Header File
The MDD header file records all metadata information used to express and read the image data file, as shown in Table 1.
Table 1 Definition of the fields in the header file
|
Field
|
Definition
|
|
Samples
|
The number of samples (pixels) per image line for each band
|
|
Lines
|
The number of lines per image for each band
|
|
Bands
|
The number of bands per image file
|
|
Time
|
The number of phases per image file
|
|
Header Offset
|
Offset values for each band. When a file is read, these bytes are skipped
|
|
File Type
|
The MDD-defined file type, e.g., MDD Standard
|
|
Data Type
|
The type of data representation: 1 = 8-bit byte, 2 =16-bit signed integer, 3 = 32-bit signed long integer, 4 = 32-bit floating point, 5 = 64-bit double-precision floating point, 6 = 2 × 32-bit complex, real-imaginary pair of double precision, 9 = 2 × 64-bit double-precision complex, real-imaginary pair of double precision, 12 =16-bit unsigned integer, 13 = 32-bit unsigned long integer, 14 = 64-bit signed long integer, 15 = 64-bit unsigned long integer
|
|
Interleave
|
Refers to whether the data are TSB, TSP, TIB, TIP, or TIS
|
|
Sensor Type
|
The type or name of sensor, e.g., Landsat TM, SPOT, MODIS, etc
|
|
Byte Order
|
The order of the bytes in an integer, long integer, 64-bit integer, unsigned 64-bit integer, floating point, double-precision, and complex data types. One of the following is used:
Byte order = 0 (Host (Intel) in the Header Info dialog) is least significant byte first (LSF) data (DEC and MS-DOS systems)
Byte order = 1 (Network (IEEE) in the Header Info dialog) is most significant byte first (MSF) data (all other platforms)
|
|
Map Info
|
Lists geographic coordinate information in the order of projection name (UTM), reference pixel x location (in file coordinates), pixel y, pixel easting, pixel northing, x pixel size, y pixel size, projection zone, and north or south (UTM only)
In MDD, pixel values always refer to the upper-left corner of the pixel. Map coordinates also typically refer to the upper-left corner of the pixel
|
|
Coordinate
System String
|
A coordinate system string field to the header file. It lists the parameters used for a geographic coordinate system or projected coordinate system
|
|
Band Names
|
Specific names for each band of an image
|
|
Time Names
|
Specific names for each phase of an image
|
2.2.2 MDD Data File
|

Figure 1 Temporal Sequential in Band (TSB)
data format structure
|
The MDD data file stores the image data. The raster image data can be stored in one of the TSB, TSP, TIB, TIP, or TIS storage structures and as with the binary data stream, the five data structures can be converted to each other.
(1) TSB data format
Assuming that the multi-temporal remote sensing dataset contains images of the T1, T2, and T3 phases, each phase contains three bands and each band contains four pixels (represented by four small boxes), as shown in Figure 1. The order in which the small squares are arranged represents the order in which all the cells are stored in the TSB format. The dataset contains the temporal dimension, the spectral dimension, and the spatial “row” and “column” dimensions.
The TSB storage format first stores the pixel data of the first time phase, T1, in the order of the first column, and then sequentially stores the pixel data of each band of T1, and finally categorizes all the time cube data according to the above rules Sequential storage is applied, with the storage structure expressed as:
 (1)
(1)
where, FTSB(t) represents the cube dataset for each time. Equation (1) indicates that the data storage facility stores the image cubes for different times in the order of time T, and stores the image cube in the order of the bands in each cube’s image data, which can be expressed as:
 (2)
(2)
For each band, storage is applied in ascending order, and is expressed as:
 (3)
(3)
The TSB format organizes all the band data for each time, is applied to data for several bands at a time, and enables processing of the bands in the spatial dimension. To extract spectral cube data, spectral operations and spatial domain filtering applications, consisting of all bands at one or more times, can be organized in the TSB data format.
Table 2 The meaning of expressions and variables in formulas 1-12
|
Expression or Variable
|
Description
|
|
t
|
A certain time, range of values [1, T]
|
|
S
|
A spectral band, range of values [1, S]
|
|
c
|
A column, range of values [1, C]
|
|
R
|
A row, range of values [1, R]
|
|
A(t, s, c, r)
|
In the spectral cube of A, the  -band, the c-th row, and the r-line pixel of time t -band, the c-th row, and the r-line pixel of time t
|
|
BXXX
|
The data of one band
|
|
FXXX
|
Cube data representing multiple bands
|
|
PXXX
|
A temporal-spatial-spectral four-dimensional dataset, XXX is one of five formats
|
|
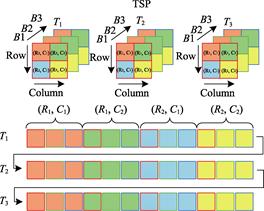
Figure 2 Temporal Sequential in Pixel (TSP)
data format structure
|
(2) TSP data format
As shown in Figure 2, the TSP storage format adopts the principle of spectral dimension priority. Firstly, all T1 time cube data is in accordance with the direction of the band in order to store the first pixel spectral information. Secondly, the cube data is stored the spectral information of each pixel, in according with the “first row, last column” principle. Finally, according to the above rules, all the time cube data can be stored in chronological order. This storage structure can be expressed as:
 (4)
(4)
In the formula, the storage of each cube can be expressed as follows:
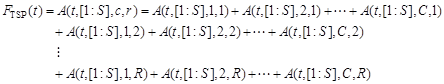 (5)
(5)
The meaning of the variables in the above formulas is given in Table 2.
|
Figure 3 Temporal Interleaved by Band (TIB)
data format structure
|
The TSP format is characterized by the storage of spectral data for each time image. It can be used for the operation of spectral data for a particular time. The extraction of a cell, a region of the spectral curve, or the image of spectral features for a different time, such as the operating time, requires the organization of the TSP data format (e.g., calculating the spectral slope, spectral binary coding, spectral absorption index, and the spectral derivative).
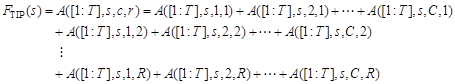
(3) TIB data format
As shown in Figure 3, the TIB storage format prioritizes the first band. All the pixels in the first band of T1 are stored in the order of “first row, last column”, and then all the image metadata for the first band at different times is stored in the order of “first row”. Finally, the band data is stored in chronological order according to the above rules.
This storage structure can be expressed as:
 (6)
(6)
where, FTIB(s) is a data cube composed of the same band for different time series. The storage order is adopted to store the first band in a time series, and then store the second band until all the bands are stored. FTIB(s) can be described as:
 (7)
(7)
where the order of storage for each band is:
 (8)
(8)
The meaning of the variables in the above formulas are given in Table 2.
The TIB format is characterized by a band of time data organized together, and can be used for the extraction of a band in a time series cube data. The TIB data format can be used to extract a band from time series cube data, or for a certain band to choose time data for a false color synthesis display.
(4) TIP data format
As shown in Figure 4, TIP first organizes the data of the first pixel of the first band at all times in chronological order, and then stores these pixels in “first row, last column” order. Finally, according to the above rules, all of the band data can be stored in band order.
This storage structure can be expressed as:
 (9)
(9)
where, FTIP(s) represents the cube of the same pixel spectrum of different time images, which can be expressed as:
 (10)
(10)
|

Figure 4 Temporal Interleaved by Pixel (TIP)
data format structure
|
The meaning of the variables in the above formulas is given in Table 2.
The main characteristic of the TIP format is that the time-spectrum data of the pixels in the image are organized together and can be applied to the processing and analysis of the time spectrum of the pixels. The TIP data format can be organized when the time spectrum of a cell or a region is extracted in a certain band, with smoothing and filtering in the time dimension, fitting the time-spectrum curve, and then the predictive analysis.
(5) TIS data format
As shown in Figure 5, the TIS storage format first stores the first cells of all bands in chronological order according to the principle of band priority. Then, according to this rule and the principle of “first row, last column”, the other pixels can be stored. This storage structure can be expressed as:
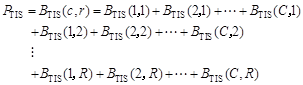 (11)
(11)
In formula (11):
 (12)
(12)
The meaning of the variables in the above formula is given in Table 2.
The TIS format is characterized by organizing the spectral data of each pixel over the entire time series and can be applied to extract the pixel spectral curve of a time series. In the TIS format it is possible to extract all the spectral curves of a certain pixel within a time range, visualize the curves, and analyze the spectrum of the pixels.
3 The MDA Tool
3.1 The MDA Computer Software Tool
To enable users to understand and apply the MDD data format, a computer software module was developed, which can be used for MDD data input, storage, and analysis and output. Termed the MDA analysis computer software module, this module is integrated into the Multi-dimensional Analysis of Remote Sensing (MARS) multi-dimensional remote sensing analysis system, and is referred to as MARS version 1.0 (MDD_MARS1.0 for short). This system was officially published in the “Global Change Research Data Publishing & Repository”[9]. The metadata of the system is summarized in Table 3.
|
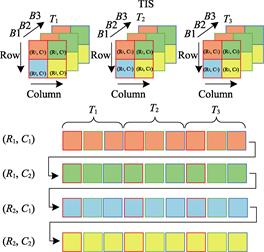
Figure 5 Temporal Interleaved by Spectrum (TIS) data format structure
|
3.2 Function of the MDA Tool
The MDA is a multi-dimensional analysis tool, which can access the MDD data
Table 3 Metadata summary of MDD_MARS1.0
|
Items
|
Description
|
|
System full name
|
Inter-operational tool for temporal-spatial data analysis in multi-dimensional data format (.mdd)
|
|
System short name
|
MDD_MARS1.0
|
|
Authors
|
Zhang, L. F. F-4751-2014, zhanglf@radi.ac.cn
Sun, X. J. K-3661-2017, sunxj@radi.ac.cn
Zhang, X. K-3994-2017, zhangxia@radi.ac.cn
Wang, N. K-3670-2017, wangnan@radi.ac.cn
|
Institute of Remote Sensing and Digital Earth, Chinese Academy of Sciences
|
|
Zhang, M. Y. K-3666-2017, zhangmy@radi.ac.cn
Lin, Y. K. K-3645-2017, linyk@radi.ac.cn
|
Institute of Remote Sensing and Digital Earth, Chinese Academy of Sciences; University of Chinese Academy of Sciences
|
|
Huang, H. K-3966-2017, 770855750@qq.com
Cen, Y. K-3651-2017, cenyi@radi.ac.cn
Huang, C. P. K-3660-2017, huangcp@radi.ac.cn
Yang, H. K-3796-2017, yanghang@radi.ac.cn
Zhang, H. M. K-3999-2017, zhanghm@radi.ac.cn
Liu, J. K-4004-2017, liujia@radi.ac.cn
Tong, Q. X. K-4000-2017, tongqx@radi.ac.cn
|
Institute of Remote Sensing and Digital Earth, Chinese Academy of Sciences
|
|
Main functions
|
Building, reading, analyzing, and displaying MDD files, and preprocessing and classifying remotely sensed images
|
|
Data formats
|
.mdd, .tif, .hdf, .img, .h5, .int, .jpg, .png, .bmp
|
|
System files
|
Three files
|
|
Foundation(s)
|
National Natural Science Foundation of China (41072248)
|
|
Data publisher
Address
|
Global Change Research Data Publishing & Repository, http://www.geodoi.ac.cn
No.11A, Datun Road, Chaoyang District, Beijing 100101, China
|
|
Software sharing
policy
|
(1) Software is openly available and can be freely downloaded via the internet; (2) End users are encouraged to use data subject to citation; (3) Users, who are by definition also value-added service providers, are welcome to redistribute data subject to written permission from the GCdataPR Editorial Office and with the issuance of a data redistribution license[10]
|
format. The function of this tool includes MDD data building (MDD Builder), MDD data open (MDD Open), MDD data conversion (MDD Conversion), MDD data export (MDD Export), MDD data operations (MDD Math) and functions more. These specific functions are shown in Figure 6.
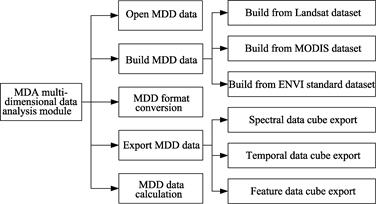
Figure 6 Schematic functions of the multi-dimensional data analysis (MDA) tool
The functions of the MDA tool include the construction, opening, and conversion of the MDD formatted data, the extraction of the spectrum, the determination of the spectral and characteristic parameters from the MDD, the visualization of the MDD in the time and spectral dimensions, and the corresponding time spectrum and spectrum extraction, display, and analysis. This module can convert the remote sensing dataset of the original or pretreated long time series into the MDD, and extract the temporal variation of the information such as the spectrum in different spatial ranges. The MDD uses five different storage structures for different applications, and so can quickly and effectively perform an MDA, and extract and display data through the module format conversion function and follow-up operations. On the basis of the constructed MDD, the spectral feature parameter extraction function can be used to extract the temporal variation of a spectral characteristic parameter (such as the normalized difference vegetation index (NDVI), ratio vegetation index (RVI), etc.), construct the characteristic parameter cube, and use gray or false color synthesis. The feature parameters are displayed to show the characteristic parameters of any pixel in an interactive manner. The three-dimensional cube data can be extracted from the MDD space-temporal four-dimensional data by a spectral cube or time cube extraction function, and the data can be processed and analyzed in a format supported by commonly used remote sensing software. The menu items and their functions in the MDA module in the MARS 1.0 software are shown in Table 4.
3.3 MDD Construction and Visualization
The MDA module integrates the MDD data from the original MODIS and the original Landsat, and the remote sensing data has been processed into the ENVI standard data format. This section describes the overall process of building the MDD with the MDA module,
using MODIS and Landsat as the data source. It also details the construction, information extraction, and visualization of MDD data, using MODIS data as an example.
Table 4 The multi-dimensional data analysis (MDA) tool menu items and their functions
|
Field
|
Meaning
|
|
MDD Open
|
Open MDD-formatted data
|
|
MDD Builder
|
Build MDD-formatted data
|
|
From Landsat
|
Build MDD format data from Landsat datasets
|
|
From MODIS
|
Build MDD format data from MODIS datasets
|
|
From ENVI Image
|
Create MDD format data from the ENVI standard dataset
|
|
MDD Conversion
|
The TSB, TSP, TIB, TIP, and TIS data formats are converted to each other
|
|
MDD Export
|
The selected MDD data is exported in temporal or spectral dimensions
|
|
MDD math
|
Spectral operations, extraction of the feature cube, and other procedures
|
|

Figure 7 The overall process of building the multi- dimensional dataset (MDD) using MODIS data with the multi-dimensional data analysis (MDA) tool
Figure 8 The overall process of building the multi- dimensional dataset (MDD) using Landsat data with the multi-dimensional data analysis (MDA) tool
|
The overall process of building raw MODIS and Landsat data into MDD data using the MDA module is shown in Figures 7 and 8.
3.3.1 MDD Building (from MODIS Data)
MODIS products, which are free and provide wide global coverage, with a high update frequency, are widely used in studies of global change. The United States Geological Survey (USGS) website provides different levels of MODIS products, with the most commonly used being the eight-day-composite reflectance products MOD09A1 and MOD09GA. The MODIS products are released in the HDF file format, with the reflectance and the attributes stored in the form of sub-datasets. The proposed MDA module can automatically build MODIS and Landsat datasets in the MDD file format. In this example, the eight-day-composite reflectance product MOD09A1, which includes 46 scenes from 2011, was used to build the MDD file format. MODIS products use a sinusoidal projection, which needs to be re-projected to other projections, such as the commonly used UTM projection. Additionally, mosaicking is necessary for large study areas, such as North America, which needs multiple tiles of MODIS products to completely cover the whole area.
There are three steps necessary to build the MDD file format with the MDA module:
Step 1: Extract the original MODIS datasets to the specified folder and the datasets file will be automatically ordered according to the time sequence. The MDA module will automatically identify the data type, acquisition time, and other parameters by parsing the file name, as shown in Figure 9.

Figure 9 MODIS datasets used to build the multi-dimensional dataset (MDD)
|
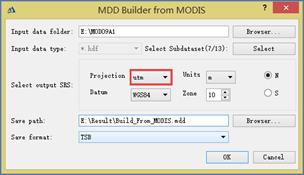
Figure 10 The interface used for multi-dimensional data
construction based on MODIS datasets

Figure 11 The interface used for selecting the sub-dataset
|
Step 2: Click the “MDD Builder from MODIS” to access the interface for building the MDD file format (Figure 10). Then, select the path of the datasets, the required spectral or attribute bands, re-projection type, and storage structure of the MDD. Finally, the sub-datasets including all spectral or attribute bands of the MODIS products are shown in the “Select Subdataset” interface and users can choose the required spectral or attribute bands (Figure 11).
Step 3: The MDD dataset will be generated, including the header file and the data file, with .mdr and .mdd as the respective suffixes (Figure 12).
The header file of the MDD dataset generated by this process is shown in Figure 13, with the meaning explained in Table 5.
3.3.2 Information Extraction from the MDD Formatted Data
The MDA module has the function of analyzing the MDD and can extract information for any dimension and then generate the spectral cube under different times and the temporal
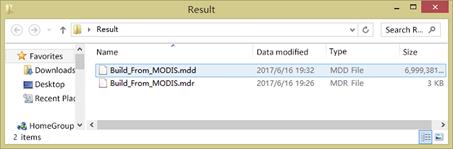
Figure 12 The multi-dimensional dataset (MDD) file built using MODIS datasets
|
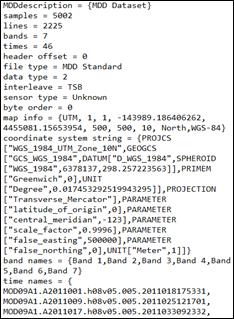
Figure 13 The header file for the multi-
dimensional dataset format (MDD)
|
|
Table 5 The details of the header file shown in Figure 13
|
|
Field
|
Description
|
|
MDD
description
|
MDD dataset
|
|
Samples
|
5002 rows in each spectral band
|
|
Lines
|
2225 columns in each spectral band
|
|
Bands
|
7 spectral bands in total
|
|
Times
|
46 temporal bands in total
|
|
Header offset
|
The embedded header information is 0 bytes
|
|
File type
|
MDD standard type data
|
|
Data type
|
16-bit integer for this dataset
|
|
Interleave
|
The data is organized in TSB format
|
|
Sensor type
|
Sensor type, for this dataset it is unknown
|
|
Byte order
|
The lowest valid priority data
|
|
Map info
|
Projection information; this dataset uses UTM projection, starting pixel coordinates are (1,1). Other projection information is shown in map info
|
|
Coordinate system string
|
Coordinate system information, such as WGS84 coordinates
|
|
Band names
|
The names of spectral bands in the dataset, e.g., Band 1… Band 7
|
|
Time names
|
The time information in the dataset. There are 46 temporal bands, such as MOD09A1.A2011001.h08v05.005.201101817533
|
cube under different spectral bands or spectral features computed by spectral transformation (such as the NDVI time series).
(1) The export of the spectral and temporal cubes
When “MDD Export” is selected the interface of “MDD Export” will appear (Figure 14, left). The spatial range of the dataset can be resized through the “Subset by Image” interface (Figure 14, right) and is opened by clicking “Image” in the “MDD Export” interface. The spectral or temporal cube can be exported by selecting the “Select Export Type” list. If “Spectral Cube” is selected, users need to confirm which time and which spectral bands will be exported, as shown in Figure 15, left. If “Temporal Cube” is selected, users need to choose which spectral band and which times will be exported, as shown in Figure 15, right. The export results for spectral and temporal cubes are shown in Figure 16.
(2) Generation of a temporal cube with different spectral features
The MDA module can generate a temporal cube with different spectral features, with the spectral band mathematics used to obtain the spectral features. Here, the generation of an
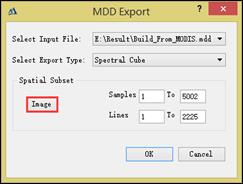
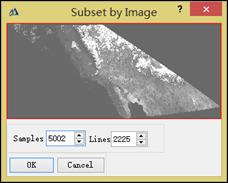
Figure 14 The interface used for exporting MODIS datasets
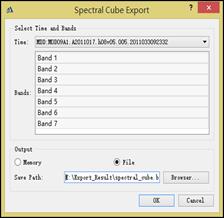
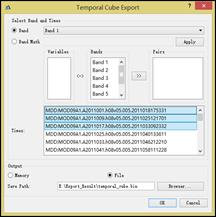
Figure 15 Parameter selection for the export of spectral and temporal cubes
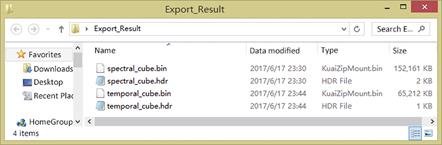
Figure 16 The export results for a spectral and temporal cube
NDVI time series is used as an example. First, the “Characteristic Export” interface is accessed by selecting the “Characteristic Cube” in the “Select Export Type” list, as shown in Figure 17. Then, the expression “(b1-b2)/(b1+b2)” is inputted in the “Characteristic Expression” and applied. Third, “Band 2” (the near infrared band in MODIS) is appointed as “b1” and “Band 1” (the red band in MODIS) is appointed as “b2”. Finally, the times needed by users can be selected and the NDVI time series can be generated.
|

Figure 17 The export of a temporal NDVI cube
|
3.3.3 Visualization of the MDD
(1) The spectral aspect of the display
The MDA module can provide an interactive visualization for the MDD. The “Available Data List” tool is used to switch to the “Spectral Dimension” tab and the dataset can then be displayed in its spectral aspect. First, it should be confirmed under which time the MDD will be displayed. Then, the color synthesis image can be displayed by inputting three spectral bands into the red, green, blue (RGB) channel and the gray image can be shown by choosing one spectral band. Additionally, “Data Profile” can display the spectral curve of the pixel selected by the user (Figure 18).
(2) The temporal aspect of the display
The “Available Data List” tool is used to switch to the “Temporal Dimension” tab and the dataset can then be displayed in the temporal aspect. First, a spectral band or spectral feature


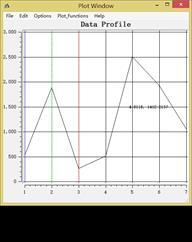
Figure 18 Visualization in the spectral aspect
the MDD dataset will be displayed. Then the color synthesis image can be displayed by inputting three temporal bands into the RGB channel and the gray image can be shown by choosing one temporal band. Additionally, “Data Profile” can display the time series of the pixel selected by the user under the selected spectral band or spectral feature (Figure 19).

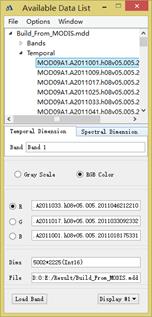
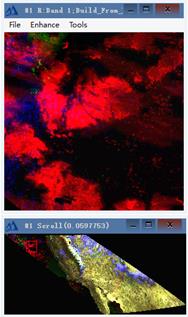
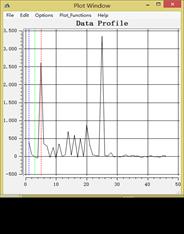
Figure 19 Visualization in the temporal aspect
4 Prospects
The comprehensive organization of remote sensing data in the spatio-temporal-spectral dimensions is a realistic requirement for remote sensing in many applications. For example, in water quality monitoring, in view of the increasingly serious environmental degradation problems, the MDD can quickly and accurately calculate the various indexes used to assess water bodies, indicating the need for further water pollution monitoring, and strengthening the protection of aquatic ecosystems. In the monitoring of forest disturbance, the MDD can effectively organize long time series of remote sensing images, which can be used to calculate a variety of forest dynamic monitoring indexes, in terms of the temporal, spatial, and spectral dimensions, enabling an accurate interpretation of forest disturbance. In crop monitoring, the use of MDD can combine the multi-source remote sensing data in the three dimensions of space-time-spectrum. It can extract information regarding crop species, spatial distribution, and crop condition, and meet the demand for the accurate monitoring of crops. In terms of urban expansion, the use of MDD can quickly calculate changes in the urban area, accounting for the spatial characteristics of urban developments, and providing decision support for urban planners. In summary, MD can play an important role in studies of global change and has a broad range of potential applications.
Acknowledgements
We thank Dr. Liu, C., Professor of the Institute of Geographic Sciences and Natural Resources Research, Chinese Academy of Sciences, for her suggestions and assistances with completing this product and software tool testing.
References
[1] Kennedy, R. E., Yang, Z., Cohen, W. B. Detecting trends in forest disturbance and recovery using yearly Landsat time series: 1. LandTrendr?DTemporal segmentation algorithms [J]. Remote Sensing of Environment, 2010, 114(12): 2897-2910.
[2] Huang, C., Goward, S. N., Masek, J. G., et al. An automated approach for reconstructing recent forest disturbance history using dense Landsat time series stacks [J]. Remote Sensing of Environment, 2010, 114(1): 183-198.
[3] Powell, S. L., Cohen, W. B., Healey, S. P., et al. Quantification of live aboveground forest biomass dynamics with Landsat time-series and field inventory data: A comparison of empirical modeling approaches [J]. Remote Sensing of Environment, 2010, 114(5): 1053-1068.
[4] Margono, B. A., Turubanova, S., Zhuravleva, I., et al. Mapping and monitoring deforestation and forest degradation in Sumatra (Indonesia) using Landsat time series data sets from 1990 to 2010 [J]. Environmental Research Letters, 2012, 7(3): 034010.
[5] Townsend, P. A., Helmers, D. P., Kingdon, C. C., et al. Changes in the extent of surface mining and reclamation in the Central Appalachians detected using a 1976-2006 Landsat time series [J]. Remote Sensing of Environment, 2009, 113(1): 62-72.
[6] Galford, G. L., Mustard, J. F., Melillo, J., et al. Wavelet analysis of MODIS time series to detect expansion and intensification of row-crop agriculture in Brazil [J]. Remote Sensing of Environment, 2008, 112(2): 576-587.
[7] Sakamoto, T., Yokozawa, M., Toritani, H., et al. A crop phenology detection method using time-series MODIS data [J]. Remote Sensing of Environment, 2005, 96(3): 366-374.
[8] Zhang, L. F., Chen, H., Sun X. J., et al. Designing spatial-temporal-spectral integrated storage structure of multi-dimensional remote sensing images [J]. Journal of Remote Sensing, 2017, 21(1): 62-73.
[9] Zhang, L. F., Sun, X. J., Zhang, X., et al. Inter-operational tool for temporal-spatial data analysis in Multi-Dimension Data Format (.mdd) [DB/OL]. Global Change Research Data Publishing & Repository, 2017. DOI: 10.3974/geodb.2017.02.20.V1.
[10] GCdataPR Editorial Office. GCdataPR Data Sharing Policy [OL]. DOI: 10.3974/dp.policy.2014.05 (Updated 2017).