Province Based Carbon Productivity Influencing Factors Dataset of China (2010, 2015)
Tang, Z. P.1,2,3 Liu, W. D.1,2,3* Song, T.1,2,3
1. Key Laboratory of Regional Sustainable Development Modeling, Chinese Academy of Sciences, Beijing 100101, China;
2. Institute of Geographic Sciences and Natural Resources Research, Chinese Academy of Sciences, Beijing 100101, China;
3. College of Resources and Environment, University of Chinese Academy of Sciences, Beijing 100049, China
Abstract: The province based carbon productivity influencing factors dataset of China (2010, 2015) was developed based on statistics on energy consumption, GDP, power ratio, annual patent authorization number, unit employees and the industrial added value in 30 Chinese provinces (with the exception of Tibet, Hong Kong, Macau, and Taiwan whose data were missing) in 2010 and 2015 and the spatial autocorrelation methodology. Four impact factors and their regression parameters in 2010 and 2015 were estimated. The dataset includes Chinese 30 provincial carbon productivities and their parameters resulting from power ratio, service industry ratio, annual patent authorization number, unit employees of the industrial added value. The dataset was archived in .xlsx data format with the data size of 16.8 KB.
Keywords: carbon productivity; global variables; local variables; Chinese provinces
1 Introduction
The need to develop a low-carbon economy has become a consensus globally in response to climate change. In this context, the single most essential requirement of low-carbon economy is an increase in productivity; the emission of every unit of carbon dioxide (CO2) must therefore lead to the generation of additional gross domestic product (GDP)[1]. The concept of carbon productivity therefore reflects the economic benefits that result from the emission of every CO2 unit[2–3]. Thus, increasing carbon productivity means a concomitant increase in economic output per unit of carbon emissions; this concept has become a key to develop of low-carbon economies.
Research on carbon productivity has focused on analyzing the relationship between productivity and emission reduction targets[4–6], as well as the factors influencing historical evolution and the evaluation of this index[7–8]. Current research methods used to determine the factors influencing carbon productivity necessarily require the assumption of spatial independence, a concept which argues that inter-regional variable remain independent of each other and are not spatially correlated[9–12]. Alternatively, these approaches also assume spatial consistency, a concept which argues that inter-regional influencing factors are either spatially related or uncorrelated[13–14].
2 Metadata of Dataset
The metadata for the dataset of province based carbon productivity influencing factors dataset in China[19] are listed in Table 1.
Table 1 Metadata summary of the province based carbon productivity influencing factors
dataset of China (2010, 2015)
|
Items
|
Description
|
|
Dataset name
|
Province based carbon productivity influencing factors dataset of China (2010, 2015)
|
|
Dataset short name
|
ChinaCProductInfluencingFactors20102015
|
|
Author information
|
Tang, Z. P. M-6479-2018, Institute of Geographic Sciences and Natural Resources Research, CAS, tangzp@igsnrr.ac.cn
Liu, W. D. Institute of Geographic Sciences and Natural Resources Research, CAS, liuwd@igsnrr.ac.cn
Song, T. M-6637-2018, Institute of Geographic Sciences and Natural Resources Research, CAS, songtao@igsnrr.ac.cn
|
|
Geographic area
|
30 provinces in China
|
Year 2010, 2015
|
|
|
Format
|
.xlsx Data size 16.8 KB
|
|
Dataset
|
ChinaCProductInfluencingFactors20102015.xlsx, including carbon productivity and influencing factors for 2010 and 2015 from 30 Chinese provinces
|
|
Foundation(s)
|
National Natural Science Foundation of China (41430636, 41571518); Ministry of Science and Technology of P. R. China (2016YFA0602804)
|
|
Publisher
|
Global Change Research Data Publishing and Repository, http://www.geodoi.ac.cn
|
|
Address
|
No. 11A, Datun Road, Chaoyang District, Beijing 100101, China
|
|
Data sharing policy
|
Data from the Global Change Research Data Publishing & Repository includes metadata, datasets (data products), and publications (in this case, in the Journal of Global Change Data & Discovery). Data sharing policy includes: (1) Data are openly available and can be free downloaded via the Internet; (2) End users are encouraged to use Data subject to citation; (3) Users, who are by definition also value-added service providers, are welcome to redistribute Data subject to written permission from the GCdataPR Editorial Office and the issuance of a Data redistribution license, and; (4) If Data are used to compile new datasets, the ‘ten percent principal’ should be followed such that Data records utilized should not surpass 10% of the new dataset contents, while sources should be clearly noted in suitable places in the new dataset[20]
|
3 Methodology
The dataset presented here encompasses source material from 30 Chinese provinces (except Tibet, Hong Kong, Macau, and Taiwan where records were absent) and includes energy consumption, GDP, power and service industry ratios, as well as annual patent authorization numbers, number of employees, and industrial added value. Records were culled for 2010 and 2015 mainly from Chinese Energy Statistical Yearbook (2011-2016)[15–16] and Chinese Statistical Yearbook (2011-2016)[17–18]. Data were then pre-processed to obtain carbon productivity values for the 30 provinces, including service industry and coal power ratios, annual patent authorization numbers, and industrial value-added per 10,000 employees.
3.1 Algorithms
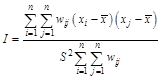
(1) Spatial autocorrelation was used to determine the factors affecting carbon productivity. The Global Moran’s I Index[21–22] was used to test for spatial autocorrelation relationships, which is calculated as follows:
 (1)
(1)
 (
( ,
,  ) (2)
) (2)
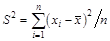
Where I is Moran Index; S2 is sample variance;  is the sample mean; xi and xj refer to the factors influencing each provincial value including power and service industry ratios, annual patent authorization numbers, and industrial value-added indices per 10,000 employees. Similarly, wij is the spatial weight estimated using a first-order rook contiguity in cases where area i and area j have the same geographic boundaries while wij = 1, otherwise wij = 0. It also follows that E(I) and Var(I) are expected values of I and variance, respectively, while z is the standard normal distribution value of I. This means that the variation range of I is between -1 and 1; a value closer to 0 implies a lower spatial correlation and a more random distribution. Similarly, if I > 0 and z > 1.96, or I < 0 and z < -1.96, there is a significant positive or negative spatial correlation and a corresponding agglomeration or diffusion.
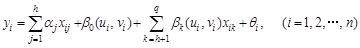
(2) Parameterization. A series of parameters were set in this case in the form of related variables via hybrid geographic weighted regression. Variables were therefore set using significant spatial correlation as local variables, including parameters related to individual geographic locations. Variables without significant spatial correlation were therefore defined as global variables and the parameter was held constant, as follows:
 (3)
(3)
Where yi and  represent the carbon productivity and factors influencing global variable service industry ratios in the ith province;
  are regression constant coefficients, independent of the spatial location of the influencing factors; All n independent sample observations,
  ,
,  , …,
, …,  in the kth independent variable
  , represent the factors influencing the proportion of local variables in terms of thermal power, number of annual patent grants, and industrial added value of unit employee;
  are regression variable coefficients, dependent on the spatial location of influencing factors; and θ is the normal distribution random variable. It is clear that the constant and variable parameters of our mixed geographically weighted regression can be calculated using a two-step iterative estimation process to generate specific values[23].
3.2 Flowchart of the Dataset Development
The main technical processes used to assemble this dataset include basic data collection, research variable synthesis, statistical tests, and mixed geographic weighted regression. The flow chart to determine the parameters affecting province-level carbon productivity in China is shown in Figure 1.
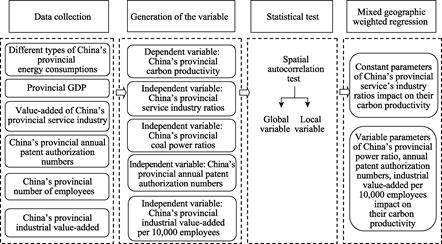
Figure 1 The flow chart to determine the parameters affecting province-level carbon productivity in China
4 Results and Validation
4.1 Data
We assembled a dataset containing the factors that influence provincial carbon productivity across China. This dataset encompasses 30 provincial administrative units in 2010 and 2015 and includes the impact of related factors on carbon productivity[19,24].
4.2 Results
The best natural breakpoint method outlined by Jenks was used to divide Chinese provincial carbon productivity into five levels, a “very low value zone”, a “low value zone”, a “medium value zone”, a “high value zone”, and a “very high value zone” (Figure 2). Research results for Chinese provincial carbon productivity in 2010 exhibit the following spatial characteristic: productivity generally progressively decreases from south to north and from coastal to inland areas. However, carbon productivity has improved to some degree overall in 2015; the dominant spatial characteristic is still of a progressive decrease from
Table 2 The factors influencing provincial carbon productivity in China (part of data)
|
Province
|
Dependent variables (Chinese provincial carbon productivity: 10,000 yuan GDP per ton of carbon)
|
The parameters influencing global independent variables (Chinese provincial service industry ratios)
|
The parameters influencing local independent variables (Chinese provincial coal power ratios)
|
The parameters influencing local independent variables (Chinese provincial annual patent authorization numbers)
|
The parameters influencing local independent variables (Chinese provincial industrial value-added indices per 10,000 employees)
|
|
Beijing
|
4.720
|
0.880
|
-0.568
|
0.272
|
0.067
|
|
Tianjing
|
2.220
|
0.880
|
-0.565
|
0.271
|
0.065
|
|
Hebei
|
1.230
|
0.880
|
-0.558
|
0.269
|
0.062
|
|
Shanxi
|
0.490
|
0.880
|
-0.553
|
0.268
|
0.063
|
|
Shanghai
|
3.310
|
0.880
|
-0.504
|
0.254
|
0.052
|
|
Jiangsu
|
2.570
|
0.880
|
-0.502
|
0.254
|
0.056
|
|
Zhejiang
|
2.630
|
0.880
|
-0.496
|
0.252
|
0.051
|
|
Xinjiang
|
0.700
|
0.880
|
-0.586
|
0.276
|
0.079
|
|
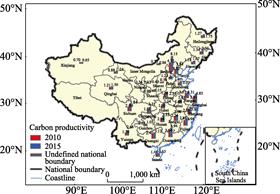
Figure 2 The spatial distribution of Chinese provincial
carbon productivity (10,000 yuan GDP per ton of
carbon) in 2010 and 2015
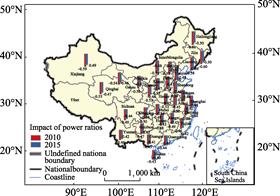
Figure 3 The impacts of coal power ratio on Chinese
provincial carbon productivity in 2010 and 2015
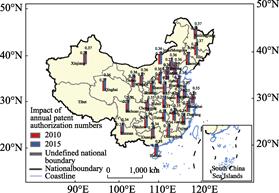
Figure 4 The impact of annual patent authorization
numbers on Chinese provincial carbon productivity
in 2010 and 2015
|
south to north but the high- value zone is now concentrated in coastal areas and within the Yangtze River Basin.
The positive impact of Chinese provincial service industry ratios on carbon productivity between 2010 and 2015 increased from 0.88 to 1.04. These results showed that coal power ratios exerted a negative impact on Chinese provincial carbon productivity and progressively negatively decreased from south to north (Figure 3). This means that the impact of annual patent authorization numbers on carbon productivity progressively decreased spatially from north to south (Figure 4), while the impact of industrial value-added indices per 10,000 employees on carbon productivity also progressively decreased spatially in the same way (Figure 5).
4.3 Data Validation
The spatial distribution analysis of Chinese provincial carbon productivity and influencing factors for 2010 and 2015 presented here shows that national high carbon productivity areas were mainly concentrated in coastal provinces in these years, while inland area energy-based industries (e.g., in Xinjiang, Shanxi, and Inner Mongolia) were characterized by relatively low provincial carbon productivity. Data also showed that provincial carbon productivity generally increased from 2010 to 2015; service industry ratios, annual patent authorization numbers, and industrial value-added indices per 10,000 employees all positively contributed to the improvements of carbon productivity while coal power ratios had the opposite effect.
The dataset showed that global variable service industry ratio parameters increased from 2010 to 2015 while local variable coal power ratios parameters decreased over the same time period. Service industry ratios within China generally increased from 2010 to 2015; national service industry ratios increased from 44.1% to 50.2% and began to dominate throughout this period. Due to the implementation of clean energy policies, coal power ratios in most Chinese provinces have declined while the impact of energy structures on carbon productivity also decreased. The results summarized here therefore are closer to the presumption that a dataset of Chinese provincial carbon productivity influencing factors more accurately reflects the spatial distribution of these variables.
|
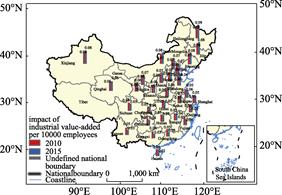
Figure 5 The impact of industrial value-added indices per 10,000 employees on Chinese provincial carbon productivity in 2010 and 2015
|
5 Discussion and Conclusion
Traditional calculations and analyses of factors influencing carbon productivity have tended to assume that all variables either have or have no significant spatial correlations. However, the data assembled here show that some influencing factors are significantly spatially correlated while others are not. These two different types of factors often simultaneously influence Chinese provincial carbon productivity. Assuming the consistent spatial correlation of all influencing factors without performing statistical tests means that the resulting parameters may be significantly different from actuality.
The results presented here are therefore more consistent with the actual situation. The dataset will be useful for the further development of long-term time sequences and provides a scientific basis for understanding the factors driving reductions in Chinese provincial carbon emissions.
Author contributions
Liu, W. D. did the overall design for dataset development; Song, T. collected and processed data; Tang, Z. P. designed the algorithms, performed data validation and wrote this paper.
References
[1] He, J. K. The key to developing a low-carbon economy is low-carbon technology innovation [J]. Greenleaf, 2009(1): 46-50.
[2] Kaya, Y., Yokobori, K. Environment, Energy and Economy: Strategies for Sustainability [M]. Tokyo: United Nations University Press, 1997.
[3] Oikonomou, V., Becchis, F., Steg, L., et al. Energy saving and energy efficiency concepts for policy making [J]. Energy Policy, 2009, 37(11): 4787-4796.
[4] Pan, J. H. How to develop China’s low carbon economy [J]. China Market, 2010(11): 61-65.
[5] He, J. K., Su, M. S. Carbon productivity analysis to address global climate change [J]. China Soft Science, 2009(10): 42-47.
[6] Beinhocker, E., Oppenheim, J., Irons, B., et al. The carbon productivity challenge: Curbing climate change and sustaining economic growth [R]. Sydney: McKinsey Global Institute, 2008.
[7] Sang, H. L., Yun, M. S., Bo, K. K., et al. Latitudinal carbon productivity in the Bering and Chukchi Seas during the summer in 2007 [J]. Continental Shelf Research, 2013, 59(2): 28-36.
[8] Yang, X., Li, X. P., Zhou, D. C. Study on the difference and convergence of carbon productivity in Chinese manufacturing [J]. The Journal of Quantitative & Technical Economics, 2015(12): 3-20.
[9] Pan, J. H., Zhang, L. F. Research on the regional variation of carbon productivity in China [J]. China Industrial Economics, 2011(5): 47-57.
[10] Wu, X. H., Li, L. The differences and enhancing potential of provincial carbon productivity and energy efficiency [J]. Economic Geography, 2014, 34(5): 105-108.
[11] Huang, Y. S., Li, H. Research on the decomposition model of carbon productivity factors analysis [J]. Journal of North China Electric Power University (Social Sciences), 2016, 101(3): 13-17.
[12] Zhao, X. J., Zhang, J. The impact of foreign trade on carbon productivity: an empirical study based on 1992-2011 panel data from 88 countries [J]. International Business, 2016(1): 28-39.
[13] Shang, W. Spatial econometrics of total factor carbon productivity among provinces in China [D]. Guilin: Guangxi Normal University, 2015.
[14] Chen, L. L., Zhang, J. B., Tian, Y., et al. The spatial variation characteristics and dependency of agricultural carbon productivity in China [J]. Resources Science, 2016, 38(2): 276-289.
[15] National Bureau of Statistics of P. R. China, Energy Statistics Division. China Energy Statistical Yearbook 2011 [M]. Beijing: China Statistics Press, 2011.
[16] National Bureau of Statistics of P. R. China, Energy Statistics Division. China Energy Statistical Yearbook 2016 [M]. Beijing: China Statistics Press, 2016.
[17] National Bureau of Statistics of P. R. China. China Statistical Yearbook 2011 [M]. Beijing: China Statistics Press, 2011.
[18] National Bureau of Statistics of P. R. China. China Statistical Yearbook 2016 [M]. Beijing: China Statistics Press, 2016.
[19] Tang, Z. P., Liu, W. D., Song, T. Province based carbon productivity influencing factors dataset of China (2010, 2015) [DB/OL]. Global Change Research Data Publishing and Repository, 2018. DOI: 10.3974/geodb.2018.04.07.V1.
[20] GCdataPR Editorial Office. GCdataPR data sharing policy [OL]. DOI: 10.3974/dp.policy.2014.05 (Updated 2017).
[21] Moran, P. A. P. The Interpretation of statistical maps [J]. Journal of the Royal Statistical Society, 1948, 10(2): 243-251.
[22] Moran, P. A. P. Notes on continuous stochastic phenomena [J]. Biometrika, 1950, 37(1-2): 17-23.
[23] Xuan, H. Y., Liu, S. Q., Luo, S. H. Two kinds of estimation of mixed geographically weighted regression model [J]. Journal of Lanzhou University of Technology, 2007, 33(3): 142-144.
[24] Tang, Z. P., Liu, W. D., Song, T. Factors affecting China’s provincial carbon productivity based on mixed geographically weighted regression modeling [J]. Resources Science, 2017, 39(12): 2223-2232.