Development of a Dataset of the Spatial-temporal
Distribution of Typical Salt Marsh Vegetation in the Yellow River Delta
(1999–2020)
Hu, J. F.1,2,3 Gong, Z. N.1,2,3,4* Zhang, C.1,2 Qiu, H. C.1,2,3
1. College of Resources,
Environment and Tourism, Capital Normal University, Beijing 100048, China;
2. Key Laboratory of 3D
Information Acquisition and Application of Ministry, Beijing 100048, China;
3. Beijing Key Laboratory of
Resources Environment and GIS, Beijing 100048, China;
4. Beijing Laboratory of Water
Resources Security, Beijing 10048, China
Abstract: The typical salt marsh
vegetation in the Yellow River Delta, which is represented by Suaeda salsa,
Phragmites australis, and Spartina alterniflora, provides a
variety of ecological services such as maintaining biodiversity, providing
important habitats, reducing storm runoff, and regulating the climate. The
study of its distribution and succession is of great significance for the
conservation and management of the entire ecosystem. A dataset of the typical
salt marsh vegetation in the Yellow River Delta was created and analyzed. Based
on 2,068 Landsat TM/ETM/OLI, Sentinel-2 MSI optical data, and Sentinel-1 SAR
data from 1999 to 2020, a comprehensive set of salt marsh vegetation features
during the entire growth period was constructed used the Google Earth Engine
platform. The best feature combination was selected using the recursive feature
elimination feature optimization algorithm and was applied in a random forest
classification model to obtain the final map. Then, the spatial-temporal
distribution dataset of typical salt marsh vegetation was analyzed. The dataset
mainly covers the estuarine wetlands of the Yellow River Delta, with spatial
resolutions of 10 m and 30 m. The data storage is in .tif format, and the
projection coordinate system is WGS_1984_UTM_Zone_50N. It contains 16 data
files, and the amount of data is 172 MB (compressed to a single file, 31.7 MB).
Keywords: Yellow River Delta; salt marsh vegetation; long time
series; feature optimization algorithm
DOI: https://doi.org/10.3974/geodp.2022.02.07
CSTR: https://cstr.escience.org.cn/CSTR:20146.14.2022.02.07
Dataset Availability Statement:
The dataset
supporting this paper was published and is accessible through the Digital Journal of
Global Change Data Repository at: https://doi.org/10.3974/geodb.2022.01.06.V1 or https://cstr.escience.org.cn/CSTR:20146.11.2022.01.06.V1.
1 Introduction
Estuarine
wetlands are the frontier area of sea-land interactions and are one of the most
important components of coastal ecosystems[1]. The structure and
layout of wetland vegetation can reflect the basic characteristics of and
changes in the wetland ecological environment, which is of great significance
to monitoring and studying regional ecological environment changes. The salt
marsh vegetation in an estuarine wetland has ecological functions such as
energy exchange, biological habitats, and environmental improvement[2].
Accurate extraction of its distribution information and timely analysis of its
dynamic changes are of great significance to the protection and management of
the wetland ecological environment and even to the regional ecological
environment[3].
The Yellow River
Delta wetland, which is located in the coastal area and water crisscross zone,
is a typical coastal wetland ecosystem with a high sensitivity and vulnerability.
Under the context of global warming, species invasion, and human activities,
the surface morphology of the Yellow River Delta has undergone significant
evolution. In addition, native species such as P. australis and S.
salsa face the problems of habitat fragmentation and area reduction, while
the invasive species S. alterniflora has rapidly colonized and expanded due to its own competitive
advantage. As a result, the distribution pattern of estuarine wetland
vegetation has exhibited frequent succession[3]. Accurate
and effective extraction of estuarine wetland salt marsh vegetation information
has always been an urgent problem to be solved. The solution to this problem is
of great significance to the monitoring and protection of the ecological
environment of the Yellow River Delta wetland[4]. In this study, the
estuary of the Yellow River Delta is taken as the study area. Based on the
characteristics of the phenological season of the salt marsh vegetation, 2,068
Landsat TM/ETM/OLI scenes, Sentinel-2 MSI optical data, and Sentinel-1 SAR data
were fully used in the Google Earth Engine (GEE) big data platform. The spatial
distribution data of the typical salt marsh plant populations in the Yellow
River Delta were obtained, and then, spatial and temporal distribution datasets
of typical salt marsh plant populations from 1999 to 2020 were obtained by
mining and analyzing their distribution characteristics.
2 Metadata of the Dataset
Table
1 lists the name, author, geographical region, data age, temporal resolution,
spatial resolution, composition of the dataset, data publishing and sharing
service platform, and data sharing policy of the Spatial-temporal dataset of
salt marsh vegetation in Yellow River Delta (1999–2020)[5].
3 Development Methods of the Dataset
In this study, all of the available Landsat series data of a good
quality (cloud cover <30%), Sentinel-2 optical data, and Sentinel-1 SAR data
from 1999 to 2020, including 197 Landsat-7 enhanced thematic mapper plus (ETM
+) images, 62 Landsat-8 OLI images, 1,294 Sentinel-2 MSI images, and 515
Sentinel-1 SAR images, were selected. The GEE cloud platform
(https://earthengine.google.com/) integrates a large amount of remote sensing
image data and other data resources. Landsat series
satellite remote sensing data from 1972 to present, MODIS data and its series
products from 2000 to present, Sentinel series satellite remote sensing data
from 2014 to present, and global scale elevation, meteorology, and land use
data at can be called online[7]. All of the image data used in this
study can be invoked on the GEE platform. The other auxiliary analysis data
included measured sample data for the Yellow River Delta Nature Reserve, which
were collected by our research group several times
Table 1 Metadata summary of the Spatial-temporal
dataset of salt marsh vegetation in Yellow River Delta (1999–2020)
|
Items
|
description
|
|
Dataset
full name
|
Spatial-temporal
distribution dataset of typical salt marsh vegetation in the Yellow River
Delta (1999‒2020)
|
|
Dataset
short name
|
SaltMarshVegYRD1999-2020
|
|
Authors
|
Hu, J. F.
AHA-1158-2022, Capital Normal University, 2190902115@cnu.edu.cn
Gong, Z. N. DWF-7853-2022, Capital Normal University, gongzhn@163.com
Zhang, C. EIE-6796-2022, Capital Normal University, chzhang_hn@163.com
Qiu, H. C. DNC-0167-2022, Capital Normal University,
qiu_huachang@163.com
|
|
Geographical
region
|
Estuarine
wetlands at the mouth of the Yellow River Delta
|
|
Year
|
1999‒2020
|
|
Temporal
resolution
|
year
|
|
Spatial
resolution
|
30 m, 10 m
|
|
Data
format
|
.shp,
.tif, .xlsx
|
|
Data
size
|
172 MB (Compressed
to a single file, 31.7 MB)
|
|
Data files
|
64
|
|
Foundation
|
Ministry of
Science and Technology of P. R. China (2017YFC0505900)
|
|
Data
computing enviroment
|
ENVI, ArcGIS
|
|
Data
publisher
|
Global Change Research Data Publishing &
Repository, http://www.geodoi.ac.cn
|
|
Address
|
No.
11A, Datun Road, Chaoyang District, Beijing 100101, China
|
|
Data
sharing policy
|
Data from the Global Change Research Data
Publishing & Repository includes metadata, datasets (in the Digital Journal of Global
Change Data Repository), and publications (in the Journal of Global
Change Data & Discovery).
Data sharing
policy includes: (1) Data are openly available and can
be free downloaded via the Internet; (2) End users are encouraged to use Data
subject to citation; (3) Users, who are by definition also value-added
service providers, are welcome to redistribute Data subject to written
permission from the GCdataPR Editorial Office and the issuance of a Data
redistribution license; and (4) If Data are used to compile new
datasets, the ??ten per cent principal?? should be followed such that Data
records utilized should not surpass 10% of the new dataset contents, while
sources should be clearly noted in suitable places in the new dataset[6]
|
|
Communication and
searchable system
|
DOI, CSTR, Crossref, DCI, CSCD, CNKI, SciEngine, WDS/ISC, GEOSS
|
in
recent years. The spectral data for the salt marsh vegetation in different
growth states were collected using an ASD FieldSpec 3 back-mounted spectrometer
with a spectral range of 350–2,500 nm. In addition, to avoid deviation of the
sample point selection caused by environmental changes, the high-precision
sample point data were supplemented with visual interpretation results for
high-resolution remote sensing Google Earth images.
Using the GEE
cloud platform, the radiometric calibration and atmospheric correction of the
Landsat 7/8 data and Sentinel-2 data, the terrain correction of the Sentinel-1
data, and the other preprocessing step were realized through coding. Based on
the multi-temporal characteristics and life history differences of wetland
plants, multiple time-series vegetation indices were calculated on an annual
average scale to form a temporal-spectral dimension feature set. The spatial-temporal
dimensional feature set was constructed by extracting the backscatter
coefficients from the Sentinel-1 data. According to the dynamic changes in the
vegetation distribution in the Yellow River Delta in recent years and the
quality and availability of the satellite data, we used the Sentinel-1 data to
perform co-classification of the temporal-spatial-spectral multi-dimensional features
from 2014 to 2020, and the temporal-spectral dimensional features for 1999–2013
were extracted based on historical Landsat time-series data.
Multi-dimensional
feature extraction makes full use of the temporal, optical, and spatial texture
features of the vegetation, which can effectively improve the accuracy of the
classification; however, the data redundancy caused by the higher dimensional
feature sets still creates some problems. In this study, recursive feature
elimination (RFE) was adopted to reduce the dimensionality of the feature sets,
eliminate the redundant bands, and obtain the best feature combination. The
implementation process of the RFE algorithm used in this study is summarized
below.
Step 1: Train a
random forest algorithm.
Step 2:
Calculate the importance measure of the permutation.
Step 3:
Eliminate the irrelevant variables.
Step 4: Repeat
steps 1 through 3 until the final set of features is obtained. The prediction
of the importance of a given variable??s permutation depends strongly on its
correlations with the other variables.
4 Data Results and Validation
4.1 Dataset Composition
This
dataset consists of the following data: (1) the spatial distribution of the
salt marsh vegetation in the Yellow River Delta from 1999 to 2020; (2) the
distribution frequency of S. alterniflora in the Yellow River Delta from
1999 to 2020; (3) the frequency data for S. salsa in the Yellow River
Delta from 1999 to 2020; and (4) the distribution frequency data for P.
australis in the Yellow River Delta from 1999 to 2020.
Among them, in
the spatial distribution data for the salt marsh vegetation in the Yellow River
Delta, the ??value?? field represents the different salt marsh vegetation classifications.
A value of 1 indicates S. alterniflora, a value of 2 indicates S.
salsa, and a value of 3
indicates P. australis.
4.2 Data Results
Based
on the multi-dimensional feature extraction method and random forest classification
algorithm established above, as well as the GEE big data processing platform,
Landsat TM/ETM+/OLI data, Sentinel-2 MSI optical images, and Sentinel-1 SAR
data for 2,068 scenes were used. A spatial-temporal distribution dataset of the
typical salt marsh vegetation in the Yellow River Delta from 1999 to 2020 was
obtained. The spatial resolution of the dataset was 30 m and 10 m, and its size
was 171 MB.
The Yellow River
Delta wetland is subject to the combined effects of both marine and Yellow
River runoff sediments, resulting in frequent alternating changes in the
erosion and deposition. Its ecosystem is sensitive and fragile, with frequent
vegetation succession[10]. Figure 1 shows the long time-series
distribution of the typical salt marsh vegetation in the Yellow River Delta.
The vegetation distribution has exhibited significant gradient distribution
characteristics, while the Yellow River Delta wetland remains in a highly
dynamic state. The main salt marsh vegetation in the study area, P.
australis and S. salsa, exhibited a banded pattern from the inland area to
the sea before the invasion of S.
alterniflora. The development of P. australis mainly extended along
the river, the vegetation evolved toward a more suitable salt environment,
i.e., along the river and toward the sea, and S. salsa became the
pioneer species in the intertidal sea transition zone. Under the disturbance of
the estuarine wetland ecosystem by the invasive species, the development and
evolution of the typical salt marsh vegetation in the Yellow River Delta have
developed new characteristics.
Since 2008, scattered S. alterniflora patches
have been observed at the coastal edge of the northern bank in the study area.
They successfully colonized seagrass beds, exhibiting strong environmental
adaptability, and rapidly expanded to occupy the intertidal niche, exhibiting
strong interspecies competitiveness. The area colonized reached 1,513.16 ha by
2013
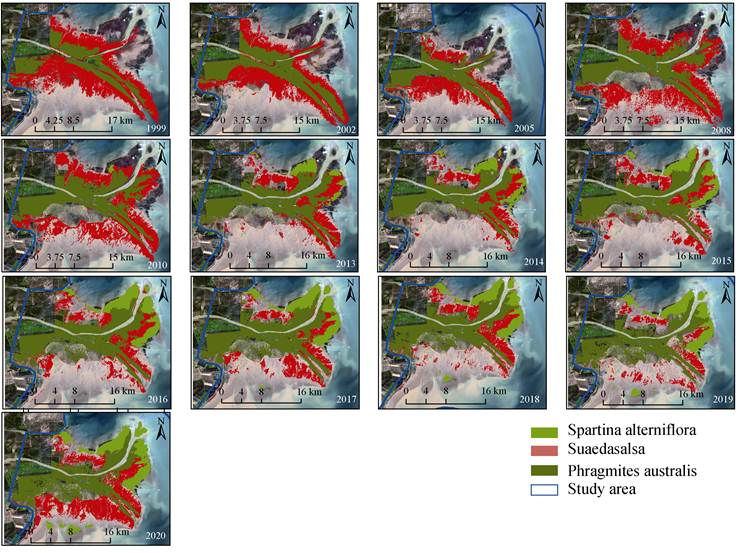
Figure 1 Spatial and temporal distributions of the
typical salt marsh vegetation in the Yellow River Delta (1999–2020)
|
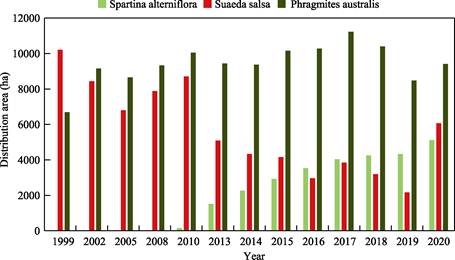
Figure 2 Statistics of typical salt marsh
vegetation area
|
(Figure 2). S. alterniflora occupied the
most favorable habitats in the coastal wetlands of the Yellow River Delta due
to its strong diffusion ability. In addition, the frequent human activities in
recent years have led to changes in the distribution structure of the native
vegetation communities such as S. salsa and P. australis, and the
native wetlands have been degraded to different degrees. P. australis
was mainly distributed along the current river channel of the Yellow River and
on both sides of the old channel of the Yellow River, extending to the
northeast along the current river channel and subsiding to some extent inland
along the old channel of the Yellow River. Although it was inferior to S.
alterniflora in the newly silted plain of the Yellow River estuary, its
main distribution was relatively stable. S. salsa was a pioneer plant in
the muddy tidal flat and high salinity area. However, the deposition and
erosion of the estuarine wetland in the Yellow River Delta has been rapid, and S. salsa grows poorly under the tidal
cycle. Thus, its stability was insufficient, and the area it occupied decreased
significantly.
S. alterniflora, with its
strong environmental adaptability, formed a large area of single colonies in
the southeast where the Yellow River enters the sea, with a total distribution
area of 2,459.09 ha. The colonization of S. alterniflora began in the southernmost
plain, and it rapidly expanded along the east-west direction. By 2020, four
spreading patches of S. alterniflora were distributed in an east-west
band on the southern coastal plain.
Figure 3 shows the
distribution frequency of the three typical salt marsh vegetation species.
Among them, the red areas had a high annual vegetation occurrence frequency,
representing the most suitable ecological niche for growth, while the light
green areas had a low growth frequency, and most of these areas were degraded
or newly expanded areas with unstable growth. The distribution range of S.
alterniflora was the smallest among the three plants, but the inter-annual
occurrence frequency of S. alterniflora was higher within the
distribution range, and the distribution range was mostly composed of stable
growth area and new expansion area. This is mainly due to the strong reproductive
capacity of S. alterniflora and its adaptability to wet and saline
environments. S. alterniflora can generate seeds in order to enter new
habitats through sexual reproduction and can form patches to realize the
spatial expansion of its population. Once colonization is successful, S. alterniflora
can rapidly grow suckering plants through asexual reproduction, and thus,
the patches of S. alterniflora can continuously expand and integrate and
can occupy the suitable ecological niche in a continuous peak-plane diffusion. S.
salsa was widely distributed in the coastal tidal flats, but its
distribution frequency was generally low, and most of the areas fluctuated
greatly or experienced obvious degradation between years. The stable
distribution area was mainly located in the central part of the tidal flat.
Although S. salsa was a pioneer plant in the muddy tidal flat and
heavily saline-alkali areas, its low plant structure and weak rhizomes made it
susceptible to environmental stress and lacking in competitive ability, resulting
in double inhibition from individual indicators to community indicators. P.
australis has a wide ecological range of growth and grows in the
interaction areas between freshwater, salt
water, and salt-fresh water regions. It was distributed in a long and narrow
strip along the river bank, extending to the estuary. Its distribution area was
also mostly within the stable growth area. According to the distribution
frequency of the salt marsh vegetation, in recent years, the regions
with a distribution frequency of ??70% were divided into ecological niches
suitable for the distribution of typical salt marsh vegetation in the study
area. The interannual fluctuations in the salt marsh vegetation in this region
were small and the occurrence frequency of the same vegetation type reached 70%
during the study period (Figure 4). The area of stable growth of P.
australis (7,720.41 ha) was the largest, followed by S. alterniflora (1,859.66
ha), and that of Suaeda salsa (859.26
ha) was the smallest.
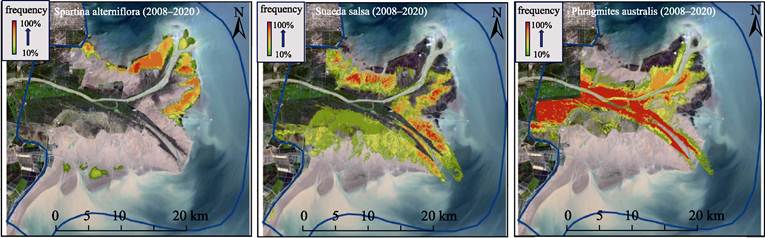
Figure 3 Distribution frequency of typical salt
marsh vegetation in the Yellow River Delta (1999–2020)
4.3 Data Validation
A confusion matrix was used
to verify the accuracy of the classification data for the typical salt marsh
vegetation in the Yellow River Delta. In the confusion matrix, the value of the
verification sample is compared with the value of the corresponding data
result, and an error matrix based on the measured data and the result data is
constructed. By calculating the
|
|
|
|
Figure 4 Stable niche distribution of typical
salt marsh vegetation in the Yellow River Delta from 1999 to 2020
|
Figure 5 Classification accuracy of typical salt
marsh vegetation in the Yellow River Delta from 1999 to 2020
|
quantitative
relationship between the number of correctly classified pixels and the number
of total pixels, various extraction accuracy indexes can be obtained. The
widely used overall accuracy (OA) and kappa coefficient were used to evaluate
and analyze the extraction accuracy of the typical salt marsh vegetation
dataset constructed in this study. The overall accuracy is defined as the ratio
of the total number of correctly classified pixels to the total number of
pixels, and it represents the classification accuracy of the overall pixels.
The kappa coefficient can be used to evaluate the quality of the classification,
and it can overcome the dependence on the samples and methods caused by using
only the accuracy analysis index described above. In addition, it can be used
to measure the accuracy of classification. The kappa coefficient was calculated
as follows:
 (1)
(1)
 (2)
(2)
where is the total classification accuracy, which is defined as the
sum of the correctly classified samples in each category divided by the total
number of samples; a1, a2,..., ac
denotes the real number of samples in each category; b1, b2,??,
bc denotes the predicted number of samples in each category; and
n is the total number of samples. In
this study, the time-series images for each year were classified using the GEE
platform. During the classification, 70% of the samples were randomly selected
to establish a random forest model, and the remaining 30% of the samples were
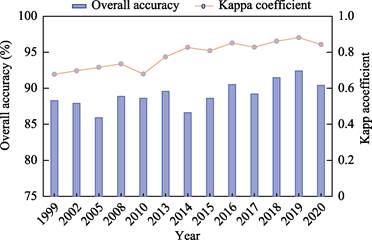
used to verify the results. Figure 5 shows the overall accuracy and kappa
coefficient of the typical salt marsh vegetation classification from 1999 to
2020. The overall accuracy ranges from 86% to 92.4%, and the kappa coefficient
ranges from 0.68 to 0.88. It can be seen that the classification method used in
this study achieved a satisfactory accuracy, and the effect is relatively
robust when it is applied to a long time series of data.
is the total classification accuracy, which is defined as the
sum of the correctly classified samples in each category divided by the total
number of samples; a1, a2,..., ac
denotes the real number of samples in each category; b1, b2,??,
bc denotes the predicted number of samples in each category; and
n is the total number of samples. In
this study, the time-series images for each year were classified using the GEE
platform. During the classification, 70% of the samples were randomly selected
to establish a random forest model, and the remaining 30% of the samples were
used to verify the results. Figure 5 shows the overall accuracy and kappa
coefficient of the typical salt marsh vegetation classification from 1999 to
2020. The overall accuracy ranges from 86% to 92.4%, and the kappa coefficient
ranges from 0.68 to 0.88. It can be seen that the classification method used in
this study achieved a satisfactory accuracy, and the effect is relatively
robust when it is applied to a long time series of data.
5 Discussion and Conclusion
In
this study, using the GEE platform, the morphological characteristics and
evolution differences of the different types of salt marsh vegetation were
fully considered. A total of 2068 Landsat TM/ETM/OLI, Sentinel-2 MSI optical
data, and Sentinel-1 SAR data were used to construct the multi-feature space
for the entire growth period, and the feature optimization algorithm of the
recursive feature elimination was used to eliminate the redundant features. The
classification of the data of typical salt marsh plant populations in the
Yellow River Delta from 1999 to 2020 was obtained using a random forest classification
algorithm, and the spatial and temporal distribution dataset for the typical
salt marsh vegetation was analyzed. Although the Yellow River Delta is the
youngest wetland ecosystem in the warm temperate zone in China and the
vegetation community is not fully developed and succinct, the coastal wetland
in the Yellow River Delta exhibits an obvious hierarchical structure along the
river to the sea. The rapid invasion of S. alterniflora occupied the
ecological niche of S. salsa, resulting in local geomorphic changes,
which directly and indirectly affected the original ecosystem. The temporal and
spatial distribution characteristics of the typical salt marsh vegetation in
the Yellow River Delta from 1999 to 2020 were analyzed to provide theoretical and
methodological support for the extraction of vegetation information in a wide
range of vulnerable estuaries and to provide a scientific basis for ecological
restoration and management of the Yellow River Delta protection area.
Author
Contributions
Gong,
Z. N. made a general design for the development of the dataset; Zhang, C. and
Hu, J. F. collected and processed the data, practical models and algorithms,
and verified the data. Hu, J. F. wrote data papers and so on.
Conflicts of
Interest
The
authors declare no conflicts of interest.
References
[1]
He, Y. L. The mechanism of
vegetation differentiation in the lower salt marsh of Yangtze River estuary
[D]. Shanghai: East China Normal University, 2014.
[2]
Wang, X. H., Li, Y. Z., Meng,
H., et al. Distribution pattern of
plant community in new-born coastal wetland in the Yellow River Delta [J]. Scientia Geographica Sinica, 2015,
35(8): 1021‒1026.
[3]
Zhang, C., Gong, Z. N., Qiu, H.
C., et al. Mapping typical Salt-marsh
species in the Yellow River Delta wetland supported by
temporal-spatial-spectral multidimensional features [J]. Science of the total environment, 2021, 783: 147061. DOI: 10.1016/j.scitotenv.2021.147061.
[4]
Zhang, G. H., Wang, R. Y.,
Zhao, G. X., et al. Extraction of
vegetation information in coastal ecological vulnerable areas from remote
sensing data based on phenology parameters and object-oriented method [J]. Transactions of the Chinese Society of
Agricultural Engineering, 2018, 34(4): 209‒216.
[5]
Hu, J. F., Gong, Z. N., Zhang,
C., et al. Spatial-temporal dataset of salt marsh
vegetation in Yellow River Delta (1999–2020) [J/DB/OL]. Digital Journal of Global Change Data Repository, 2022.
https://doi.org/10.3974/geodb.2022.01.06.V1. https://cstr.escience.org.cn/CSTR:20146.11.2022.01.06.V1.
[6]
GCdataPR Editorial Office.
GCdataPR data sharing policy [OL]. https://doi.org/10.3974/dp.policy.2014.05
(Updated 2017).
[7]
Wu, Y., Zhou, Z. F., Zhao, X., et al. Spatial-temporal variation of
vegetation coverage in plateau mountainous areas based on remote sensing cloud
computing platform: a case study of Guizhou province [J]. Carsologica Sinica, 2020, 39(2): 196‒205.
[8]
Breiman, L. Random forests [J].
Machine Learning, 2001, 45(1): 5‒32.
[9]
Ke, Y. C., Shi, Z. K., Li, P.
J., et al. Lithological
classification and analysis using Hyperion hyperspectral data and Random Forest
method [J]. Acta Petrologica Sinica,
2018, 34(7): 2181‒2188.
[10]
Zhang, X. L. The enviromnental
change and degradation of modern Ye1low River Delta coastal wetland [D]. Qingdao:
Ocean University of China, 2015.
[11]
Zong, M., Han, G. Q., Li, Y. Z., et al. Predicting the potential
distribution species of the coastal wetland in the Yellow River Delta, China
using MaxEnt model [J]. Chinese Journal
of Applied Ecology, 2017, 28(6): 1833–1842. DOI:
10.13287/j.1001-9332.201706.017.
[12]
Chen, K. X., Cong, P. F., Qu,
L. M., et al. Simulation of dynamic
changes and diffusion of typical vegetation populations in coastal wetlands in
the Yellow River Delta. [J]. Journal of
Beijing Normal University (Natural
Science), 2021, 57(1): 128–134.
[13]
Wang, S. X., Han, L. S., Yang,
J. An improved method of combining multi-indicator desertification classification
[J]. Bulletin of surveying and mapping,
2021(4): 8–12. DOI: 10.13474/j.cnki.11-2246.2021.0102.