Ecological Value Analysis Based
on Land Use Change in Liuhe District
of Nanjing, China (2009, 2019)
Wang, B.1 Liu, D. Y.2*
1. Nanjing Academy of Urban Planning & Design Co. Ltd, Nanjing
210005, China;
2. State Key Laboratory of Soil and Sustainable Agriculture,
Institute of Soil Science, Chinese Academy of Sciences, Nanjing 210008, China
Abstract: The ecological value refers to the valuation of ecosystem services, which
includes the value of market functions (i.e., economic value) and the shadow
value of non-market functions (i.e., natural value). Given that different
land-use patterns result in varied service values, this study investigated
recent urban and rural spatial changes in the Liuhe district of Nanjing, China,
over a 10-year period, especially driven by the state-level new area strategy.
Using Landsat TM data, spatial datasets of land use in 2009 and 2019 were
obtained by image interpretation. Costanza??s natural value estimation method
was applied to calculate the profits and losses of ecological value caused by land-use
change. From 2009 to 2019, the expansion of construction space (residential/service
land, industrial/mining land, and transportation/other land) led to a decrease
of 3.3% in the natural value of the whole district. According to the strong
sustainable development principle of ??natural value cannot be reduced??, the Liuhe
district is deemed to be in a weak state of sustainable development.
Considering the ecological value of non-construction space (water area,
woodland, wetland, grassland, and cultivated land), the ??uneconomical?? phenomenon
was investigated under the logic of ??economic civilization?? in urban and rural
spatial expansion. The ratio of ecological value between non-construction and
construction spaces increased from 1??5 to 1??3, indicating that
the comprehensive benefits of construction space are no longer prominent.
Accordingly, it is necessary to limit the occupation of non-construction space
such as water area by the extensive expansion of urban and rural construction
land.
Keywords: state-level new area; land-use change; ecological profit and loss; Liuhe
district; Nanjing city
Dataset
Available Statement:
The dataset supporting this paper
was published at: Wang, B., Liu, D. Y. Dataset of land use and its ecological
value assessment in Liuhe district of Nanjing city (2009, 2019) [J/DB/OL]. Digital Journal of Global
Change Data Repository, 2020. DOI: 10.3974/geodb.2020.05.17.V1.
1 Introduction
Through the period of industrial civilization, both the
quality of the ecological environment and the efficiency of resource
utilization have declined in some regions of China, rendering a disharmonious
relationship between man and nature. The prime reason for this situation is
that most of the contribution that ecosystem services make to human welfare is
purely public welfare, without directly increasing human welfare in the form of
a monetary economy. In many cases, people are not even aware of the existence
of ecosystem services[1?C3].
It
should be recognized that the estimation of ecological value, especially the
natural value, is a problematic issue worldwide. Since the concept of ecosystem
service was first proposed by the ??Study of Critical Environmental Problems??in 1970[4?C5], many ecologists,
economists, and policy makers have carried out many research works. In 1997,
Costanza et al. [1]
published the article, ??The value of the world??s ecosystem services and nature
capital?? in Nature, which had great
repercussions felt globally. Costanza et
al.[1] divided the global
ecosystems into 16 categories, such as woodland, grassland, and cultivated
land, while their services were divided into 17 categories, such as gas
regulation, climate regulation, water regulation, and soil formation.
Subsequently, the value of global ecosystem services was estimated, showing
that the average annual value of the global biosphere ??industry?? was 33
trillion US dollars, equivalent to 1.8 times gross national product (GNP) of
the same period. Later, Zong et al.[6]
(2002) analyzed the value structure of regional ecosystem services in Lingwu city
of Ningxia, China, thereby extending Costanza et al.??s work from the simple estimation of natural value to the comprehensive
estimation of natural value and economic value. It was pointed out that an
increase or decrease in the natural value ought to serve as the core index to
measure whether a town or a region can realize sustainable development, which
in so doing must meet the requirements of the strong sustainable development
principle of ??natural value cannot be reduced??[7?C8].
In follow-up research??essentially following Costanza??s theoretical framework
but combining it with the actual situation in China??the ecological value
coefficient of various ecosystems has been revised[9?C11],
while the changes in ecological value caused by land-use changes have been
extensively explored[12?C18].
On
June 27, 2015, the State Council officially approved the establishment of
Jiangbei new area in Nanjing city, Jiangsu province. Located north of the
Yangtze River, Jiangbei includes parts of Liuhe district and Pukou district, with
a planning area of 788 km2[19].
Meanwhile, Jiangbei and its surrounding rural areas are coordinated as a whole,
encompassing a total area of 2,451 km2 (Figure 1). Jiangbei is being
positioned not only as an independent innovation pilot area, a new urbanization
demonstration area, and a modern industrial agglomeration area in the Yangtze
River Delta, but also as a pivotal platform for the cooperation and opening up of the Yangtze River Economic Belt (together
referred to as ??Three Zones and One Platform??). Liuhe district, as an
integrated development area within the
planning and coordination scopes of Jiangbei, has always been the leading
functional area of eco-tourism and agricultural development in Nanjing. At least
80% of its territory is cultivated land, water area, and woodland, and the
proportion of these three land-use types in 2019 totaled 83.54%[20-21]. In recent years, the pace
of urban construction has accelerated in Jiangbei under the guidance of the
state-level new area strategy. The subcentral city of Liuhe and the new town of
Longpao have since become urban areas with highly dense populations and
developed economic and industrial activity next to the central city of Jiangbei
within the scope of the new area, which has driven reductions in the availability
of non-construction land. Therefore, the establishment of ecological values and
their accounting, together with the coordination of ecological protection and
urban construction, are keys to achieving a high-quality development of Liuhe
district.
|
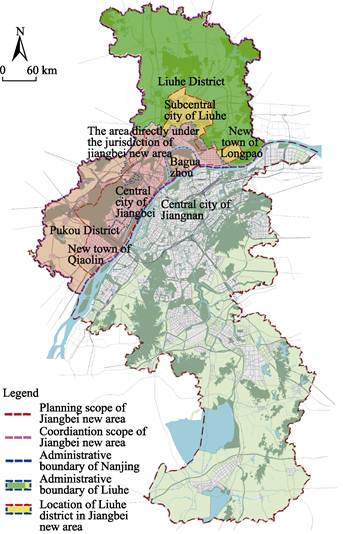
Figure
1 Location of Liuhe
district and state-level Jiangbei new area in Jiangsu province, China
|
Given
that different land-use patterns result in varied service values, this study
investigated the profits and losses of ecological value in the Liuhe district
of Nanjing over the past 10 years, especially driven by the state-level new
area strategy. Spatial datasets of land use were obtained via image
interpretation based on Landsat TM data. Ecological values of different
ecosystems were comprehensively assessed based on international natural value
estimation methods[1?C3] combined
with domestic comprehensive capital estimation methods. Considering the
ecological value of non-construction space (water area, woodland, wetland,
grassland, and cultivated land), the ratio of ecological value between
non-construction and construction spaces has increased over time from 1??5 to 1??3. Hence, we advise that further occupation by urban and
rural construction land of remaining non-construction space such as water area
should be restricted.
2 Metadata of the Dataset
The metadata summary of the dataset[22] are listed in Table 1.
Table 1 Metadata summary of the dataset
|
Items
|
Description
|
|
Dataset full name
|
Dataset
of land use and its ecological value assessment in Liuhe district of Nanjing city
(2009, 2019)
|
|
Dataset
short name
|
LandUseEcologicalValueAssessmentLiuhe
|
|
Authors
|
Wang, B.
AAZ-3013-2020, Nanjing Academy of Urban Planning & Design Co., Ltd,
279813263@qq.com
Liu, D. Y.
AAZ-2671-2020, State Key Laboratory of Soil and Sustainable Agriculture, Institute
of Soil Science, Chinese Academy of Sciences, dyliu@issas.ac.cn
|
|
Geographical
region
|
Liuhe
district of Nanjing city, Jiangsu province, China
|
|
Year
|
2009,
2019 Temporal
resolution 10 years
|
|
Spatial
resolution
|
30 m Data
format .adf,
.xlsx
|
|
Data size
|
2.47 MB
(940 KB after compression?? Data files 36 documents
|
|
Foundation
|
National
Natural Science Foundation of China (41977049)
|
|
Computing
environment
|
ArcGIS
|
|
Data
publisher
|
Global
Change Research Data Publishing & Repository, http://www.geodoi.ac.cn
|
|
Address
|
No. 11A
Datun Road, Chaoyang District, Beijing 100101, China
|
|
Data
sharing policy
|
Data from the
Global Change Research Data Publishing & Repository includes metadata, datasets (in the Digital Journal of Global Change Data Repository), and publications
(in the Journal of Global Change Data & Discovery). Data
sharing policy includes: (1) Data are openly available
and can be freely downloaded via the Internet; (2) End users are encouraged
to use Data, subject to citation; (3) Users, who are by
definition also value-added service providers, are welcome to redistribute Data, subject
to written permission from the GCdataPR Editorial Office and the issuance of
a Data redistribution license, and; (4) If Data are
used to compile new datasets, the ??ten percent principal?? should be followed,
such that Data records utilized should not surpass 10% of the
new dataset contents, while sources should be noted in suitable places in the
new dataset[23]
|
|
Communication and searchable system
|
DOI, DCI,
CSCD, WDS/ISC, GEOSS, China GEOSS, Crossref
|
3 Research Area and
Data Development Methods
3.1 Research Area
Liuhe
district has distinct natural resources and cultural characteristics. Situated
between the Yangtze River and Chuhe River, its northern hills are undulating.
Going from north,
natural mountains and rivers give
way to a geological garden area and subcentral city in the middle, with a wetland
polder area and new town in the south. Its northern part is one of the two
garden areas in Nanjing, constituting both an ecological protection and
suburban urban-rural integration development area. In the central and southern
area, the part west of the ring expressway is a highly urbanized metropolitan
area built within a 40-km radius of the Najing center??Xinjiekou, while the part
east of the ring expressway is home to a riverside ecological protection and
suburban urban-rural integration development area (Figure 2). The new version
of the master plan puts forward the overall pattern of ??northern-southern
gardens, central metropolis, riverside development, and urban-rural integration??[20]. The Chuhe River basin, wherein Liuhe
district is located, has been a vital place for human settlement in prehistoric
and ancient times. Liuhe is also the main producing area of Yuhua stone, which
is a national treasure given by nature and uniquely found in China. It is also
the birthplace of the Jiangsu folk song ??Jasmine Flower??.
3.2 Data
Development Methods
|
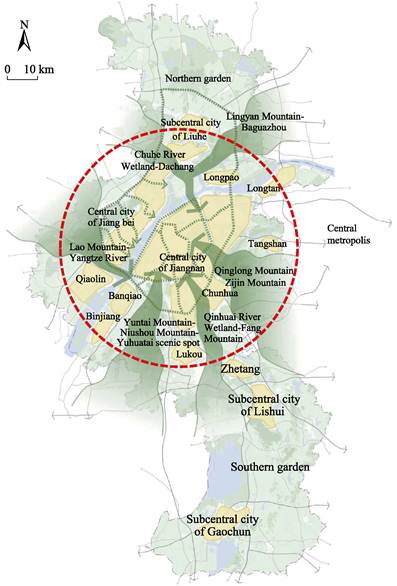
Figure 2 Spatial structure
planning of Nanjing[20]
|
3.2.1 Land-use Quantity and Its Distributional Changes
(1) Analyzing land-use quantity and its distributional
changes
The
quantity of land resources available determines its degree of scarcity. First,
their changes in quantity can be gauged by the total areas of different
land-use types. Through analyzing the total change undergone for one or more
land-use types, we can grasp the general trend of land-use changes over time
and space. Second, such changes could be conveyed also in terms of per capita
change of differing land-use types, which can more directly reflect
quantitative changes in land use.
According to the ??Classification of land use status??[24]
and considering the characteristics of Liuhe district, we divided
the land-use types providing ecosystem services into eight categories:
cultivated land, woodland, wetland, grassland, water area, residential/service
land, industrial/mining land, and transportation/other land. Based on Landsat
TM images from 2009 and 2019, the data on land-use change in Liuhe district
over a 10-year period were obtained, by using ArcGIS v10.5 (ArcGIS, ESRI Inc.,
Redlands, CA, USA) to georeference, cut grids, and identify the pertinent land
use types. To compare the changes in the spatial distribution of land use, both
the statistical yearbook of Liuhe district[25?C26]
and Nanjing??s annual report of urban planning[27?C28] were queried to
extract supervision data of land-use classification and other comparative reference
data.
(2) Analyzing changes in land-use structure
Given
the close correlation between economic structure, land-use structure, and ecosystem
service function, investigating the structure-function relationship can better
fulfill the role of land use as a macroeconomic means.
The land-use dynamic index (LUDI) expresses the change
in the area of a certain land-use type per unit time; that is, the change
rate of this given land-use type in area. It is calculated as follows:
 (1)
(1)
where Ua and
Ub represent
the area (km2) of a certain land-use type at time a and b, respectively, and T is
the length of the study period, from time a
to time b. When T is in years, LUDI represents the annual change rate of this
land-use type in area.
3.2.2 Ecosystem Service Classification System
The value of regional ecosystem services was divided into
two components (natural value and economic value) with a total of 24 items
based on the theoretical framework of Costanza et al.[1] and informed by localized estimation
experience of Zong et al.[6],
coupled to the actual situation in Liuhe district. The natural value comprised
12 items, gas regulation, climate regulation, interference regulation, water
regulation, water supply, erosion prevention, soil formation and nutrient
cycling, environmental protection, waste treatment, pollination, biological
pest control, and habitat (shelter). The economic value also comprised 12
items, agricultural value, forestry value, animal husbandry value, aquatic
product value, industrial value, construction industry value, transportation
and storage value, wholesale and retail value, accommodation and catering
value, financial industry value, real estate industry value, and tourism and
other service industry value.
3.2.3 Ecological Value Estimation Methods
According to the current statistical caliber, this study
considered the economic value while paying special attention to the natural value
of ecosystem services. To do this, important non-market regulation and
purification functions plus habitat and life support functions were taken into
account by a specific estimation method, for which ??the natural value cannot be
reduced?? is the principle of strong sustainable development of urban and rural areas[7?C8]. Based on land-use data and
ecological value accounting theory, the ecological value per unit area (Yuan??hm‒2??a‒1)
was estimated; then, the ecological value was calculated for 2009 and 2019
based on the total areas of various ecosystem types present in the region in
each year[1?C3].
(1) Estimating natural value
Natural
value is mainly provided by cultivated land, woodland, wetland, grassland, and
water area. The natural value coefficient of 12 ecological services[1?C3]
was used to derive the natural value of ecosystem service per unit area, after
corrections. To ensure the consistency between natural value and economic value
estimations, 1997 was taken as the benchmark year. The 1997?C2019 data were
obtained from the ??Nanjing Statistical Yearbook?? [29?C30] to
calculate the consumer price index of Nanjing in 2019, which was
144.2 (it was 100 in 1997). Based on this, the global universal value
coefficient of Costanza et al. in
1997 could then be converted into the value coefficient of Nanjing region in
2019.
(2) Estimating economic-social value
Economic value mainly refers to the economic production
function of ecosystems, that is, those marketized products or utility as
provided by different ecosystems. Traditional statistical methods mainly infer
economic value from GNP. To avoid repeated calculations, this study classified
the economic value of a give ecosystem according to its corresponding land-use
types. In this way, agricultural value belonged to cultivated land, and
likewise forestry value to woodland, animal husbandry value to grassland and
cultivated land, aquatic product value to water area and wetland, industrial
value and part of construction industry value to industrial and mining land,
and transportation and storage value to transportation and other land.
Similarly, for the values of wholesale and retail industry, accommodation and
catering industry, financial industry, real estate industry, tourism and other
service industries, and part of the value of construction industry, they all
belonged to residential and service land. The economic-social value of ecosystem
service per unit area (104 Yuan??hm‒2??a‒1) was
then calculated as follows:
 (2)
(2)
where Vi
is the economic-social value per unit area of industry i (104 Yuan??hm‒2??A‒1), Gi is the gross domestic
product (GDP: 104 Yuan), and Si
is the area of industry i (hm2).
4 Results and Validation
4.1 Data
Products
The dataset includes spatial data and table data. The
spatial data include land use data in 2009 and 2019, with 30 mspatial resolution . The table data include: (1) area and proportion
of different land-use types in 2009 and 2019; (2) LUDI from 2009 and 2019; (3)
natural value of ecosystem services per unit area in 2019; (4) economic value
of ecosystem services per unit area in 2019; (5) ecological value of different
ecosystem types in 2009 and 2019. The dataset is archived in ArcGIS Grid (.adf)
and .xlsx data format, which consists of 36 data files with data size of 2.47
MB (compressed to 931 KB in one file).
|
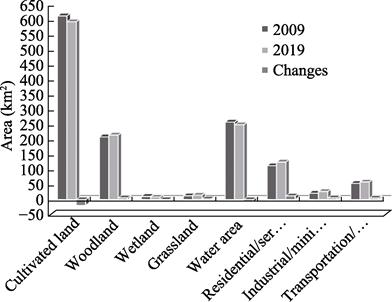
Figure 3 Changes of land-use area in Liuhe district of Nanjing from 2009 to
2019
|
4.2 Data
Results
4.2.1 Spatial Changes of Land Use in Liuhe district
(1) Quantitative changes of land use
From 2009 to 2019, the residential/service
land, industrial/mining land, transportation/other land, woodland, and
grassland all increased in total area, while the water area, wetland, and cultivated
land each decreased (Figure 3). The per capita land area* decreased from 0.21 hm2 in 2009 to
0.18 hm2. In particular, the cultivated land area for human survival
has been reduced by 20%, from 0.10 hm2 to 0.08 hm2, while
the per capita residential/service land remained stable, at 0.018 hm2.
Therefore, if we continue to follow the traditional path of urbanization, Liuhe
district will face the pressure of cultivated land protection.
(2) Distributional changes of land use
After
conducting the spatial overlap analysis, it was evident that the expansion of urban
construction space was mainly concentrated in the Liuhe subcentral city. The expansion
of living space and spread of economic development zone go together. Influenced
by ecological restoration strategy, the woodland and grassland increased in the
northern and central-northern areas (Figure 4?C6).
(3) Structural change of land use
From 2009 to 2019, the cultivated land showed the largest
range of change, followed by that of water area. The proportion of these two
land-use types out of total land use declined from 67.33% (2009) to 65.12%
(2019), with an absolute decrease of 2.21%. Corresponding to that decrease, the
residential/service land, industrial/ mining land, and transportation/other
land together increased by 1.76% over the past decade (Figure 7).
According to the LUDI
of various land-use types, the annual change rates of industrial/mining land
(?C0.026) and wetland (0.02) spanning the 10 years were the greatest, followed
by grassland (?C0.018), residential/service
land (?C0.011), transportation/other land
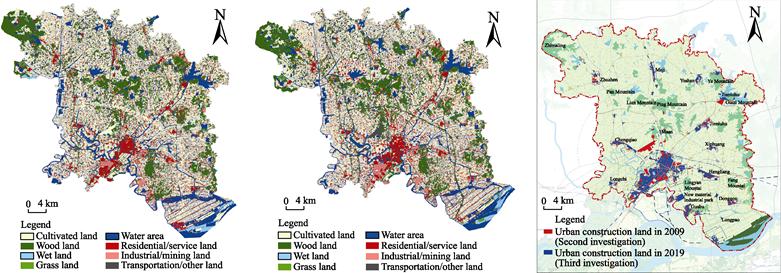
|
Figure
4 Land
use map of Liuhe district in 2009
|
Figure 5 Land use map of Liuhe district in 2019
|
Figure 6
Spatial changes of Liuhe district
construction from 2009 to 2019
|
|
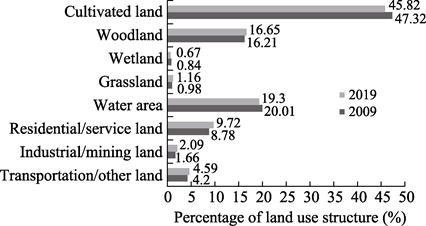
Figure 7 Changes
of land-use structure in Liuhe district of Nanjing from 2009 to 2019
|
(?C0.009), and least for water area (0.004), woodland
(?C0.003), and cultivated land (0.003). The primary reason for the pronounced
annual change rate of industrial/mineral land is that the manufacturing
industry- bearing function has been strengthened. There are three major reasons
for the moderate increases found in residential/service land, and transportation/other
land. First, the
central urban area of Nanjing has formed a closed loop of coordinated
development, which is beneficial for Liuhe to undertake the functional spillover
from city center. Second??the construction of Liuhe subcentral city as an
??magnetic?? center has sped up. Third, the economy in Jinniuhu plate has
achieved a frog-leap development. In contrast, the growth of woodland and
grassland is mainly due to the restoration of northern garden areas in Nanjing.
4.2.2 Ecological Value Profits and Losses in Liuhe district
(1) Natural value and economic value
The natural value of ecosystem service per unit area is
presented in Table 2. Evidently, the total natural value of wetland was the
highest. Considering the economic value of ecosystem service per unit area,
that of industrial/mining land was the largest; the economic values of wetland,
water area, and woodland were all relatively low (Table 3).
Table
2 Natural value of ecosystem service in Liuhe district of Nanjing in
2019 (104 Yuan??hm‒2??a‒1)
|
Ecosystem types
|
Gas regulation
|
Climate
regulation
|
Disturbance regulation
|
Water regulation
|
Water supply
|
Erosion control
|
Soil formation
|
Nutrient cycling
|
Waste treatment
|
Pollination
|
Biological control
|
Habitat/shelter
|
Total value
|
|
Woodland
|
?C
|
0.17
|
0.003
|
0.003
|
0.004
|
0.12
|
0.013
|
0.44
|
0.12
|
?C
|
0.003
|
0.28
|
1.156
|
|
Grassland
|
0.01
|
?C
|
?C
|
0.004
|
?C
|
0.05
|
0.001
|
?C
|
0.12
|
0.03
|
0.03
|
0.26
|
0.505
|
|
Wetland
|
0.16
|
?C
|
5.44
|
0.03
|
4.56
|
?C
|
?C
|
?C
|
5.01
|
?C
|
?C
|
0.38
|
15.58
|
|
Water area
|
?C
|
?C
|
?C
|
6.52
|
2.54
|
?C
|
?C
|
?C
|
0.81
|
?C
|
?C
|
0.26
|
10.13
|
|
Cultivated land
|
?C
|
?C
|
?C
|
?C
|
?C
|
?C
|
?C
|
?C
|
?C
|
0.02
|
0.03
|
?C
|
0.05
|
Notes: ?? Data were derived from Costanza
et al.[1?C3]. In 1997, the
official exchange rate of US dollar to the RMB was 1: 8.3. ?? Costanza et al. did not assign value to the
function of habitat (shelter) when calculating the ecological value of
woodland, grassland, or water area. Here, the mean value of wetland and estuary
was used to revise the natural value coefficient of habitat (shelter) of
woodland, grassland, and water area. ?? In 2000, the average per unit area values[9]
of woodland and cultivated land were 18,789 and 13,054 Yuan??hm?C2,
respectively; the consumer price index of Nanjing was
98.6 (100 in 1997), whose conversion into per unit area values of woodland and
cultivated land in 1997 were 19,056 and 13,240 Yuan??hm?C2. In 2019,
the per unit area values of woodland and cultivated land were 27,479 and 19,093
Yuan??hm?C2. When calculating the ecological service value later, the
revised data shall be used.
Table
3 Economic value of
ecosystem service in Liuhe district of Nanjing in 2019 (104 Yuan??hm‒2??a‒1)
|
Ecosystem types
|
Cultivated
land
|
Woodland
|
Wetland
|
Grassland
|
Water area
|
Residential/ service land
|
Industrial/
mining land
|
Transportation/ other land
|
|
Economic value
|
8.25
|
1.92
|
4.28
|
6.5
|
4.28
|
199.13
|
559.44
|
6.05
|
(2) Profits and losses of ecological
value
The ecological values of different ecosystem
types (Table 4) were obtained based on the ecological value per unit area of
each ecosystem type, multiplied with the total area. By analyzing the results
of ecological value accounting, the profits and losses of ecological value from
2009 to 2019 were derived.
Table 4 Ecological values of different ecosystems in Liuhe district of Nanjing (108
Yuan??a‒1)
|
Ecosystem types Year
|
Cultivated
land
|
Wood
land
|
Wetland
|
Grassland
|
Water area
|
Residential /service land
|
Industrial/mining land
|
Transportation/other land
|
Total value
|
|
Ecological
value
|
2009
|
62.29
|
9.81
|
2.17
|
0.89
|
37.35
|
226.59
|
120.22
|
3.29
|
462.61
|
|
2019
|
60.32
|
10.07
|
1.73
|
1.06
|
36.03
|
250.74
|
151.78
|
3.59
|
515.32
|
|
Natural
value
|
2009
|
11.71
|
5.78
|
1.70
|
0.06
|
26.26
|
?C
|
?C
|
?C
|
45.51
|
|
2019
|
11.34
|
5.93
|
1.36
|
0.08
|
25.33
|
?C
|
?C
|
?C
|
44.04
|
|
Economic
value
|
2009
|
50.58
|
4.03
|
0.47
|
0.83
|
11.09
|
226.59
|
120.22
|
3.29
|
417.10
|
|
2019
|
48.98
|
4.14
|
0.37
|
0.98
|
10.70
|
250.74
|
151.78
|
3.59
|
471.28
|
(i) The total natural value of various ecosystems decreased
from 4.551 billion Yuan in 2009 to 4.404 billion Yuan in 2019, with a decrease
of 147 million Yuan. The increasing occupation of surrounding cultivated land,
water area, and wetland by urban and rural construction land, continuously
drove down the natural value of these three ecosystems on yearly basis. In
contrast, thanks to the increase in woodland area, its natural value rose from
578 million to 593 million Yuan. However, the natural value still decreased by
3.3%. According to the principle of ??natural value cannot be reduced??, it??s in
a weak sustainable development state. Therefore, it is necessary
to conserve the existing woodland and constrain the transfer of land use from cultivated
land and water to construction area as far as possible.
(ii) The total economic value of various ecosystems
increased from 41.710 billion Yuan in 2009 to 47.128 billion Yuan in 2019,
amounting to a net increase of 5.418 billion Yuan. This increase mainly arose
from increased urban and rural construction land areas. The economic value of
residential/service land increased from 22.659 billion to 25.074 billion Yuan,
as did the economic value of industrial/mining land (from 12.022 billion to
15.178 billion Yuan). The economic values of cultivated land, water area, and
wetland all gradually fell due to considerable displacement of these ecosystems
by urban and rural construction land.
(iii) The total ecological value of various ecosystems
increased from 46.261 billion Yuan in 2009 to 51.532 billion Yuan in 2019,
representing a net increase of 5.271 billion Yuan. Of this, natural value and
economic value accounted for 9.84% and 90.16% (in 2009) and 8.55% and 91.45%
(in 2019), respectively. The proportion of natural value has continuously shrunk, a trend which suggests that the expansion of urban
and rural construction land is unavoidably accompanied by the loss of natural
value (e.g., cultivated land and water area).
(iv) In
2009, the total natural value of various ecosystems (4.551 billion Yuan) accounted
for 10.91% of their total economic value (41.710 billion Yuan). In 2019, the
total natural value (4.404 billion Yuan) accounted for 9.34% of their total
economic value (47.128 billion Yuan). In the past decade, the ratio of natural
value to economic value has decreased from one-ninth to one-tenth,
demonstrating that the expansion of urban and rural construction land has
impaired the values of ecosystem services. Therefore, in the process of
economic accounting, we should not only consider the growth of economic value,
but also the parallel loss of natural value, so as to reflect the realeconomic growth .
(v) Considering
different types of ecosystems, non-construction space (water area, woodland,
wetland, cultivated land, and grassland) plays vital role in sustaining life
support systems. The natural value of wetland per unit area is the largest,
followed by water area, woodland, cultivated land, and grassland. When considering
economic values, those of construction space (residential/service land,
industrial/mining land, and transportation/other land) are dozens of times
greater than those of woodland and water area. Therefore, in the development of
urban and rural construction land, the potential value of woodland and water
area is overlooked, resulting in a loss of natural value. When comprehensively
assessing the relationship between the economic value and natural value of each
ecosystem, the economic value of non-construction space in 2009 accounted for
19.1% of the economic value of construction space; this ratio fell to 16.1% in
2019. However, considering both the natural value and
economic value, the ecological value of non-construction space accounted for
32.2% of the ecological value of construction space in 2009, but 26.9% in 2019.
Therefore, concerning the non-market
valuation of ecosystems, the ratio of ecological value between non-
construction and construction spaces has risen from 1??5 to 1??3. Hence, the comprehensive
benefits of urban and rural construction land are no longer
prominent. Accordingly, it is necessary to
limit the occupation of non-construction space including cultivated land, woodland,
and water area by further extensive expansion of urban and rural construction
land.
4.3
Date Validation
Taking Lingwu of Ningxia as an example, Zong et al. (2002)[6] extended the
simple estimation of natural value by Costanza et al.[1] and derived a comprehensive estimation of
natural value and economic value. Here, we verified our results by comparing
them with the data from Lingwu. From 1990 to 1997, due to industrial
development in Lingwu, especially five types of small enterprises (including
chemistry and metallurgy), the loss of natural value
became increasingly prominent, with an annual decrease of 4% on average. In
terms of the ecological value, its rate of increase lagged behind that of GDP
in Lingwu. From 2009 to 2019, driven principally by the state-level new area
strategy, the city-industry integration of Liuhe subcentral city accelerated,
resulting in a concomitant greater loss of natural value marked by an average
annual decrease of 3.4%. The growth rate of ecological value was also lower
than that of GDP. It should be pointed out that because of different regions
and time periods, especially the distinct stages of regional urbanization, the
comprehensive estimation of ecological value is partially influenced by the estimation
of economic-social value; hence, certain differences are perhaps inevitable between
the present and previous studies.
Considering that differing land-use patterns in varied
service values, this study explored the urban and rural spatial changes in Liuhe
district in the last 10 years, especially driven by the state-level new area
strategy. The profits and losses of ecological value caused by land-use changes
were analyzed by refining the service as far as possible based on Costanza??s
and other value accounting methods. The findings could provide timely support
for measuring regional sustainable development.
The
results indicate that the expansion of construction space has led to 3.3% reduction
in the natural value, rendering the whole district in a weak sustainable development state. Considering the ecological
value of non-construction space, this study analyzed the ??uneconomical??
phenomenon under the logic of ??economic civilization?? in urban and rural spatial
expansion. As the ratio of ecological value between non-construction space
(represented by five ecosystems) and construction space (represented by three
ecosystems) has increased from 1??5 (simple estimation of economic value) to 1??3, the comprehensive benefits of construction
space are no longer prominent in the study area.
The
accounting of ecological value for each type of ecosystem includes both natural
value and economic value. Specifically, the natural value is the potential
value of the ecosystem, which cannot be marketized. Through our estimations, we
find that under the influence of traditional values, economic indicators are
rather incomplete. If economic indicators are solely relied upon for
decision-making, it would lead to a waste of resources and the destruction of
ecosytems.
Further,
the significance of this study lies in reviewing the ??economic civilization??
logic of urban and rural spatial expansion??and unveiling the
??uneconomical?? aspects hidden within ??economic civilization??. Under a revamped
logic centered on ??ecological civilization?? in the new era, land space
development that maximizes ecological value while maximizing comprehensive
benefits should be carried out in a carefully planned, step-by-step manner.
Due
to the diversity and complexity of ecosystem services, it is challenging to
achieve comprehensive and accurate assessments of ecological value.
Nevertheless, it is a laudable and correct
process to estimate the minimum value of ecological service by referring to leading
research practices in China and elsewhere. This study, however, did not consider the disastrous losses caused by emergencies
in natural, economic, and social processes, nor the impacts of various
bottlenecks, threshold effects, and abrupt events on valuations.
Author
Contributions
Wang,
B. developed the frame of the dataset. Wang, B. and Liu, D. Y. designed dataset
processing. Wang, B. designed the models and algorithm. Liu, D. Y. performed
the data verification. Wang, B. wrote the data paper.
References
[1]
Costanza, R.,
d??Arge, R., de Groot, R., et al. The
value of the world??s ecosystem services and nature capital [J]. Nature, 1997, 387: 253?C260.
[2]
Costanza, R.,
d??Arge, R., de Groot, R., et al. The
value of ecosystem services: putting the issues in perspective [J]. Ecological Economics, 1998, 25(1): 67?C72.
[3]
Costanza, R.,
d??Arge, R., de Groot, R., et al. The value of the world??s ecosystem
services and nature capital [J]. Chinese
Journal of Ecology, 1998, 18(2): 70?C78.
[4]
Turner, K.
Economics and wetland management [J]. Ambio,
1991, 20(2): 59?C63.
[5]
Kellert, S.
R. Assessing wildlife and environmental values in cost-benefit analysis [J]. Joural of Environmental Management, 1984,
18: 4.
[6]
Zong, Y. G., Zhou, S. Y., Wen L., et
al. Assessment with eco-economic valuation of sustainable development of a regional
ecosystem: a case study of Lingwu city, Ningxia [J]. Acta Ecologica Sinica, 2002, 22(10): 1573?C1580.
[7]
Pearce, D. W,
Warford, J. J. World without End Economics, and Sustainable Development [M]. Oxford:
Oxford University Press, 1993.
[8]
Pearce, D. W.,
Atkinson, G. D. Capital theory and the measurement of sustainable development:
an indicator of ??weak?? sustainability [J]. Ecological
Economics, 1993, 8(2): 103?C108.
[9]
He, H.,
Pan, Y. Z., Zhu, W. Q., et al. Measurement
of terrestrial ecosystem service value in China [J]. Chinese Journal of Applied Ecology, 2005, 16(6): 1122?C1127.
[10]
Xie, G. D.,
Zhang, C. X., Zhang, L. M., et al. Improvement
of the evaluation method for ecosystem service value based on per unit area [J].
Journal of Natural Resources, 2015, 30(8):
1245?C1246.
[11]
Wu, Q.,
Peng, Y. Y., Ma, H. Y., et al. Research
on the value of forest ecosystem services and compensation in a Pinus massoniana
forest [J]. Acta Ecologica Sinica, 2019,
39(1): 117?C130.
[12]
Peng, W.
F., Zhou, J. M., Yang, C. J., et al.
Research on ecosystem service values based on land use change in Sichuan
province [J]. Resources and Environment
in the Yangtze Basin, 2014, 23(7): 1053?C1062.
[13]
Bai, Z. L.,
Bao, A, M, Chang, C., et al. Impacts
of land use change on ecosystem services value in the Ebinur lake basin [J]. Bulletin of Soil and Water Conservation,
2013, 33(1): 167?C173, 177.
[14]
Liu, Y. Q.,
Liao, L. W., Long, H. L., et al. Effects
of land use transitions on ecosystem services value: a case study of Hunan
province [J]. Geographical Research, 2015,
34(4): 691?C700.
[15]
Gao, Y.
M., Sun, H. L. Ecological service value of the Ili River valley based on land
use cover classification [J]. Ecological
Science, 2017, 36(1): 193?C200.
[16]
Meng, X.
B., Cao, G. L., An, W. H., et al. Study on ecosystem services of Xixian new area based on land
use planning [J]. Ecological Science,
2017, 36(3): 142?C148.
[17]
Hu, C. X.,
Guo, X. D., Lian, G., et al. Effects
of land use change on ecosystem service value in rapid urbanization areas in
Yangtze river delta??a case study of Jiaxing city [J]. Resources and Environment in the Yangtze
Basin, 2017, 26(3): 333?C340.
[18]
Liu, Y. Y.,
Yang, Y., Wang, Q., et al.
Quantitative assessment of ecosystem service value of the Yangwu ecological park
in Xishan, Suzhou [J]. Ecological Science,
2019, 38(3): 116?C124.
[19]
The State
Council. Reply of the State Council on approving the establishment of Jiangbei new
area in Nanjing city [Z]. Beijing, 2015.
[20]
Nanjing
Municipal Bureau of planning and natural resources, Nanjing Academy of Urban
Planning & Design Co., Ltd, et al.
The master plan of Nanjing city (2018?C2035) (draft) publicity [Z]. Nanjing,
2018.
[21]
Liuhe
branch of Nanjing Municipal Bureau of planning and natural resources, Nanjing
Academy of Urban Planning & Design Co., Ltd. The development outline of Liuhe
district in Nanjing city master plan (2018-2035) [Z]. Nanjing, 2018.
[22]
Wang, B., Liu,
D. Y. Dataset of land use and its ecological value assessment in Liuhe district of Nanjing
City (2009, 2019) [J/DB/OL]. Digital
Journal of Global Change Data Repository, 2020. DOI:
10.3974/geodb.2020.05.17.V1.
[23]
GCdataPR Editorial Office. GCdataPR Data Sharing Policy [OL]. DOI:
10.3974/dp.policy.2014.05 (Updated 2017).
[24]
GB/T 21010-2017. Classification of land
use [S]. Beijing: Standards Press of China, 2017.
[25]
Liuhe
district Bureau of Statistics in Nanjing. Liuhe Statistical Yearbook 2010 [Z].
Nanjing, 2010.
[26]
Liuhe
district Bureau of Statistics in Nanjing. Liuhe Statistical Yearbook 2020 [Z].
Nanjing, 2020.
[27]
Nanjing
Municipal Bureau of planning and natural resources. Nanjing??s annual report of
urban planning 2009 [Z]. Nanjing, 2009.
[28]
Nanjing Municipal
Bureau of planning and natural resources. Nanjing??s annual report of urban
planning 2019 [Z]. Nanjing, 2019.
[29]
Nanjing
Bureau of Statistics. Nanjing Statistical Yearbook 1998 [Z]. Nanjing, 1998.
[30]
Nanjing
Bureau of Statistics. Nanjing Statistical Yearbook 2020 [Z]. Nanjing, 2020.