Soil Moisture Datasets of the Zhonggou River
Basin in the Loess Plateau of Gansu Province
Zhang, J.1
Di, L.1* Li, X. Y.2 Chen, Z. N.3 Huang, H. X.4 Wang, A. M.5
Fang, S. M.1 Ru, H. L.5 Jing, G. Y.1 Zhang, X. M1 Fei, J. E.1 Ren, Y. B.6
1. College of Resources and Environmental
Sciences, Gansu Agricultural University, Lanzhou 730070, China;
2. College of Earth and Environmental Sciences, Lanzhou
University, Lanzhou 730000, China;
3. Gansu Institute of Forestry Science, Lanzhou
730020, China;
4. College of forestry, Gansu Agricultural
University, Lanzhou 730070, China;
5. Pingliang institute of soil and water
conservation Science, Pingliang 744000, China;
6. College of Agriculture
and Forestry Science and Technology, Longdong University, Qingyang, 745000,
China
Abstract: Based the
National Natural Science Foundation of China ??Studies on Forest structure of Robinia
pseudoacacia effect on the erosion control and ecological water consumption
in Loess Plateau??and ??Temporal and spatial variation of Robinia pseudoacacia
forest stand structure and hydrological effect in typical small watershed of
the loess hilly-gully region in Gansu??.The robinia pseudoacacia planted
in 1970s and natural recovery grassland were selected research site. Ten sample
plots of forest land and three sample plots of grassland were set up according
to the changes of vegetation type, forest age and site characteristics. The
soil moisture of all samples was measured by drying method and Time Domain
Reflectometer (TDR). The
maximum depth of soil moisture measurement pipe is 3 meters, and the maximum
depth of soil drill is 2 meters. In
2018, the complete observation of all sample plots was achieved, and the measured
data of soil gravimetric moisture content and volumetric moisture content
during the growing season were obtained. The dataset includes: 1.13
geographical location and topographic data of the observed plots, as well as
the forest age, density, DBH and other main stand structure data; 2. Measured
data of soil weight water content and volume water content from April to
October, 2018.Format of data: XLSX. Datasets size: 252 KB. The partial dataset
has been published online in the journal of Arid Zone Research on 15th
July, 2019.
Keywords: soil moisture,
soil volumetric moisture content,
robinia pseudoacacia, the Loess Plateau
1 Introduction
The climate drought and
precipitation in the Loess Hilly Region of Gansu Province are less and unevenly
distributed, low forest vegetation coverage, deterioration of ecological environment
and serious soil erosion in this area. The relationship between vegetation and
water is the core issue of ecological restoration and vegetation construction
in the Loess Plateau of Gansu province[1-3]. China has
invested a series of key forestry ecological projects in this region, and a
large area of ecological forests such as Robinia pseudoacacia, Pinus tabulaeformis, Platycladus orientalis, Hippophae rhamnoides and Caragana korshinskii have been
constructed. However, in the process of ecological restoration in early
large-scale plantation, the characteristics of natural environment and spatial
and temporal distribution of soil moisture were neglected. In order to meet the needs of strong evapotranspiration of
plants, the plantations have rapidly expanded their roots and utilized deep
soil water storage, resulting in soil
degradation in plantation grassland[4]. At the same time,
the tree species selection is not scientific, and the way of construction is
not reasonable, resulting in a single tree species structure, high planting
density, survival rate and preservation rate is low. Even if they survive,
they grow very slowly and enter the degeneration stage earlier. As a result, a series of problems such as poor stability of
forestry ecosystem, stagnation of growth and regeneration of forest trees, low
ecological effect, soil drying, and decline of groundwater level have emerged
one after another[5-7]. Because the only
source of soil moisture is rainfall, soil water consumption is much larger than
precipitation, which leads to a long-term deficit of soil moisture[8]. Consequently, the expected effect of ecological engineering
construction has not been achieved. Therefore, it is
of great theoretical significance for guiding the restoration and sustainable
development of plantation vegetation in this area to study the eco-hydrological
process of typical plantation in this area and to grasp the distribution of
soil moisture in this area.
2 Metadata of Dataset
The name, author,
geographical region, time, dataset files, data publishing and sharing service
platform and data sharing policy of In situ soil moisture dataset in the
Zhonggou River Basin of Loess Plateau (2018)[ 9]are listed in Table
1.
3 Survey of
Research Area and Data Development Method
 3.1 Survey of Research Areas
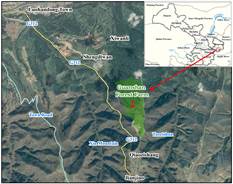
 The study area is
located in Jingchuan County, Gansu Province (Figure. 1). It is a typical loess
hilly and gully area. Slope direction: sunny
slope, semi sunny slope, shady slope and semi shady slope, of which semi sunny
slope is the main one[11]. The climate in the study
area is typical continental climate, with sunshine duration of 2,274 hours,
annual average temperature of 10.7 oC, frost-free period of 174
days, annual average rainfall of 555 mm, annual evaporation of 1,181.6 mm,
humidity of 0.81-1.04, dryness of 0.95?C1.28[12]. The soil is black loam soil, yellow loam soil and brown soil. The vegetation type belongs to the forest
grassland transition zone. The existing forest land area of the county is 5,420
km2, and the forest coverage rate is 47.33%. The artificial forest
planted in Guanshan forest farm is 132.7 km2, mainly Robinia pseudoacacia[7]. The experimental area of the
project is located in Zhonggou river basin (35??20'N, 107??31'E) of Guanshan
Forest Farm. The watershed covers an area of 2.09 km2 and an elevation
of 1,072-1,351 m. The vegetation type belongs to the transition zone between forest and
grassland. Robinia pseudoacacia
accounts for 92% of the total forest area. It can be roughly divided into four
different forest ages: 20 years, 25 years, 30 years and 35 years.
The study area is
located in Jingchuan County, Gansu Province (Figure. 1). It is a typical loess
hilly and gully area. Slope direction: sunny
slope, semi sunny slope, shady slope and semi shady slope, of which semi sunny
slope is the main one[11]. The climate in the study
area is typical continental climate, with sunshine duration of 2,274 hours,
annual average temperature of 10.7 oC, frost-free period of 174
days, annual average rainfall of 555 mm, annual evaporation of 1,181.6 mm,
humidity of 0.81-1.04, dryness of 0.95?C1.28[12]. The soil is black loam soil, yellow loam soil and brown soil. The vegetation type belongs to the forest
grassland transition zone. The existing forest land area of the county is 5,420
km2, and the forest coverage rate is 47.33%. The artificial forest
planted in Guanshan forest farm is 132.7 km2, mainly Robinia pseudoacacia[7]. The experimental area of the
project is located in Zhonggou river basin (35??20'N, 107??31'E) of Guanshan
Forest Farm. The watershed covers an area of 2.09 km2 and an elevation
of 1,072-1,351 m. The vegetation type belongs to the transition zone between forest and
grassland. Robinia pseudoacacia
accounts for 92% of the total forest area. It can be roughly divided into four
different forest ages: 20 years, 25 years, 30 years and 35 years.
Table 1
Metadata of ??In situ soil moisture
dataset in the Zhonggou River Basin of Loess Plateau (2018)??
|
Items
|
Description
|
|
Dataset
full name
|
In situ soil moisture dataset in the
Zhonggou River Basin of Loess Plateau (2018)
|
|
Dataset
short name
|
SoilMoistureLoessPlateau
|
|
Authors
|
Di, L., Gansu Agricultural
University, dili@gsau.edu.cn
|
|
|
Li, X. Y., Lanzhou University, lixiaoying@Lzu.edu.cn
|
|
|
Chen, Z. N., Gansu Institute of
Forestry Science, chen.zhengni@gmail.com
|
|
|
Zhang, J., Gansu Agricultural
University, zhangjun@gsau.edu.cn
|
|
|
Huang, H. X., Gansu Agricultural
University, haixiahuang@ gsau.edu.cn
|
|
|
Wang, A. M., Pingliang institute of
soil and water conservation, 593928177@qq.com
Ren Yibin , Longdong University, 171344121@qq.com
|
|
|
Fang, S. M., Gansu Agricultural
University, fangsm@gsau.edu.cn
|
|
|
Ru, H. L., Pingliang institute of
soil and water conservation, 1175332809@qq.com
|
|
|
Jing, G. Y., Gansu Agricultural
University, 960249539@qq.com
|
|
|
Zhang, X. M., Gansu Agricultural
University, 2248530337@qq.com
|
|
|
Fei, J. E., Gansu Agricultural
University, 943416926@qq.com
|
|
Geographical region
|
Zhonggou River Basin of Loess Plateau (35??20¢N, 107??31¢E)
|
|
Data files
|
the information of 13 sample plots,
and soil water content in 2018
|
|
Foundations
|
National Natural Science Foundation of China (41461112,
31660235)
|
|
Data publisher
|
Global change research data
publishing & repository http://www.geodoi.ac.cn
|
|
Address
|
No. 11 A Datun Road, Chaoyang
District, Beijing 100101, China
|
|
Data sharing policy
|
Data from the Global Change Research Data Publishing &
Repository includes metadata, datasets (data products), and publications (in
this case, in the Journal of Global Change Data & Discovery). Data sharing policy includes: (1) Data
are openly available and can be free downloaded via the Internet; (2) End
users are encouraged to use Data subject to citation; (3)
Users, who are by definition also value-added service providers, are welcome
to redistribute Data subject to written permission from the GCdataPR Editorial
Office and the issuance of a Data redistribution license, and;
(4) If Data are used to compile new datasets, the ??ten percent
principal?? should be followed such that Data records utilized should not
surpass 10% of the new dataset contents, while sources should be clearly
noted in suitable places in the new dataset [3]
|
|
Communication and searchable system
|
DO I, DCI, CSCD, WDS/ISC, GEOSS, China GEOSS
|
The stand stereo structure is simple, besides Robinia pseudoacacia,
there are arbor such as Populusspp, Platycladus orientalis, Pinus tabulaeformis, Paulowniaspp and Salix matsudana etc; Shrub include
Amorpha
fruticosa, Prunus davidiana, Hippophae rhamnoides, Caragana
korshinskii, Artemisia gmelinii, Stipa breviflora, Lespedeza fioribunda,
Syringa persica,
Hippophae rhamnoides
Linn and Xanthocera sorbifolia etc; Understory herbs includeStipa breviflora,
Astragalus
adsurgens, Pennisetum centrasiaticum, Bothriochloaischaemum,
Setaria faberi
and Chenopodium album L and so on[13?C15].
3.2 Raw Data Acquisition
3.2.1 Basic Information
of Sample Plots
On the basis of
comprehensive consideration of stand structure and site differentiation, 10
plots of Robinia pseudoacacia with
different slope orientation, gradient, age and density and 3 plots of Grassland
Slope were selected (See Table 2. Fig. 2 is the conventional plot of Robinia pseudoacacia forest and 3 is the
Grassland Slope plot.).
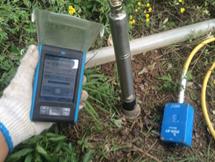
3.2.2 Soil Moisture
The
volumetric water content and the weight water content of soil were measured by
TDR and drying method, respectively.
(1) Measurement of Soil Volume Moisture Content
[15-16]
Measuring soil volumetric water content according to
the transmission time of electromagnetic wave emitted by the detector (see
Figure 4).
Table 2
Information sample plots of Zhonggou
river basin in the Loess Plateau of Gansu province
|
Sample site
|
Stand age (a)
|
Location
|
Landform
|
aspect (o)
|
Altitude (m)
|
Slope (o)
|
Density (plants/hm2)
|
Average dbh (cm)
|
Average height (m)
|
Average tree
height under first branch (m)
|
Even crown diameter
(m)
|
Canopy density
|
|
1
|
35
|
35??20??25??N
107??31??2??E
|
ridge slope
|
233??
semi-sunny slope
|
1235
|
35??
|
4563
|
7.83
|
5.63
|
3.38
|
1.85*1.55
|
0.87
|
|
2
|
30
|
35??20??32??N
107??31??9??E
|
tableland
|
339??
semi-cloudy slope
|
1251
|
15??
|
2196
|
13.22
|
11.9
|
7.1
|
7.8*4.3
|
0.82
|
|
3
|
25
|
35??20??41??N
107??31??11??E
|
tableland
|
332??
semi-cloudy slope
|
1239
|
13??
|
750
|
16.24
|
13.88
|
7.9
|
4.91*5.1
|
0.8
|
|
4
|
25
|
35??20??47??N
107??31??11??E
|
tableland
|
9??
shady slope
|
1325
|
2??
|
1600
|
15.66
|
12.83
|
6.95
|
4.7*4.5
|
0.83
|
|
5
|
20
|
35??20??44??N
107??31??55??E
|
ravine
|
218??
semi-sunny slope
|
1127
|
17??
|
5400
|
9.16
|
11.07
|
5.25
|
3.6*3.0
|
0.86
|
|
6
|
35
|
35??20??22??N
107??31??6??E
|
ridge slope
|
227??
semi-sunny slope
|
1252
|
16??
|
3780
|
11.54
|
8.36
|
4.1
|
2.7*3.4
|
0.82
|
|
7
|
25
|
35??21??1??N
107??31??36??E
|
tableland
|
341??
shady slope
|
1251
|
8??
|
1227
|
15.5
|
14.46
|
8.54
|
4.9*4.2
|
0.8
|
|
8
|
25
|
35??20??56??N
107??31??34??E
|
tableland
|
216??
sunny slope
|
1255
|
2??
|
1625
|
16.94
|
13.24
|
7.14
|
4.7*4.6
|
0.79
|
|
9
|
25
|
35??20??51??N
107??31??33??E
|
tableland
|
247??
semi-sunny slope
|
1243
|
18??
|
1000
|
14.2
|
11.96
|
5.56
|
4.9*4.8
|
0.82
|
|
10
|
35
|
35??20'10"N
107??31'7.5"E
|
ridge slope
|
255??
semi-sunny slope
|
1283
|
29??
|
3550
|
6.15
|
7.6
|
4.3
|
3.2*2.5
|
0.88
|
|
11
|
grassland
|
35??20??42??N
107??31??8.5??E
|
tableland
|
239??
semi-sunny slope
|
1228
|
22??
|
|
|
|
|
|
|
|
12
|
grassland
|
35??20??44??N
107??31??2??E
|
ridge slope
|
225??
semi-sunny slope
|
1201
|
35??
|
|
|
|
|
|
|
|
13
|
grassland
|
35??20??43??N
107??31??53??E
|
ravine
|
257??
semi-sunny slope
|
1137
|
10??
|
|
|
|
|
|
|
Methods: TDR tubes were buried in 13 selected
sample plots in the previous year. After calibration, trees germinated in the
middle and late April of the following year until the end of October, which was
a complete growing season. In theory, TDR tubes were measured every 15 days,
and then added after raining. (The actual operation depends on the weather
conditions and the time interval from the previous sampling. Sometimes individual sample plots did not be measured because of the water inflow in the
measuring tube, resulting in data missing.)
The depth of measurement varies according to slope,
aspect, age and planting density. The specific settings are as follows: Three
3-meter-long TDR tubes were buried in each sample plot of No. 1, No. 3, No. 4
and No. 5 respectively. Two 3-metre TDR tubes were
buried in No.2 sample plot. Two 2-metre TDR tubes were
buried in each runoff field of No. 6 and No. 11 sample plots. Three 2-meter TDR tubes were buried in each sample plot of
No. 7, No. 8 and No. 9. TDR tubes of 3 meters and 2
meters were buried in each sample plot of No. 10 and No. 12 plots,
respectively. Two 1.5-meter TDR tubes were buried in sample No. 13.
Maximum test depth is 300 cm. The probe of t TDR is put
into the observation tube during measurement. Measure 0-10, 10-20, 20-40,
40-60, 60-80 cm respectively. Read a data every 20 cm downward and record it.
The measuring time basically keeps synchronization with the earth drilling observation.
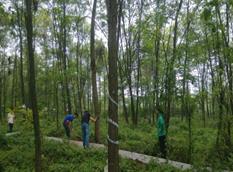
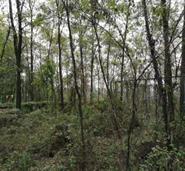
Figure
2 Test plot No. 3
|
|
|
|
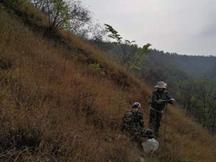
Figure 3 No. 12 grassy slope sample land
|
Figure 4 measured by TDR
|
|
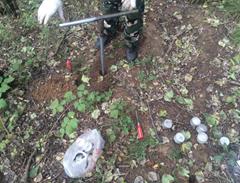
Figure 5 soil sampling by soil auger
|
(2) Soil Weight and Water Content
Methods: From the middle of April when trees began to
germinate to the end of October after defoliation, they were measured every 15
days (Figure 5) and added after rain. In actual
measurements, adjustments are made according to weather conditions (sampling
time will be lengthened by continuous precipitation) and the time interval from
the previous sampling. Soil samples were taken from
top to bottom with drills at different depths. Sampling depths were 0-120 cm,
stratified by 0-10, 10-20, 20-40, 40-60, 60-80, 80-100 and 100-120 cm respectively.
See Formula 1 for Calculating Soil Weight and Water Content.
 (1)
(1)
where, Q is soil moisture (%), W1 is dry aluminium box
weight (g), W2 is (wet
soil + aluminium box) weight (g), W3
is (dry soil + aluminium box) weight (g)
4 Data Results
During the growing season
from May to October, thesoil moisture content of Robinia pseudoacacia plantations with different densities showed as
follows (Table 3, 4): 1600 trees??hm-2
(18.75%) > 2196 trees. hm-2 (15.93%) > 750 trees??hm-2
(15.92%) > 4563 trees??hm-2 (11.87%). Soil moisture
content in different topographic locations, of which the Robinia pseudoacacia forest (upper) in the tableland surface is best, the middle in the Robinia pseudoacacia forest on the
plateau (lower) in the tableland surface and the ditch Robinia pseudoacacia forest, and the worst in the beam of Robinia pseudoacacia forest. As far as slope aspect is concerned, soil moisture in shady
slope is the best, in semi-shady slope and sunny slope is the middle, and in
semi-sunny slope Robinia pseudoacacia
plantation is the worst. As far as the vertical
variation of soil moisture is concerned, it generally shows that the surface
water content is the largest, which decreases with the deepening of the soil
layer and then tends to be stable. For different
topographic locations, the coefficient of variation of soil moisture of Robinia pseudoacacia forest on the tableland surface is the smallest and the soil moisture is
relatively stable, while that of Robinia
pseudoacacia forest on the beam is 90 cm thick and the water condition is
the worst. Robinia pseudoacacia
forest on the tableland surface (below) and Robinia
pseudoacacia forest on the gully are in the middle.
The
change of slope direction is that the change of soil moisture of sunny slope
and semi-sunny slope is more active than that of shady slope and semi-sunny
slope, in which the sunny slope is more stable than the semi-sunny slope and
the shady slope is more stable than the semi-sunny slope[17].
Table 3 Soil
volumetric moisture content in May 2018(partly)
|
Depth (cm)
|
Sample sites
|
|
1
|
2
|
3
|
????.
|
13
|
|
0-20
|
8.80
|
15.18
|
8.47
|
|
10.57
|
|
20-40
|
6.02
|
12.87
|
11.39
|
|
12.56
|
|
??
|
??
|
??
|
??
|
??
|
??
|
|
180-200
|
??
|
??
|
??
|
??
|
13.10
|
|
280-300
|
10.49
|
10.45
|
10.75
|
|
|
Table 4 Mass water
content of soil in May 2018 (partly)
|
Plot No.
|
Sample site
|
|
0-10
|
10-20
|
20-40
|
40-60
|
60-80
|
80-100
|
100-120
|
|
1
|
18.52
|
9.99
|
8.53
|
8.66
|
9.13
|
10.13
|
9.53
|
|
2
|
24.15
|
19.12
|
14.44
|
12.71
|
14.48
|
14.99
|
15.66
|
|
3
|
??
|
??
|
??
|
??
|
??
|
??
|
??
|
|
??
|
??
|
??
|
??
|
??
|
??
|
??
|
??
|
|
13
|
22.54
|
16.70
|
12.94
|
14.19
|
14.06
|
13.02
|
12.90
|
5 Discussion
and Conclusions
The seasonal variation of
soil moisture in Robinia pseudoacacia
plantation during the annual growth season was studied. It was found that the
seasonal variation of soil moisture in Robinia
pseudoacacia plantation could be divided into consumption period
(May-June), replenishment period (July), regression period (August-September)
and stabilization period (October). Despite the
increase of rainfall in June, soil moisture is still declining, which may be
attributed to the increased demand for water at the early growth stage of Robinia pseudoacacia and the enhanced
evaporation of forest land, resulting in a much larger soil water consumption
than supply. In July, the soil moisture fluctuated greatly in
different plots, mainly because the strong rainfall had a significant impact on
the surface layer, which made the surface soil moisture increase sharply.
However, with the evaporation after rain strengthening, the soil moisture would
change greatly. As far as the vertical
change of soil moisture is concerned, the soil water content shows a similar
trend with the change of rainfall. The continuous
observation for many years can be used as an important index data of the
regional ecological environment change. It can also be used as the basic input
data for climate model, hydrological model and vegetation growth analysis.
Author Contributions
Di, L. made the total
design of the layout of the
experiment and the development of the data set. Chen, Z. N. assisted in experimental design and
field observation layout. Li, X. Y. was mainly responsible for data analysis. Wang A. M., Jing, G. Y., Zhang, X. M., et al. were
responsible for data collection. Di, L., and Zhang, J.
carried out data verification and wrote manuscript.
References
[1]
Ma,
C. K. Study on the ecological and hydrological process of artificial hedgehog
forest land in the Loess Plateau [D]. Yangling: Northwestern University of
Agriculture, Forestry and Technology, 2018.
[2]
Zhang,
J. G. Water use of dominant tree species in two typical forests in the Loess
Hilly region of China [D]. Yangling: Research Center for Eco-environments and
Water Conservation, Chinese Academy of Sciences & Ministry of Education,
2014.
[3]
Wang,
N, Bi, H. X., Kong, L. X., et al. Soil water
compensation characteristics of Robinia pseudoacacia forestlands with different
densities in the Loess region of western Shanxi province[J]. Journal of Soil and Water Conservation,
2019, 33(4): 255-262.
[4] Xu, P. H., Chen,
Y. M., Wu, F. Analysis of the
effect of different transformation modes of degraded hedgehog forests in the
semi-arid area of loess hills [J]. Journal
of Northwest Forestry University, 2009, 24(4): 109-113.
[5]
Lu,
S. B., Chen, Y. M., Tang, Y. K., et al.
Sap flux density in response to rainfall pulses for Pinus tabuliformis and
Hippophae rhamnoides from mixed plantation in hilly Loess Plateau [J]. Chinese Journal of Applied Ecology,
2017, 28(11): 3469-3478.
[6]
Liu,
X. X., He, Q. Y., Yan, M. J., et al. Characteristics
of sap flow dynamics in dominant and companion trees in a natural secondary oak
forest in the loess hilly region [J]. Chinese
Journal of Applied Ecology, 2018, 38(13): 4744-4751.
[7]
Han,
C., Chen, N., Sun, S., et al. A review on
hydrological mediating functions and mechanisms in forest ecosystems [J]. Journal of Ecology, 2019, 38(7):
2191-2199.
[8]
Liu,
J. L., Chen, L. L., Yu, X. X. Influence factors and research progress of water
consumption of tree steaming [J]. World
Forestry Research, 2009, 22(4): 34-40.
[9]
Di,
L., Li, X. Y., Chen, Z. N., et al. Soil moisture
data set in the small basin of the ditch in the loess plateau of east China (2018)
[DB/OL]. Global Change Research Data Publishing & Repository, 2019. DOI:
10.3974/geodb.2019.05.03.V1.
[10]
GCdataPR
Editorial Office. GCdataPR data sharing policy [OL]. DOI:
10.3974/dp.policy.2014.05 (Updated 2017).
[11]
Jing,
G. Y. The hydrological research of the soil and litter of different type
artificial Robinia pseudoacacia
forests in the Loess Plateau of eastern Gansu [D]. Lanzhou: Gansu Agricultural
University, 2017.
[12]
Wang,
A. M., Ren, Y., Wang, Y. H., et al. The effect of
the canopy of the three type of radial hedgehog forests in Yuchuan, Gansu
Province, is to retain rainfall [J].
Scientia Silvae Sinicae, 2014, 50(3): 16-21.
[13]
Han,
F., Ren, Y., Wang, Y. H., et al. Response to
rain in the forest of hedgehog sprang through rain in Yuchuan, Gansu Province [J].
Yellow River, 2015, 37(7): 90-94.
[14] Liu, X. W., Li, B.
C., Wang, Y. Jingchuan Forestry Records [M]. Landzhou: Lanzhou University
Press, 2016.
[15]
The
National Standard of the People??s Republic of China. Long-Term Positioning
observation Methods of Forest Ecosystems (GB/T
33027??2016) [S]. Beijing: Standard Press of China, 2016.
[16]
Wang, B., Ding, F. J. Standard System for Long-term Positioning of Forest
Ecosystems [M]. China Forestry Press, 2012.
[17]
Zhang,
X. M., Di, L., Shi, Z. J., et al. Soil moisture
content under artificial Robinnia pseudoacacia forest at different slope
positions in the Zhonggou Minor Basin, Jingchuan county, Gansu province [J]. Arid Zone Research, 2019, 36(5):
1300-1308.