Spatial-temporal Mean Temperature Dataset in the
China–Mongolia–Russia Economic Corridor (1982–2018, 1-km/y)
Jiao, Y.1, 2 Yang, J. C1.
Li, G. S.1,3
Yu, L. X1* Bao, Y. L.4 Zhang, S. W.1
1. Remote Sensing and Geographic Information Research
Center, Northeast Institute of Geography and Agroecology, Chinese Academy of
Sciences, Jilin, Changchun 130102, China;
2. School of Life Science, Liaoning
Normal University, Liaoning, Dalian 116029, China;
3. School of Geography Science,
Changchun Normal University, Jilin, Changchun 130032, China;
4. School of Geography Science,
Inner Mongolia Normal University, Inner Mongolia, Hohhot 010022, China
Abstract: The
spatial-temporal mean temperature dataset in the China–Mongolia–Russia Economic
Corridor (1982–2018,
1-km/y) was developed based on the data integration of temperature data from
325 meteorological stations in the China–Mongolia–Russia Economic Corridor
(CMREC) and on the use of ANUSPLIN meteorological interpolation software. The
results show that R² was 0.980 and above, where R is the correlation coefficient between meteorological station
data and interpolation results. The average mean absolute error (MAE) and
root-mean-square error (RMSE) values were 0.348 and 0.481 ºC,
respectively. The dataset includes (1) boundary data of the study area and (2)
annual-mean-temperature grid data at a 1 km resolution relative to the period
1982–2018. The dataset is archived in
.shp, .tif and .mdd data formats and consists of 159 data files with a data
size of 8.65 GB (compressed into 2 files of 531 MB).
Keywords: annual mean temperature; China–Mongolia–Russia Economic Corridor; 1 km; 1982–2018
DOI: https://doi.org/10.3974/geodp.2022.02.08;
CSTR: https://cstr.escience.org.cn/CSTR:20146.14.2022.02.08
Dataset Availability Statement:
The dataset
supporting this paper was published and is accessible through the Digital Journal of
Global Change Data Repository at: https://doi.org/10.3974/geodb.2022.01.03.V1 or
https://cstr.escience.org.cn/CSTR:20146.11.2022.01.03.V1.
1 Introduction
According to the
sixth report of IPCC, since 1850–1900, the global average surface temperature
has increased by about 1 ºC, and extreme weather events occur frequently.
Global climate change forces humankind to face unprecedented challenges[1].
Temperature data are not only important parameter data reflecting the climate
characteristics of a region but also among the basic data for the study of
global warming and its effects. Therefore, high-precision meteorological
observation data with high temporal and spatial resolutions are of great
significance for the study of temperature changes in different regions[2,3].
In recent years, many scholars have
compared the spatial interpolation methods of near-surface-temperature data to
seek the optimal spatial interpolation methods, including Kriging
interpolation, inverse distance weight, multiple linear regression and other
methods in ArcGIS, as well as a series of special interpolation software for
spatial meteorological data represented by ANUSPLIN, which has proved to be a
method with high accuracy[4–9].
ANUSPLIN meteorological interpolation software is software for the surface
fitting of meteorological data based on the basic principle of the thin-disk
smooth spline function[10]. Zhao
and Wen et al. used ANUSPLIN software
to interpolate the temperature in Chongqing and Anhui. They found that the
ANUSPLIN spatial interpolation method was suitable for complex terrain and
showed a good fitting effect[11,12].
Chen et al. and Wang et al. conducted ANUSPLIN spatial
interpolation analysis on China??s temperature and precipitation and found that
the interpolation results were consistent with the climate change
characteristics of the Chinese mainland[13,14].
Chen and others believe that spatial interpolation with ANUSPLIN software can
also better reflect the temporal and spatial distribution characteristics of
meteorological elements in the China–Pakistan Economic Corridor[15].
With the
increasing trend of economic globalization, regional cooperation is attracting
more and more attention. As one of the ??six economic corridors of the Belt and
Road??, the China–Mongolia–Russia Economic Corridor has greatly promoted the process
of regional economic integration in Northeast Asia[16,17].
The regional physical and geographical conditions restrict the economic
development to a great extent, which also reflects the changes in many
hydrological elements and vegetation surface[18].
Therefore, the study of the temperature distribution in the
China–Mongolia–Russia Economic Corridor plays an important role in regional economic development. However, the existing temperature
datasets cannot meet the current needs of climate change research in the
China–Mongolia–Russia Economic Corridor, which hinders the development of
climate change research in this region.
At present, the interpolation of
temperature is mainly carried out by domestic countries. Under the background
of international cooperation, it is an inevitable trend of future scientific
research to jointly analyze natural environment changes through international
cooperation. This dataset contains multi-source data from meteorological
stations in the China–Mongolia–Russia Economic Corridor and uses ANUSPLIN
software to introduce elevation as a covariate to spatially interpolate the
annual average temperature in the China–Mongolia–Russia Economic Corridor; the
final result is the Spatial-temporal mean temperature dataset in the
China–Mongolia–Russia Economic Corridor (1982–2018, 1-km/y).
2 Metadata of the Dataset
The metadata of the Spatial-temporal mean temperature dataset in China–Mongolia–Russia
Economic Corridor (1982–2018, 1-km/y)[19] are summarized in Table 1. It include the dataset??s
full name and short name, authors?? information, year of the dataset, temporal
resolution, spatial resolution, data format, data size, data files, data
publisher, data sharing policy, etc.
Table 1 Metadata summary of the Spatial-temporal
mean temperature dataset in China-Mongolia-Russia Economic Corridor (1982–2018,
1-km/y)
|
Items
|
Description
|
|
Dataset full name
|
Spatial-temporal mean
temperature dataset in China-Mongolia-Russia Economic Corridor (1982–2018,
1-km/y)
|
|
Dataset short
name
|
CMREC_Temperature_1982-2018
|
|
Authors
|
Jiao, Y.
0000-0003-4160-4540, Northeast Institute of Geography and Agroecology,
Chinese Academy of Sciences, jiaoyue@iga.ac.cn
Yang, J. C.,
Northeast Institute of Geography and Agroecology, Chinese Academy of
Sciences, yangjiuchun@iga.ac.cn
Li, G. S.,
Northeast Institute of Geography and Agroecology, Chinese Academy of
Sciences, liguangshuai@iga.ac.cn
Yu, L. X.
0000-0002-5565-535X, Northeast Institute of Geography and Agroecology,
Chinese Academy of Sciences, yulingxue@iga.ac.cn
Bao, Y. L.,
School of Geographical Sciences, Inner Mongolia Normal University,
baoyulong@imnu.edu.cn
Zhang, S. W.,
Northeast Institute of Geography and Agroecology, Chinese Academy of Sciences,
zhangshuwen@iga.ac.cn
|
|
Geographical
region
|
The geographical
range includes 27??47¢N–61??57¢N, 25??51¢E–157??51¢E
|
|
Year
|
1982–2018
|
|
Temporal
resolution
|
1 year
|
|
Spatial
resolution
|
1 km
|
|
Number of data
files
|
159
|
|
Data format
|
.shp, .tif, .mdd
|
|
|
|
Data size
|
8.65 GB
(compressed to 2 files of 531 MB)
|
|
|
|
Data files
|
They include the
annual average temperature data files (in .tif and .mdd format) of the China–Mongolia–Russia
Economic Corridor from 1982 to 2018 and a group of boundary vector files
(.shp) of the mainland part of the China–Mongolia–Russia Economic Corridor. The
.tif file: the temperature data file name is tempyyyy.tif, which contains average-temperature
data of the yyyy year. The name of the .mdd air-temperature data file is XXXX
yyyy MDD, which refers to the annual average temperature data from XXXX to
yyyy. The vector file name is cmrec_ BND. shp
|
|
Foundations
|
Chinese Academy
of Sciences (XDA2003020301); National Natural Science Foundation of China
(42071025); Ministry of science and Technology of P. R. China (2017FY101301).
|
|
Data publisher
|
Global Change Research Data Publishing & Repository
(http://www.geodoi.ac.cn).
|
|
Address
|
No. 11A, Datun
Road, Chaoyang District, Beijing 100101, China.
|
|
Data sharing
policy
|
Data from the Global
Change Research Data Publishing & Repository includes metadata, datasets (in Digital Journal of Global
Change Data Repository) and publications (in Journal of Global
Change Data & Discovery).
Data sharing policy includes: (1) Data are openly
available and can be freely downloaded via the Internet. (2) End users are
encouraged to use Data subject to citation. (3) Users, who are by definition
also value-added service providers, are welcome to redistribute Data
subject to written permission from the GCdataPR Editorial Office and the
issuance of a Data redistribution license. (4) If Data are used to
compile new datasets, the ??ten percent principle?? should be followed, such
that Data records utilized should not surpass 10% of the new
dataset??s contents, while sources should be clearly noted in suitable places
in the new dataset[20]
|
|
Communication and searchable system
|
DOI, CSTR, Crossref, DCI, CSCD,
CNKI, SciEngine, WDS/ISC, GEOSS
|
3 Methods
3.1 Data Collection
The
meteorological station data in China used in this dataset were obtained from
the annual value dataset of China??s surface climate data provided by National
Meteorological Science Data Center[21],
and 119 surface meteorological stations were selected. The data of the meteorological
stations in Mongolia and Russia were derived from the daily-observation data
provided by National Oceanic and Atmospheric Administration (NOAA)[22], and 28 and 178 surface meteorological
stations were selected, respectively. Finally, a total of 325 surface
meteorological stations were selected to interpolate the annual average temperature
in the China–Mongolia–Russia Economic Corridor from 1982 to 2018 (Figure 1).
|
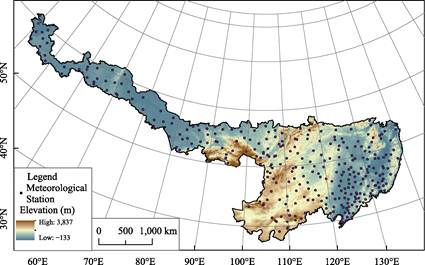
Figure 1 Distribution
and DEM of meteorological stations in China–Mongolia–Russia International Economic
Corridor
|
The DEM data
were derived from the global multi-resolution terrain elevation dataset (GMTED2010).
It is a spatial dataset of global land areas jointly launched by United States
Geological Survey (USGS) and National Geospatial Intelligence Agency (NGA)[23]. The dataset was published in
2010 with a spatial resolution of 30 arc seconds. The DEM data in this study
are based on gmted2010 data. Through spatial processing, the spatial resolution
is 1 km (Figure 1).
3.2 Algorithm Principle
3.2.1 ANUSPLIN Meteorological Interpolation
This dataset mainly adopts the spatial
interpolation method of the local thin-disk smooth spline function. This method
was first proposed by Wahba in 1979 and later improved by Australian scientist
Hutchinson, and ANUSPLIN meteorological interpolation software was developed.
At present, the above software is widely used in the field of spatial
interpolation of climate change elements[24,25].
The above software is based on the basic principle of the thin-disk smooth
spline function, and its theoretical statistical model is shown below[26]:
 (1)
(1)
where Zi is the dependent variable located at point i in
space; f(xi) is the unknown smooth function about xi; xi is the d-dimensional spline independent variable; bT is the p-dimensional
coefficient about yi; yi is the p-dimensional
independent covariate; ei is the expected value of 0, and the
variance is wi??2;
wi is the known relative error variance; ??2 is the error variance
constant on all data points that are usually unknown; and N is the number of observations.
The above software introduces the linear sub-model of
multivariate covariates, automatically selects the optimal fitting surface in
the interpolation process and improves the accuracy of spatial interpolation[27].
3.2.2 Error Analysis
In order to verify the
interpolation accuracy of the scheme selected by ANUSPLIN, this paper uses
correlation analysis and error analysis to test the accuracy of the
interpolation results[28–30]. In
order to test the correlation between the estimated value and the observed value
of the station, the determination coefficient (R2) is calculated in this paper.
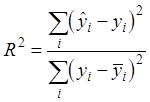 (2)
(2)
The numerator of the formula represents the residual
predicted by the predicted value, while the denominator represents the residual
obtained by predicting all data using the sample mean. When R2 < 0, the residual error
of the prediction result of the model is larger than that of the benchmark
model (predicting all data with the sample mean), indicating that the
prediction result of the model is very poor. When R2 > 0, the greater R2 is, the smaller the residual of the prediction result
of the model is, and the better the prediction effect is.
In order to test the error of the interpolation
results, the root-mean-square error (RMSE) and mean absolute error (MAE) are
calculated in this paper. The root-mean-square error can be used as an
important index to measure the error between real value and predicted value,
that is, the smaller the RMSE value is, the better the interpolation effect[31].
 (3)
(3)
where, m is the number of stations, and x(i) and y(i) represent the observed value
and estimated value of the ith station, respectively.
The average absolute error reflects the real error and
is the average value of the absolute error. The smaller the MAE is, the smaller
the error is.
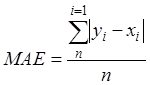 (4)
(4)
where, n is the number of stations, and yi and xi
represent the observed and estimated values of the ith station, respectively.
3.3 Data Processing
The data processing method of
this dataset is mainly divided into three parts: data preparation, data
preprocessing and spatial interpolation[14].
Data preparation mainly includes the integration of 325 ground meteorological
station tables, annual average temperature data and DEM data of the
China–Mongolia–Russia Economic Corridor from 1982 to 2018. Data preprocessing
aims at sorting the meteorological data and DEM data into a data format that
can be used by ANUSPLIN software. Among them, the stations with missing
meteorological data are eliminated to ensure the consistency of the interpolation
results, and the format is sorted by SPSS software and output in ASCII data
format. The DEM data with a spatial resolution of 1 km is output in ASCII data
format by ArcGIS. Spatial interpolation is completed by using ANUSPLIN
software. Splina and lapgrd programs are run, and longitude and latitude are
set as independent variables, while elevation is interpolated as covariate.
Finally, ArcGIS is used to convert the interpolation results into .tif format
raster data.
4 Data Results and Validation
4.1 Data Composition
The
data set includes (1) annual average temperature data files (.tif and .mdd
formats) relative to the China–Mongolia–Russia Economic Corridor in the
calendar years from 1982 to 2018 and (2) a set of vector files (.shp) for the
continental part of the China–Mongolia–Russia Economic Corridor. The .tif
temperature data file name is tempyyyy.tif, which refers to the average
temperature data in the yyyy year; the .mdd temperature data file name is
xxxx-yyyy.mdd, which refers to the annual average temperature data from the
xxxx year to the yyyy year; the vector file name is CMREC_BND .shp.
4.2 Data Products
Based on ANUSPLIN
software, the multi-year average temperature distribution map of the China–Mongolia–Russia
Economic Corridor from 1982 to 2018 was obtained (Figure 2). The 37-year
average temperature in the China-Mongolia‒Russia Economic Corridor was
|
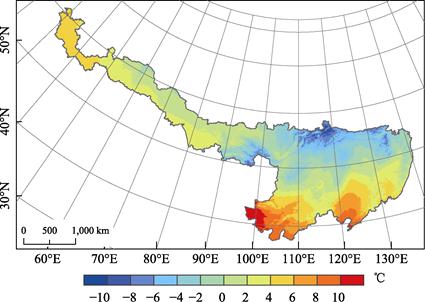
Figure 2
Distribution
map of average temperature over the years in the China–Mongolia–Russia
Economic Corridor
|
1.24 ºC. The annual average temperature in
China was 4.27 ºC, and the average temperature in Mongolia was 2.55 ºC,
while the average temperature in Russia was ‒0.37 ºC. In terms of
spatial distribution, the annual average temperature difference between the
north and south of the study area was about 30 ºC, which is very
significant, and it showed a distribution characteristic of a decreasing trend
from south to north and from the coast to the interior. The average annual
temperature in the western part of Inner Mongolia in China reached more than 10
ºC, making it the region with the highest annual average temperature
in the China–Mongolia–Russia International Economic Corridor, and the temperature
gradually decreased toward the east and north of this area and the Liaohe
Plain. The general trend of the annual average temperature distribution in
Mongolia in the past 37 years followed a distribution from south to north. With
the increase in latitude, the temperature gradually decreased, which conforms
to the zonal law of latitude. The average annual temperature of Russia
gradually decreased from the coast to the interior. The temperature
distribution of the China–Mongolia–Russia Economic Corridor was not only
affected by the difference in latitude and sea–land distribution but was also
significantly affected by the topography. The distribution of the annual
average temperature in Northeast China was significantly affected by the
topography, and its distribution was related to the shape of the plain
surrounded by mountains on three sides. The coldest area of the China–Mongolia–Russia Economic Corridor was located in the Russian
Far East Mountains, where the temperature dropped sharply due to the higher terrain.
The average temperature in the Republic of Buryatia was as low as ‒4.10 ºC.
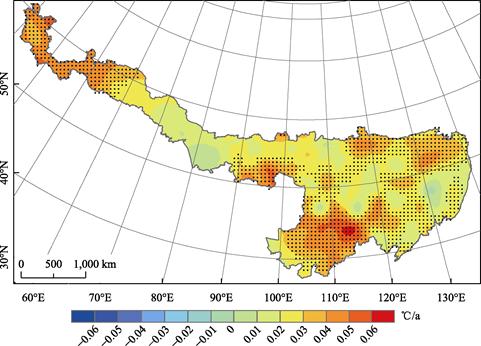
Figure 3 Spatial
distribution map of the slope rate of annual mean temperature change in the
China–Mongolia–Russia
Economic Corridor from 1982 to 2018
The spatial
distribution of the annual average temperature change in the China–Mongolia–Russia
Economic Corridor from 1982 to 2018 was obtained (Figure 3). The average
temperature in the China–Mongolia–Russia Economic Corridor increased
significantly in the past 37 years. This increase was above 0.01 ºC/a in
some areas such as the central and eastern parts of Inner Mongolia, China,
while the rise rate in other areas was above 0.06 ºC/a. In addition,
there was a relatively obvious temperature-drop area in the Xiaoxingan Mountains
in eastern Heilongjiang, China. The temperature rise in the three eastern
provinces of China ranged from 0 to 0.05 ºC/a, while the
temperature rise in the Inner Mongolia Autonomous Region ranged from 0.01 to
0.06 ºC/a. There was an obvious temperature-drop area in Northeast China,
mainly located in the southern part of the Xiaoxingan Mountains, while the most
significant temperature-increase area was mainly located in the central part of
the Inner Mongolia Autonomous Region. The temperature variation in most parts
of Mongolia was between ‒0.01 and 0.06 ºC/a, with these areas being mainly distributed in the southeastern
part of Mongolia. The areas with a temperature rise above 0.05 ºC/a
were mainly concentrated in the central part of East Gobi League in
southeastern Mongolia, part of the northeastern part of South Gobi League, the
southeast corner of Central Gobi League and the southern part of Sukhbaatar
League. The temperature variation in some parts of Russia was between 0 and
0.06 ºC/a. The temperature in the western region was relatively high and
significant, roughly bounded by the Ural Mountains, while the central Tuva Republic
also had a relatively significant temperature increase, with a heating rate
greater than 0.05 ºC/a. There were also two warming zones in the Far East Mountains,
and the warming rate in the warming zone was greater than 0.04 ºC/a.
The regions with the lowest heating rate were mainly distributed in Primorsky
Krai and Altai Krai, and the rate was less than 0.01 ºC/a.
4.3 Data Validation
Using
the field observation data of 325 meteorological observation stations in the continental
part of the China–Mongolia–Russia Economic Corridor, the interpolation results
were verified, and the verification results are shown in Figure 4.
|
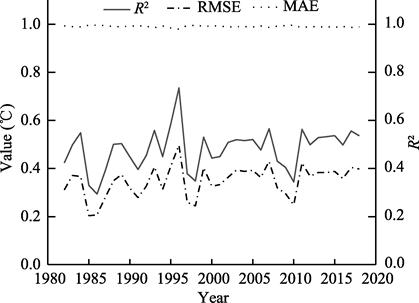
Figure 4
Average
temperature from 1982 to 2018 and verification of the accuracy of the
interpolation results
|
The verification
results show that ANUSPLIN software could simulate the distribution of the
annual average temperature in the China–Mongolia–Russia Economic Corridor with
latitude and longitude as the independent variables and elevation as the
covariate. The determination coefficient (R2)
ranged from 0.980 to 0.996; the root-mean-square error (RMSE) was from 0.294 ºC to 0.735 ºC, and the mean absolute error (MAE) was from 0.204
ºC to 0.497 ºC. The error figures in 1996 were slightly higher
than in other years. In general, the ANUSPLIN interpolation algorithm showed
relatively high interpolation accuracy.
5 Discussion and Conclusion
Based on the data
and terrain of 325 meteorological observation stations in the mainland part of
the China–Mongolia– Russia Economic Corridor and using ANUSPLIN meteorological
interpolation software, the Spatial-temporal mean temperature dataset in the
China– Mongolia–Russia Economic Corridor (1982–2018, 1-km/y) was finally obtained
and verified with the observed and predicted values of meteorological stations.
The results show that the annual average temperature distribution data obtained
in this study can effectively reflect the temperature change trend in the China–Mongolia–Russia
Economic Corridor. The annual average temperature in the China–Mongolia–Russia
Economic Corridor showed a very significant difference between the north and
the south, as well as a distribution characteristic of a decreasing trend from
south to north and from the coast to the interior. By the temperature
distribution law, the temperature dropped with the increase in altitude. The
annual average temperature in most areas of the China–Mongolia–Russia Economic
Corridor showed a significant warming trend, which is consistent with the
global warming trend[1]. The
format of this dataset is a raster, i.e., it represents the average temperature
distribution in a raster, which is different from the observation values of a
meteorological station. The meteorological station data were obtained from a
wide range of sources, and the terrain data also included processed DEM data.
All had a certain influence on the interpolation results. Therefore, there was
a certain error between the final interpolation results and the actual
temperature distribution. In future research, the accuracy and verification of
the interpolation results could be further improved. Based on the above
studies, this dataset can provide data support for exploring the
characteristics of climate change in the China–Mongolia–Russia Economic
Corridor.
Author Contributions
Jiao,
Y. and Yu, L. X. provided the overall idea for the development of the data set
and the revision and approval of the data paper; Yu, L. X., Jiao, Y., and Bao,
Y. L. collected the source data of the data set. All authors co-authored the
data paper.
Conflicts of Interest
The
authors declare no conflicts of interest.
References
[1] IPCC. Climate Change 2021: The Physical Science Basis. Contribution
of Working Group I to the Sixth Assessment Report of the Intergovernmental
Panel on Climate Change [M]. Cambridge University Press, 2021.
[2] Jing, W. L., Yang, Y. P., Le, X. F. A dataset of monthly mean
temperature on a 1km grid in China [J].
Journal of Global Change Data &
Discovery, 2017, 1(1): 66‒73.
[3] Yang, Y. Z., Lang, T. T., Zhang, C., et al. Comparative research on temperature interpolation methods in
the Belt and Road regions based on GIS [J].
Journal of Earth Information Science, 2020, 22(4): 867‒876.
[4] Qian, Y. L., Lyu, H. Q., Zhang, Y. H. Application and evaluation of
daily meteorological element interpolation method based on ANUSPLIN software
[J]. Journal of Meteorology and
Environment, 2010, 26(2): 7‒15.
[5] Jiang, X. J., Liu, X. J., Huang, F., et al. Comparison of spatial interpolation methods for daily meteorological
elements [J]. Chinese Journal of Applied
Ecology, 2010, 21(3): 624‒630.
[6] He, L. K., Sun, L. Q., Li, Q. L., et al. Comparison of temperature spatial interpolation methods in
Shenzhen [J]. Progress in Meteorological
Science and Technology, 2019, 9(3): 179‒184.
[7] Liu, H. L., Fan, Z. L., Han, M. Z., et al. Research on the establishment of daily temperature grid data
set in Beijing-Tianjin-Hebei region based on ANUSPLIN [J]. Journal of Marine Meteorology, 2020, 40(3): 111‒120.
[8] Peng, B., Zhou, Y. L., Gao, P., et al. Applicability analysis of
different spatial interpolation methods in temperature interpolation—taking
Jiangsu province as an Example [J]. Journal
of Earth Information Science, 2011, 13(4): 539‒548.
[9] Yi, G. H., Zhang, T. B., He, Y. X., et al. Applicability analysis of four temperature spatial interpolation
methods [J]. Journal of Chengdu
University of Technology (Natural
Science Edition), 2020, 47(1): 115‒128.
[10] Liu, Z. H., Li, L. T., Tim, R. M., et al. ANUSPLIN, a special spatial
interpolation software for climate data and its application [J]. Meteorology, 2008(2): 92‒100.
[11] Zhao, M. Y., Yu, J., Hu, Y. Y. Spatial interpolation of temperature
in Chongqing area based on local thin-disk smooth spline function [J]. Shaanxi Meteorology, 2021(1): 50‒55.
[12] Wen, H. Y., Chen, F. J., L, J., et
al. A study on spatial interpolation of temperature in Anhui province based
on ANUSPLIN [J]. Meteorological and
Environmental Research, 2019, 10(2): 51‒55, 60.
[13] Chen, W., Sun, L. Q., Li, Q. L., et
al. 1km grid data set of temperature and precipitation in China in the past
38 years [J]. Meteorological Science and
Technology, 2021, 49(3): 355‒361.
[14]
Wang, J. B., Wang, J. W., Ye,
H., et al. 1 km grid spatial
interpolation dataset of national temperature and precipitation from 2000 to
2012 [J]. China Scientific Data (Chinese and English Online Edition),
2017, 2(1): 73–80, 205‒212.
[15] Chen, J. Y., Tao, H., Liu, J. P. Daily meteorological dataset of
China-Pakistan Economic Corridor from 1961 to 2015 [J]. China Scientific Data (Chinese
and English Online Edition), 2021, 6(2): 229‒238.
[16] Bagen, U. Achievements, existing problems and future suggestions of
the China-Mongolia-Russia Economic Corridor [J]. Western Mongolia Forum, 2019(3): 64‒72, 115.
[17] Pu, J. Y. Analysis of the main characteristics and existing problems
of the construction of ??China-Mongolia-Russia Economic Corridor?? [J]. Northeast Asian Journal, 2020(6): 17‒30,
145.
[18] Ge, J., Xu, Y. F., An, X. Y., et al. Analysis of ecologically
sensitive areas in the China-Mongolia-Russia Economic Corridor under the
background of ??One Belt, One Road?? [J]. Journal
of Ecology, 2019, 39(14): 5051‒5057.
[19]
Jiao,
Y., Yang, J. C., Li, G. S., et al. Spatial-temporal
mean temperature dataset in China-Mongolia-Russia Economic Corridor (1982–2018,
1-km/y) [J/DB/OL]. Digital Journal of Global
Change Data Repository, 2022. https://doi.org/10.3974/geodb.2022.01.03.V1.
https://cstr.escience.org.cn/CSTR:20146.11.2022.01.03.V1.
[20] GCdataPR Editorial Office. GCdataPR data sharing policy [OL]. https://doi.org/10.3974/dp.policy.2014.05
(Updated 2017).
[21] Sun, J., Zhang, X. P., Huang, Y. M. Accuracy assessment of different
reanalysis precipitation data in Dongting Lake Basin [J]. Resources and Environment in the Yangtze Basin, 2015, 24(11):
1850‒1859.
[22] Zhu, H. H., Jiang, Z. H., Li, Z. X. New understanding of extreme
climate projections in China from CMIP5 to CMIP6 (English) [J]. Science Bulletin, 2021, 66(24):
2528‒2537.
[23] Danielson, J. J., Gesch, D. B. Global multi-resolution terrain
elevation data 2010 (GMTED2010) [Z]. U.S. Geological Survey Open-File Report,
2011.
[24] Hijmans, R. J., Cameron, S. E., Parra, J. L., et al. Very high-resolution interpolated climate surfaces for
global land areas [J]. International
Journal of Climatology, 2005, 25(15).
[25] Ye, W. L., Huang, Y.H., Zhou, Z. Q., et al. Temporal and spatial variation characteristics of temperature
in Qilian Mountains in the past 60 years [J]. Science, Technology and
Engineering, 2022, 22(4): 1344‒1353.
[26] Hutchinson, M. F. Interpolation of rainfall data with thin plate
smoothing splines??part I: two-dimensional smoothing of data with short range
correlation [J]. Journal of Geographic
Information and Decision Analysis, 1998(2): 139‒151.
[27] Liu, Z. H., Tim, R. M., Li, L. T., et al. Spatial interpolation of time series meteorological elements
based on ANUSPLIN [J]. Journal of
Northwest A&F University (Natural Science Edition), 2008(10):
227‒234.
[28] Xu, X. Q., Zhu, M. X. Comparison of temperature spatial
interpolation methods in Jiangxi province based on GIS [J]. Green Science and Technology, 2021,
23(10): 21‒24.
[29] Meng, Q. Temporal and spatial variation of precipitation in Qinling
Mountains and acquisition of raster dataset [D]. Xi??an: Northwestern
University, 2021.
[30] Bai, Y. A dataset of spatial and temporal variation trends of NDVI
in Qinling-Dabashan region (2000–2019) [J]. Journal
of Global Change Data & Discovery,
2020, 4(4): 346‒353.
[31] Yan, M. C., Pan, Z. H., Shen, B. H., et al. Spatial-temporal characteristics of sunshine hours in
Guangdong province in the past 50 years based on Anusplin interpolation [J]. Guangdong Meteorology, 2022, 44(1):
25‒29.