Polders Spatial Dataset around Dongting Lake, China (1949–2013)
Wang, J. L.* Gao, M. X. Guo, H. H. Chen, E. Y.
State Key Laboratory of Resources and Environmental Information System, Institute of Geographic Sciences and Natural Resources Research, Chinese Academy of Sciences, Beijing 100101, China
Abstract: Long-term sediment deposition and embankment reclamation have formed a special distribution of polders around Dongting Lake in China. The area encompassed by the dataset includes 20 counties around Dongting Lake. The Polders spatial dataset around Dongting Lake, China (1949–2013) includes the polder distribution in 2013 and the spatial changes during 1949–1998, 1998–2008, and 2008–2013. The 2013 polder distribution was extracted using object-oriented image classification using remotely sensed images. Information about spatial changes in the polders during the three historical periods was extracted from water-conservancy engineering drawings and related materials using automatic vectorization and the ArcGIS software. The same dataset could be used to look for temporal and spatial patterns, explain the process of polder evolution, investigate land use and its changing patterns, and formulate corresponding policies for managing polders in the Dongting Lake area.
Keywords: Dongting Lake; polder; spatial change; landscape pattern
1 Introduction
As an important lake fed by the Yangtze River, Dongting Lake in China serves for functions such as irrigation, shipping, water storage, and climate regulation[1–2]. The terrain associated with the lake is low and flat, and acts as a collection center for groundwater and surface water. The surrounding hills and low mountains are inclined toward the center of the lake. When the flood peaks of the Yangtze River and the four other rivers (the Xiang, Zi, Yuan, and Li Rivers) that feed the lake coincide, flood disasters are likely to occur. Since the period of the Eastern Han Dynasty (AD 25-220), people living around the lake have been constructing dams to encircle farmland, residential land, and other land uses together to resist flooding and to facilitate land reclamation. This formed China’s unique geospatial type, known as a “polder” for agricultural production and rural settlement [3–6]. Now, long-term human activity has changed the pattern of polders in the Dongting Lake area, and the impact of this on the regional geographical environment and ecosystem is becoming increasingly evident. As such, increasing attention is being paid to the formation and development of polders, as well as to changes in their spatial distributions.
2 Metadata of Dataset
The descriptions of the PolderChangeOfDongtingLake_China dataset are recorded here. Table 1 summarizes the main metadata elements of the PolderChangeOfDongtingLake_China dataset.
Table 1 Metadata summary of the Dongting Lake (China) polder dataset (1949-2013)
|
Items
|
Description
|
|
Dataset full name
|
Dongting Lake (China) polder dataset (1949-2013)
|
|
Dataset short name
|
PolderChangeOfDongtingLake_China
|
|
Authors
|
Wang, J. L. R-8881-2016, State Key Laboratory of Resources and Environmental Information System, Institute of Geographic Sciences and Natural Resources Research, Chinese Academy of Sciences, wangjl@lreis.ac.cn
Gao, M. X. S-1061-2016, State Key Laboratory of Resources and Environmental Information System, Institute of Geographic Sciences and Natural Resources Research, Chinese Academy of Sciences, gaomx@igsnrr.ac.cn
Guo, H. H. S-2633-2016, State Key Laboratory of Resources and Environmental Information System, Institute of Geographic Sciences and Natural Resources Research, Chinese Academy of Sciences, guohaihui0421@163.com
Chen, E. Y. S-1107-2016, State Key Laboratory of Resources and Environmental Information System, Institute of Geographic Sciences and Natural Resources Research, Chinese Academy of Sciences, cheney@lreis.ac.cn
|
|
Geographical region
|
28°30¢–30°20¢′N, 110°40¢–113°10¢E, Dongting Lake, China
|
|
Time
|
1949–1998, 1998–2008, 2008–2013, 2013
|
|
Spatial resolution
|
100 m
|
Data format
|
.shp
|
|
Data Size
|
21.0 MB
|
|
|
|
Dataset and data files
|
The dataset consists of four data files, they are:
1. DongtingLakePolder2013.zip is the data file of the spatial data of polders in 2013
2. DongtingLakePolder1949_1998.zip is the data file of the spatial data of polders (1949–1998)
3. DongtingLakePolder1998_2008.zip is the data file of the spatial data of polders (1998–2008)
4. DongtingLakePolder2008_2013.zip (7.60 MB) is the data file of the spatial data of polders (2008–2013)
|
|
Foundation(s)
|
Ministry of Science and Technology of P. R. China (2011FY110400, 2013FY114600), Chinese Academy of Engineering (CKCEST-2016-3-7)
|
|
Data publisher
|
Global Change Research Data Publishing & Repository, http://www.geodoi.ac.cn/
|
|
Address
|
No.11A, Datun Road, Chaoyang District, Beijing 100101, China
|
|
Data sharing policy
|
Data from the Global Change Research Data Publishing & Repository includes metadata, datasets (data products), and publications (in this case, in the Journal of Global Change Data & Discovery). Data sharing policy includes: (1) Data are openly available and can be free downloaded via the Internet; (2) End users are encouraged to use Data subject to citation; (3) Users, who are by definition also value-added service providers, are welcome to redistribute Data subject to written permission from the GCdataPR Editorial Office and the issuance of a Data redistribution license; and (4) If Data are used to compile new datasets, the ‘ten per cent principal’ should be followed such that Data records utilized should not surpass 10% of the new dataset contents, while sources should be clearly noted in suitable places in the new dataset[7]
|
3 Methods
Three main methods are used to produce the dataset. The first is remote-sensing interpretation of polder information based on object-oriented image classification, the second is digital processing of historical polder material, and the third is information processing of changes in the spatial distribution of polders in different periods. The flow of data processing is shown in Figure 1.
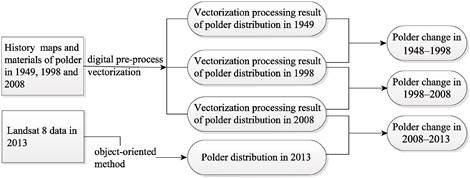
Figure 1 Data-processing flow chart
3.1 Extraction of 2013 Polder Information Using Object-oriented Image Classification
Polder information is extracted using object-oriented image classification based on four sets of Landsat 8[8] satellite images in 2013 (July 31, 2013, 123/40 and 123/41 and August 7, 2013, 124/39 and 124/40). The method includes three steps: multi-scale segmentation, water information extraction, and polder information extraction.
3.1.1 Multi-scale Segmentation
The use of multi-scale segmentation improves inter-object homogeneity and intra-object heterogeneity. Each different object type has its own scale. The smaller the segmentation scale, the more polygons are generated, the smaller is the single-object area, and the greater is the inter-object homogeneity[9–10]. In this paper, after several experiments using the eCognition object-based image analysis software, the best segmentation scales for water and polder were determined to be 50 and 70, respectively. With these scales, each polygon object is of one type only, and its boundary is clear.
3.1.2 Water Information Extraction
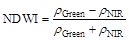
Water information is extracted from the Landsat 8 images using the normalized-difference water index (NDWI)[11]. The calculation formula is as follows:
 (1)
(1)
where ρGreen and ρNIR represent the reflectances of the green and near-infrared bands, respectively. The object is classified as water in this study, if its NDWI value is greater than 0.38.
3.1.3 Polder Information Extraction
Polder data is extracted from objects that are not water. A series of classification rules is constructed, involving a threshold value for the digital elevation model (DEM), an enhanced vegetation index (EVI), the distance to river, and a length-width ratio.
(1) DEM
By overlaying the polder distribution data with 30 m resolution DEM data, it was found that polders are located mainly on plains whose elevation is less than 30 m. Thus, in the classification rules, the DEM threshold value is set to less than or equal to 30 m.
(2) Enhanced vegetation index
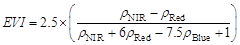
Based on the values of the EVI[12], some less vegetated areas could be distinguished in the Landsat 8 images, such as mudflats and some unused land around the lake. The calculation formula is as follows:
 (2)
(2)
where ρNIR, ρRed, and ρBlue represent the reflectances of the near-infrared, red, and blue bands, respectively.
(3) Distance to river
The “distance to river” rule is used to eliminate certain wetlands and mudflats that have spectral characteristics that are similar to those of a paddy. In this study, this rule is applied within 200m of a river.
(4) Length-width ratio
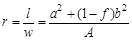
In the length-width ratio, the length and width are those of the minimum exterior rectangle of the object. This ratio r is calculated as follows:
 (3)
(3)
where a and b represent the length and width, respectively, of the approximate boundaries, A is the area of the object, and f is a weighting factor. Different types of land cover have different values of r. Those for cultivated land are relatively small because this type of land tends to be regularly shaped. In contrast, mudflats give relative high values of r because they tend to be irregularly shaped. Thus, this factor can be used to eliminate certain objects that re not polders.
3.2 Digitization of Historical Polder Information
The basic reference map used in the dataset development was the topographic map of the Dongting Lake area in 1949 (1∶300,000) published by the Water Conservancy Bureau of Hunan Province. We also used water conservancy project maps of Hunan Province in 1998 (1∶250,000) and Dongting Lake in 2008 (1∶300,000). This was done firstly according to the image signatures of water and polder in different bands using the “Rectify” tool. Automatic vectorization was then carried out using the “ArcScan” tool.
3.3 Processing to Reveal Changes in Spatial Distribution of Polders
The 2013 polder-distribution data based on the object-oriented method and the 1949, 1998, and 2008 historical data were compared and analyzed using the ArcGIS software. From this, the spatial changes in polders between the different historical periods were obtained.
Taking the processing of polder changes in the period of 1949-1998 as an example, the distribution of unchanged polders was captured using the “Intersect” tool, and information about changes was obtained using the “Erase” tool. Any increase in polder area was revealed by the 1998 polder areas erasing the 1949 ones, and vice versa for any decrease in polder area. Finally, information about polder changes in the period of 1949-1998 was extracted by summing up both the changed and unchanged polder areas. The same method was used to obtain data in the periods of 1998-2008 and 2008-2013.
4 Results and Validation
4.1 Spatial Changes in Polders
The distribution of polders in 2013 as extracted using the object-oriented method is shown in Figure 2 (a); the total polder area was 12,060.2 km2 (Table 2). It can be analyses that polders were concentrated mostly to the north of South Dongting Lake, extending into Hubei Province. Furthermore, some polders were distributed in districts to the southern part, including Ziyang, Xiangyin, and Heshan, and to the western, including Hanshou, Wuling, and Dingcheng.

Figure 2 (a) Polder distribution in 2013; changes during (b) 1949-1998, (c) 1998-2008, and (d) 2008-2013
The changes in polders during 1949-1998 are shown in Fig. 2 (b), where an increasing trend in polder distribution can be seen. The polder area increased from 8,254.96 km2 in 1949 to 12,270.5 km2 in 1998, mainly because of the increases located in Datong Lake, Miluo City, Ziyang District, Lixian County, and the town of Qianlianghu in the Junshan district.
|
Table 2 Statistics of polder area around Dongting Lake
|
|
Year
|
Area (km2)
|
Area change (km2)
|
|
1949
|
8,254.96
|
-
|
|
1998
|
12,270.5
|
+4,015.54
|
|
2008
|
12,194.6
|
-75.9
|
|
2013
|
12,060.2
|
-134.4
|
The changes in polders during 1998-2008 are shown in Fig.2 (c), during which time the polder area dropped to 12,194.6 km2. The decreases of the Large-range in polders occurred in the inner Dongting Lake area, mainly in independent polders that were surrounded by water or were located along the edge of the lake.
|
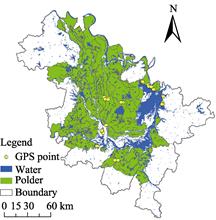
Figure 3 Map of GPS verification points
|
During 2008-2013, the Dongting Lake polder area again showed a decreasing trend, as can be seen in Figure 2(d); the area dropped by 134.4 km2 during this period. The decreases moved from the inner area to the periphery, and the water surface area of the East Dongting Lake expanded.
4.2 Data Validation
The digitization process in the study was under strict quality control to be within one pixel. Interpretation of the remote-sensing results was validated by means of a field survey that was conducted in 2013 from October 29 to November 3. Twenty-six independent verification points were obtained using GPS (four water points and 22 polder points) and shown in Figure 3 and Table 3.
Table 3 Verification points for Dongting Lake polder area
|
ID
|
Longitude
|
Latitude
|
Altitude (m)
|
Type
|
|
1
|
112°24ʹ06.662ʺ E
|
28°39ʹ44.365ʺ N
|
30
|
polder
|
|
2
|
112°26ʹ35.542ʺ E
|
28°39ʹ24.022ʺ N
|
26
|
polder
|
|
3
|
112°10ʹ47.944ʺ E
|
28°50ʹ00.741ʺ N
|
24
|
water
|
|
4
|
112°15ʹ36.634ʺ E
|
28°59ʹ31.752ʺ N
|
29
|
polder
|
|
5
|
112°16ʹ33.702ʺ E
|
28°58ʹ35.367ʺ N
|
24
|
polder
|
|
6
|
112°15ʹ39.337ʺ E
|
29°00ʹ13.329ʺ N
|
37
|
polder
|
|
7
|
112°19ʹ26.382ʺ E
|
29°03ʹ28.908ʺ N
|
26
|
polder
|
|
8
|
112°19ʹ29.893ʺ E
|
29°22ʹ25.966ʺ N
|
26
|
polder
|
|
9
|
112°20ʹ06.368ʺ E
|
29°21ʹ04.277ʺ N
|
28
|
polder
|
|
10
|
112°11ʹ34.548ʺ E
|
28°49ʹ42.510ʺ N
|
17
|
water
|
|
11
|
112°22ʹ37.218ʺ E
|
29°21ʹ30.636ʺ N
|
44
|
polder
|
|
12
|
112°22ʹ33.714ʺ E
|
29°20ʹ42.818ʺ N
|
46
|
polder
|
|
13
|
112°33ʹ36.124ʺ E
|
29°18ʹ05.586ʺ N
|
20
|
polder
|
|
14
|
112°32ʹ17.599ʺ E
|
29°18ʹ06.509ʺ N
|
44
|
polder
|
|
15
|
112°50ʹ17.142ʺ E
|
29°30ʹ46.015ʺ N
|
35
|
polder
|
|
16
|
112°50ʹ41.453ʺ E
|
29°30ʹ01.440ʺ N
|
33
|
polder
|
|
17
|
112°50ʹ16.955ʺ E
|
29°30ʹ45.875ʺ N
|
15
|
polder
|
|
18
|
112°54ʹ19.458ʺ E
|
29°28ʹ27.444ʺ N
|
22
|
polder
|
|
19
|
112°54ʹ52.069ʺ E
|
29°27ʹ20.287ʺ N
|
24
|
polder
|
|
20
|
112°56ʹ40.625ʺ E
|
29°27ʹ02.801ʺ N
|
34
|
polder
|
|
21
|
112°58ʹ15.012ʺ E
|
29°25ʹ06.172ʺ N
|
26
|
polder
|
|
22
|
113°05ʹ13.819ʺ E
|
29°20ʹ22.675ʺ N
|
40
|
water
|
|
23
|
113°04ʹ39.839ʺ E
|
29°15ʹ40.661ʺ N
|
22
|
polder
|
|
24
|
113°04ʹ52.706ʺ E
|
29°14ʹ36.746ʺ N
|
22
|
polder
|
|
25
|
113°03ʹ59.516ʺ E
|
29°14ʹ45.012ʺ N
|
19
|
water
|
|
26
|
113°05ʹ27.246ʺ E
|
29°19ʹ53.095ʺ N
|
31
|
polder
|
5 Discussion
The 2013 Dongting Lake polder data were obtained from remotely sensed images. The 1949, 1998, and 2008 polder data were derived from historical map records. Although the individual results in highly accurate data processing, uncertainties may be introduced at the comparison stage. Specifically, the 1949-1998 and 1998-2008 data have good consistency in data precision, whereas some uncertainties still exist in the 2008-2013, because of the different data sources.
The Dongting Lake area has gone through a series of changes in its long history, including polder reclamation, the combining of polders, and returning farmland to the Lake. The polder structure changed obviously after an attempt in 1998 to deal with floods by returning farmland to the Lake, whereas now the spatial changes in polders seem to be stabilizing. By analyzing these dynamic changes, the relationships among polder shape evolution, regional environmental management, and sustainable economic development can be studied further. The same dataset could be used for research into this region’s environment and resources. This could involve looking for temporal and spatial patterns in the distribution of polders, studying the processes whereby polders evolve, considering land use and its changing patterns, and formulating corresponding policies for managing polders.
Author Contributions
Wang, J. L. designed the study. Wang, J. L. and Gao, M. X. contributed to the data analysis and wrote the paper. Guo, H. H. and Chen, E. Y. contributed to the data processing, analysis, and validation.
Acknowledgements
The authors would like to thank the Provincial Nature Reserve Administration Bureau of West Dongting Lake and the JiangJiaZui branch of the West Dongting Lake Nature Reserve Administration for providing the historical material.
References
[1] Zhong, X. Y. Success and supersession of Dongting Lake’s encirclement dike and its historical function [J]. Journal of Yunmeng, 2005, 26(6): 50-52.
[2] Li, J. B., Dong, L. J. Environmental impacts of land reclamation in the Dongting Lake area [J]. Resources and Environment in the Yangtze Valley, 1993, 2(4): 340-346.
[3] Department of Land and Resources of Hunan Province. Historical change Atlas of Dongting Lake [M]. Changsha: Hunan Map Press, 2011.
[4] Peng, P. B., Peng, B. Y., Cao, F. Qingshan dyke wetland restoration and birds conservation [J]. Journal of Yueyang Vocational Technical College, 2010, 25(2): 39-44.
[5] Cai, K. P., Hou, X. Y, Li, Y. Y., et al. Oncomelania snail survey in 41 areas of “breaking dikes of open sluice for waterstore” in Dongting Lake regions [J]. Chinese Journal of Schistosome Control, 2005, 17(2): 86-88.
[6] Wang, J. L., Gao, M. X., Guo, H. H., et al. Dongting Lake (China) polder dataset (1949-2013) [DB/OL]. Global Change Research Data Publishing & Repository, 2014. DOI: 10.3974/geodb.2014.02.07.V1.
[7] GCdataPR Editorial Office. GCdataPR data sharing policy [OL]. DOI: 10.3974/dp.policy.2014.05 (Updated 2017).
[8] Zhang, Y. J. Introduction of Landsat 8 [J]. Remote Sensing for Land and Resources, 2013, 25(1): 176-177.
[9] Liu, M. L., Wu, Y. H. Research on a scale-based approach for spatial data representation in GIS [J]. Acta Geodaetica et Cartographica Sinica, 2002, 31(z1):82-86.
[10] Baatz, M., Schäpe, A. Multi-resolution segmentation: An optimization approach for high quality multi-scale image segmentation [J]. Angewandte Geographische Information Averarbeitung, 2000, XII: 12-23.
[11] McFeeters, S. K. The use of the Normalized Difference Water Index (NDWI) in the delineation of open water features [J]. International Journal of Remote Sensing, 1996, 17(7): 1425-1432.
[12] Liu, H. Q., Huete, A. R. A feedback based modification of the NDVI to minimize canopy background and atmospheric noise [J]. IEEE Transactions on Geoscience and Remote Sensing, 1995, 33(2): 457-465.