Dataset of Ecosystem Service Value of the Typical
Islands in Beibu Gulf, China
Zhang, Q1, 2
Tian, Y. C.1,2* Huang,
Y. L.1 Tao, J.1 Han, X.1 Zhang, Y. L.1 Lin, J. L.1 Yang, Y. W.1
1. School of Resources and Environment, Beibuwan University,
Qinzhou 535011, China??
2. Qinzhou Key Laboratory of Development and Utilization of Marine Geographic
Information Resources, Qinzhou 535011, China
Abstract: Based on Remote sensing image of
Gaofen-1, the island landscape pattern data was interpreted by ENVI 5.3. With
this data, the island ecosystem service value was caculated, using the
ecosystem service value measurement model. Then adopting
Moran??s Index method, we got the spatial distribution pattern and the value of
significance level of the island ecosystem services value. The results showed that the value of ecosystem services per unit
area was higher in Tuanhe Island than in Qixing Island. The ecosystem service
value of Qixing Island had a high degree of dispersion. The service value of
Tuanhe Island ecosystem presented a spatial clustering state, while the service
value of Qixing Island ecosystem presents a dispersion trend.
Keywords:
GF-1 satellite; landscape
pattern; ecosystem service value; Moran??s I; typical island in Beibu Gulf
Dataset Availability Statement:
The dataset supporting this paper was published and is accessible
through the Digital Journal of Global
Change Data Repository at: https://doi.org/10.3974/geodb.2020.07.14.V1
& https://doi.org/10.3974/geodb.2020.07.15.V1.
1 Introduction
Beibu Gulf is a semi-closed Bay located in
the northwest of the South China Sea with a total area of approximately 128,000
km2. It reaches China??s Leizhou Peninsula and Hainan Island in the
East, Vietnam in the west, South China Sea in the south, and Guangxi Zhuang autonomous
region in the north. The Guangxi Beibu Gulf area has 649 islands and has a
great influence on the social and economic development in the Qinbeifang area,
especially in Beibu Gulf area. The research on the value service and spatial heterogeneity
of the island ecosystem in Beibu Gulf is conducive to the protection of island
resources, the rational utilization of island landscape, and the management and
planning of island ecological environment.
Ecosystem services
refer to all kinds of supporting products and services directly or indirectly
provided by ecosystem for human beings, including natural capital and its corresponding
ecological economic value[1]. A comprehensive and objective
assessment of the value of ecosystem has been conducted, resulting in a series
of valuable achievements. Ecosystem service value and its evaluation have
become the focus in geography, ecology, and environmental science research[2-5]. Scholars have
extensively studied the value of land ecosystem services in different research
scales[6-9]. To reflect the spatial
distribution of ecosystem service value scientifically, we focused on Tuanhe
and Qixing Islands as the research objects to study the spatial distribution
and heterogeneity of ecosystem service value of their regional sustainable development
and provide a decision-making basis.
2 Metadata of the Dataset
The metadata of
the dataset[10-11] is
summarized in Table 1. It
includes the dataset full name, short name, authors, year, temporal resolution,
spatial resolution, data format, data size, data files, data publisher, and
data sharing policy, etc.
Table 1 Metadata summary of ??Ecosystem service
value evaluation dataset on Qixing Island in Beibu Gulf, China?? and ??Ecosystem service
value evaluation dataset on Tuanhe Island in Beibu Gulf, China??
|
Items
|
Description
|
|
Data
full name/short name
|
Ecosystem
service value evaluation dataset on Qixing Island in Beibu Gulf, China/Qixing_ESV
Ecosystem service value evaluation dataset on Tuanhe
Island in Beibu Gulf, China/Tuanhe_ESV
|
|
Authors
|
Zhang, Q. A-6449-2018, School of
Resources and Environment,Beibuwan University, 676489898@qq.com
Tian,
Y. C., School of Resources and Environment, Beibuwan University, 935921897@qq.com
Huang, Y. L., School of Resources and Environment, Beibuwan
University, 1732305940@qq.com
Tao,
J., School of Resources and Environment, Beibuwan University,
187354980@qq.com
Han,
X., School of Resources and Environment, Beibuwan University,
2383272519@qq.com
Zhang, Y. L., School of Resources and Environment, Beibuwan
University, 641577425@qq.com
Lin,
J. L., School of Resources and Environment, Beibuwan University,
460197231@qq.com
Yang, Y. W., School of
Resources and Environment, Beibuwan University, 605331392@qq.com
|
|
Geographical
region
|
Qixing
Island (21.605??N-21.634??N, 109.031??E-109.068??E)
Tuanhe
Island (21.842??N-21.878??N,
108.460??E-108.494??E)
|
|
Year
|
2016
Spatial resolution 30
m
Data formats .tif,
.shp, .xlsx
|
|
Data
files
|
Landscape
type of two islands, ecosystem service value, grid value of LISA and P, statistics data of ecosystem
service value of all kinds of landscape type, total 26 data files from two datasets
covering Qixing Island and Tuanhe Island.
|
|
Foundations
|
Guangxi
Natural Science Foundation of China (2018JJA150135); Guangxi
Innovation-driven Development Special Project (AA18118038); Guangxi Base and
Talent Project (2019AC20088); Beibu Gulf University (2019KYQD28)
|
|
Computing
environment
|
ArcGIS10.2,
ENVI5.3
|
|
Data
publisher
|
Global
Change Research Data Publishing & Repository, http://www.geodoi.ac.cn
|
|
Address
|
No.
11A, Datun Road, Chaoyang District, Beijing 100101, China
|
|
Data
sharing policy
|
Data from the Global Change
Research Data Publishing &Repository includes metadata, datasets (in the Digital Journal of Global Change Data Repository), and publications
(in the Journal of Global Change Data & Discovery). Data sharing
policy includes: (1) Data are openly available and can be free
downloaded via the Internet; (2) End users are encouraged to use Data subject
to citation; (3) Users, who are by definition also value-added service providers,
are welcome to redistribute Data subject to written permission
from the GCdataPR Editorial Office and the issuance of a Data redistribution
license; and (4) If Data are used to compile new datasets, the
??ten per cent principal?? should be followed such that Data records
utilized should not surpass 10% of the new dataset contents, while sources
should be clearly noted in suitable places in the new dataset[12]
|
|
Data and paper retrieval system
|
DOI??DCI??CSCD??WDS/ISC??GEOSS??China
GEOSS, Crossref
|
3 Methods
3.1 Algorithms
3.1.1 Ecosystem Service Value
According to Costanza??s ecosystem service value evaluation method,
Xie et al. formulated the ecosystem
service value equivalent table of China[13]. This study refers to
the method of formulating the ecosystem service value equivalent table by Hu Hebing??team[14]
and adjusts the island ecosystem service value coefficient based on the actual
situation in Qinzhou city, Guangxi. The specific data processing is as follows:
from 2010 to 2018 in Qinzhou city, the average output of grain was 5,036.02 kg??hm-2, and the average purchase price of grain in eight years was RMB
1.23 per kilogram. The economic value provided by the natural ecosystem without
human input is the existing 1/7 of the economic value of food production
services per unit area of farmland[15]. According to this method,
the value of an ecosystem service value equivalent factor of a typical island
in the Beibu Gulf can be determined to be 884.90 Yuan. Accordingly, the
ecosystem service value equivalent table can be used to calculate the
ecological service value coefficients of different landscape types.
The calculation
formula of the ecosystem service value model is described as follows??
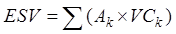 (1)
(1)
where is the total value of ecosystem services in the study area,
is the different landscape types in the study area, represents the ecosystem
service value coefficient of the kth
landscape type, and represents the area of kth
landscape type.
3.1.2 Spatial Correlation
Analysis
The local Moran index was used to characterize the spatial
heterogeneity between variables. The calculation formula is as follows??
Moran??s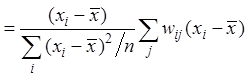 (2)
(2)
If the value of Moran??s index is greater than 0, the
spatial units are in high?Chigh or low?Clow aggregation, and a value less than 0
indicates that the spatial units are in low?Chigh or high?C low aggregation.
3.2 Data Processing
The procedure of data processing is shown
in Figure 1. Radiometric correction, geometric correction, and clipping were
applied to remote sensing image data. Then, according to the technical
regulations of the second national land survey and with the support of cart algorithm,
the island landscape pattern including cultivated land, woodland, grassland,
construction land, aquaculture water surface, water body, and ridge were interpreted.
Following step is using calculation and specifications of the ecosystem service
value equivalent methods, the spatial map of the ecosystem service value of
Qixing Island and Tuanhe Island was calculated. Lastly, the spatial
distribution map of the ecosystem service value of the islands was processed
using the local Moran index tool of ArcGIS10.2, and the Local Indicators of Spatial
Association map and significance level map of ecosystem service value were produced.
|

Figure 1 Flowchart of the dataset development
|
4 Results and Data
Validation
4.1 Data Products
The dataset
consisted of four subsets, including the landscape type of typical island data
in the format of .tif, the ecosystem service value of typical island data in
the format of .tif, the LISA and significance level (P value) data in the format of .shp, and the statistics data of
landscape type and ecosystem service value in .xlsx. format with 13 data files
in each of the two datasets.
4.2 Data Results
The ecosystem
service value of the unit grid ranges from 8.44 Yuan to 11,240.01 Yuan, with an
average value of 4,783.39 Yuan in Tuanhe Island and from 1,565.49 Yuan to
8,034.26 Yuan, with an average value of 455.92 Yuan in Qixing island (Figure 2)[16].
The high-value areas of Tuanhe Island??s ecosystem services are mainly
concentrated in the eastern and southern areas of the island. The value of
ecosystem services per unit area of this type of area almost exceeded 10,000
Yuan, and this phenomenon is mainly related to the landscape pattern of the aquaculture
water surface in the area, while the low-value areas are mainly concentrated in
the northern and south-central part of the island. These areas have low
ecosystem service value per unit area, most of which are in the range of 10?C15
Yuan. This type of area is mainly affected by construction land, resulting in
low ecosystem service value. The high-value areas of the ecosystem service
value of Qixing Island are mainly concentrated in the southwest and northeast
of the island. The ecosystem service value per unit area of these areas is
mostly between 7,000?C8,000 Yuan, and a few areas exceeded 8,000 Yuan. The
low-value areas are mainly concentrated in the central area and peripheral
roads of the islands with a common value of approximately 1,600 Yuan. The
ecosystem service value of the central area is mainly affected by the
construction land of the residential area, while the peripheral area is mainly
affected by the road. Therefore, the ecosystem service value is low, and the lowest
value of the ecosystem service value of Qixing Island is considerably higher than the
lowest value of Tuanhe Island.
LISA is a significant index that reflects
the degree of positive or negative correlation between grid spatial attributes
and other surrounding cells. Figures 3 and 4 show the LISA cluster map and the
significance level spatial distribution map of the two islands[16],
respectively. The figure shows that the ecosystem service value of Tuanhe Island
mainly consists of low and low aggregation (the area of low and low aggregation
is significantly larger than that of high and high aggregation), and the areas
of low and low aggregation are mainly concentrated in the northern part of the
island. The significant levels of the transition zone from the central to the
south and that of the northern region and the central-southern transition zone
were P=0.001 and P=0.01, respectively. The landscape pattern of these areas is
dominated by construction land and farmland patches. The areas with high
ecosystem service value are mainly distributed in the eastern and southern
regions of the island. Among these areas, the ecosystem service value of the
eastern region reached a significant level of 0.01, and the ecosystem service
value of the southern region reached P=0.001.
The level of significance is relatively high. The land use types in this area
are mainly based on aquaculture water surface and water bodies, resulting in
high aggregation. The LISA map of the ecosystem service value of Qixing Island
is dominated by high?Chigh aggregation distributed in the southwest and
northeast of the island, and the P
value of ecosystem service grid reached a significant level of 0.001 in the
southwest and 0.01 in the northeast. The part of the region??s high ecosystem
service value gathering area is affected by the aquaculture water surface. The
low-value areas are mainly distributed on the edge of islands. The ecosystem
value in these areas is characterized by low-low aggregation mainly because the
landscape type of the area is construction land. Most of the ecosystem service
value levels in low-value areas did not have significant values.

Figure 2 Ecosytem service
value of Tuanhe Island and Qixing Island
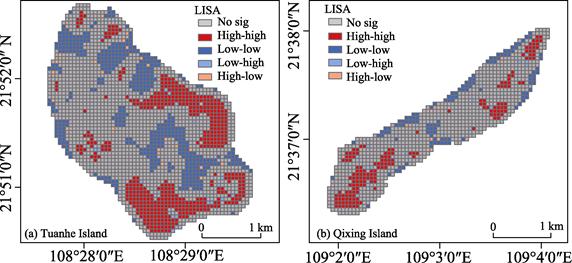
Figure 3
Aggregation of ecosystem service value of Tuanhe Island and Qixing Island
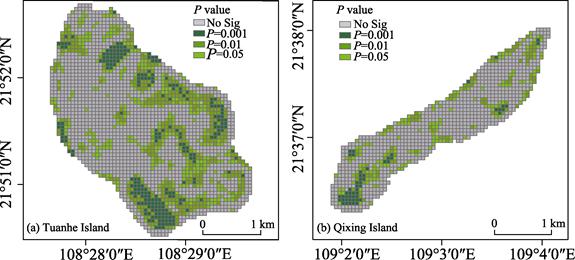
Figure 4 P
value of local indicators of spatial association
4.3 Data
Validation
The value of ecosystem services differed because of the
adoption of different models, parameters, and ecosystem classifications. Based
on the method of Xie[5] and the actual situation, we calculated that
the ecological service value of each unit grid (60 m ?? 60 m) of Tuanhe Island
is 8.44?C11,240.01 Yuan, which is 23.44?C31,222.25 Yuan??ha-1??a-1. Xun et
al.[17] evaluated the ecosystem service value of the Qinzhou
coastline and found that the ecosystem
service value of the coastline near Tuanhe Island is mainly 0?C50,000 Yuan??ha-1??a-1, which is close to the evaluation result of this paper.
5 Discussion and Conclusion
5.1 Discussion
The evaluation theory, index system, and implementation
principle of island ecosystem service value need to be improved further,
although progress made greatly during the last decades. In the evaluation of
ecological service value, when different models, parameters, and regional
ecosystem classification are used, the results of ecological value assessment
often result in differences. Even for the same ecosystem, significant differences
might be observed in evaluation conclusions. For example, in the evaluation of
the value of global ecosystem services, the conclusions of Pimentel[18]
and Constanza are orders of magnitude different. Based on the value estimation
method proposed by Costanza and Xie, combined with the actual grain yield of
Qinzhou city, the equivalent factor value of grain per unit area can be
calculated as 884.90 Yuan, and the ecosystem service value of different islands
can be calculated using the value equivalent table. Considering the special
habitat of the island itself, natural factors such as climate differences, soil
conditions, geology and landforms, and natural disasters affect the development
of island vegetation, making the vegetation biomass of the island area significantly
different from that of the mainland. The larger the biomass, the stronger the
ecosystem service function is. Therefore, in the future, the net primary productivity
of typical island areas can be estimated according to the vegetation and
climate conditions in the future, and the equivalent table of forest ecosystem
service value of islands can be modified according to the calculated net
primary productivity, which will be a core content of this study in the future.
In addition, spatial scale is an indispensable factor in the evaluation process
of ecosystem services[19]. In the present study, according to the
size of the study area and GF-1 data resolution, the final selected scales are
60 m ?? 60 m. It is recognized that mote detail research and data are needed
focused on the spatial scale of ecosystem service value of typical islands with
different geological landforms.
5.2 Conclucsion
This dataset provides data
support for the evaluation of the ecosystem service value of the typical
islands in the Beibu Gulf and the analysis of its spatial heterogeneity. The
value of ecosystem services per unit area of Qixing Island is lower than that
of Tuanhe Island, but the coefficient of variation of Qixing Island is
significantly higher than that of Tuanhe Island. The overall dispersion of
ecosystem service value of Qixing Island is relatively high. The space for the
island??s ecosystem service value and the characteristics of heterogeneity were
mainly determined using the fitting model and fitting parameters of the
variogram. The best fitting model of clusters and islands is a spherical model,
and the model of Qixingdao is an exponential model. The landscape patterns of
the two islands are controlled by different control factors. The Tuanhe islands
is mainly controlled by structural factors, while Qixing Island is mainly
controlled by random factors. The ecosystem service value of Tuanhe Islands is
spatially clustered, while Qixing Island has a significant threshold of 900 m
for the value of ecosystem services. Before the 900 m scale, the value of
ecosystem services showed agglomeration, and beyond 900 m, the value of
ecosystem services showed a random phenomenon.
Author
Contributions
Zhang, Q. designed the
study. Tian, Y. C.
contributed to the data processing and analysis. Tao, J. designed algorithm. Zhang,
Q. and Tian, Y. C. wrote the paper. Han, X. finished the data validation. Zhang, Y. L., Lin, J. L.
and Yang, Y. W. made corrections to dataset and paper.
References
[1]
Costanza, R., d??Arge, R., de Groot, R., et al. The value of the world??s ecosystem services and natural capital
[J]. World Environment, 1997, 387(1): 3‒15.
[2]
Costanza, R., d??Arge, R., de Groot, R., et al. The value of the world??s ecosystem services and nature
capital [J]. Nature, 1997, 387:
253‒260.
[3]
Gren, I. M., Groth, K. H., Sylv??n, M. Economic values of Danube
Floodplains [J]. Journal of Environmental
Management, 1995, 45: 333‒345??
[4]
Ouyang, Z. Y., Wang, R. S., Zhao, J. Z. Ecosystem services and
their economic valuation [J]. Chinese
Journal of Applied Ecology, 1999, 10(5): 635‒640.
[5]
Xie, G. D., Lu, C. X., Cheng, S. K. Progress in evaluating the
global ecosystem services [J]. Resources
Science, 2001, 23(6): 2‒9.
[6]
Sun, H. L., Li, W. H., Chen, Y. P., et al. Response of ecological services value to land use change in
the Ili River Basin [J]. Acta Ecologica
Sinica, 2010, 30(4): 887‒894.
[7]
Wu, H. Z., A, R. H., Guo, T. B., et al. Impacts of land use change on ecosystem services value in
Duolun county of Inner Mongolia based on RS and GIS [J]. Scientia Geographica Sinica, 2011(1): 110‒116.
[8]
Zhu, W. Q., Zhang, J. S., Pan, Y. Z., et al. Measurement and dynamic analysis of ecological capital of terrestrial
ecosystem in China [J]. Chinese Journal
of Applied Ecology, 2007, 18(3): 586‒594.
[9]
Shi, Y., Wang, R. S, Huang, J. L., et al. An analysis of the spatial and temporal changes in Chinese
terrestrial ecosystem service function [J]. Chinese
Science Bulletin, 2012, 1(9): 720‒731.
[10]
Zhang,
Q., Tian, Y. C., Huang, Y. L., et al. Ecosystem service value evaluation dataset on Qingxing
Island in Beibu Gulf, China [J/DB/OL]. Digital
Journal of Global Change Data Repository, 2020. https://doi.org/ 10.3974/10.3974/geodb.2020.07.14.V1.
[11]
Zhang, Q., Tian, Y. C., Huang, Y. L., et al. Ecosystem service value
evaluation dataset on Tuanhe Island in Beibu Gulf, China [J/DB/OL]. Digital
Journal of Global Change Data Repository, 2020. https://doi.org/ 10.3974/10.3974/geodb.2020.07.15.V1.
[12]
GCdataPR
Editorial Office. GCdataPR data sharing policy [OL]. https://doi.org/10.3974/10.3974/dp.
policy.2014.05 (Updated
2017).
[13]
Xie, G. D., Zhen, L., Lu, C. X., et al. Expert knowledge based valuation method of ecosystem services
in China [J]. Journal of Natural
Resources, 2008, 23(5): 911‒919
[14]
Hu, H. B., Liu, H. Y., Hao, J. F., et al. Effects of urbanization on the spatial heterogeneity of watershed
ecosystem services value: a case study of Jiuxiang River watershed in Nanjing
city [J]. Journal of Natural Resources,
2011, 26(10): 1715‒1725.
[15]
Xiao, Y., Xie, G. D., An, K. Economic value of ecosystem services
in Mangcuo Lake drainage basin [J]. Chinese
Journal of Applied Ecology, 2003, 14(5): 676‒680.
[16]
Tian, Y. C., Huang, Y. L., Zhang, Q., et al. A comparative study of spatial heterogeneity of ecosystem service
value in typical islands in Beibu Gulf [J]. Marine
Sciences, 2019. 43(2): 60‒68.
[17]
Xun, C. X., Zhang, Z. W., Huang, P., et al. Application of
ecosystem services value assessment in coastline protection and utilization
planning of Qinzhou city [J]. Marine
Environmental Science, 2019, 38(6): 911‒918.
[18]
Pimentel, D., Wilson, C., Mccullum, C., et al. Economic and environmental benefits of biodiversity [J]. Bioscience, 1997, 47(11): 747‒757.
[19]
Xu, L. H., Yue, W. Z., Cao, Y. Spatial scale effect of urban land
use landscape pattern in Shanghai city [J]. Chinese
Journal of Applied Ecology, 2007, 18(12): 2827‒2834.