Methodology
of 0.625????0.4712?? Raster Dataset Development of
Temperature at the Top of Permafrost and Active Layer Thickness in the Northern
Hemisphere (2015-2100)
Wu, X. R.1, 2 Zhao, N.1, 2, 3* Ye, Y. L.4
1. State Key Laboratory of Resources and Environmental
Information System, Institute of Geographic Sciences and Natural Resources
Research, Chinese Academy of Sciences, Beijing 100101, China;
2. College of Resources and Environment, University of
Chinese Academy of Sciences, Beijing 100049, China;
3. Jiangsu Center for Collaborative Innovation in
Geographic Information Resource Development and Application, Nanjing 210023,
China;
4. Zhengyuan Geomatics Group
Co., Ltd., Beijing 101300, China
Abstract: Understanding the spatial distribution and dynamics of current
and future permafrost is critical for global carbon flow simulation, climate
change prediction, and engineering risk assessment. The 0.625??x0.4712?? raster
dataset of temperature at the top of permafrost and active layer thickness in
the northern hemisphere (2015-2100)
was developed using the widely validated and applied Kudryavtsev method, which
integrates the effects of temperature, snow, vegetation, and soil on
permafrost, based on the model outputs from the sixth phase of the
International Coupled Model Intercomparison Project (CMIP6) and the SoilGrids
2.0 dataset. The data were calculated under four different scenarios, SSP126,
SSP245, SSP370, and SSP585, from 2015 to 2100. The permafrost area was obtained
based on the temperature at the top of the permafrost. This dataset fills the gap in permafrost distribution data for the
future under different scenarios for CMIP6. It includes the data covering 2015-2100: (1) mean annual temperature at the top of the permafrost;
(2) annual active layer thickness; and (3) annual permafrost area. The resolution
of the spatial data is 0.625??x0.4712??. The dataset is archived in .tif and .xls
data formats, and consists of 690 data files with data size of 35.6 MB (Compressed
to one single file with 27.9 MB).
Keywords: permafrost;
temperature at the top of permafrost; active layer thickness; Kudryavtsev;
CMIP6; northern hemisphere; Prediction
DOI: https://doi.org/10.3974/geodp.2022.03.19
CSTR: https://cstr.escience.org.cn/CSTR:20146.14.2022.03.19
Dataset Availability Statement:
The dataset
supporting this paper was published and is accessible through the Digital Journal of
Global Change Data Repository at: https://doi.org/10.3974/geodb.2022.08.01.V1 or
https://cstr.escience.org.cn/CSTR:20146.11.2022.08.01.V1.
1 Introduction
Permafrost
is ground with temperatures below 0 ??C that has been frozen for at least two
consecutive years[1], occupies approximately 25% of the global land
surface[2] and affects most northern hemisphere regions to varying
degrees[3]. Closely linked to several domains, such as the
atmosphere, hydrosphere, and lithosphere, permafrost is highly susceptible to
environmental influences and has significant feedbacks on other domains. In the
last decades, shrinking permafrost areas and increasing active layer thickness
have become increasingly prominent due to global warming[4]. The
degradation of permafrost has caused a series of complex and serious
consequences. For example, the change of permafrost to seasonally frozen ground
increases the emissions of organic carbon and methane in the soil, further
contributing to global warming[5]. In addition, the degradation of
permafrost changes the physical and chemical properties of the surface and subsurface
in the local and surrounding areas, posing a serious safety risk to
infrastructure and engineering projects[6]. Furthermore, warming of
permafrost-influenced soil has a direct impact on Arctic ecosystems[6].
Therefore, evaluating the spatial distribution and dynamics of current and
future permafrost is essential for global carbon flow simulation, climate
change prediction, and engineering risk assessment[2].
Several studies
have been conducted to estimate the future distribution of permafrost and
active layer thickness using empirical formulas or physical models[2, 7?C9].
However, most of them have not published the corresponding datasets, which has
somewhat delayed the launch of subsequent studies. In terms of the data chosen,
no studies have used the sixth phase of the International Coupled Model
Intercomparison Project (CMIP6) model outputs as climate input to develop data
on the future dynamics of permafrost in the northern hemisphere, while the
near-surface air temperature and snow thickness available in the CMIP6 have
been shown to be the most important factors influencing permafrost models[10].
In addition, most previous studies have been conducted over a period of more
than ten or several decades, and this temporal resolution does not meet the
needs of studies with shorter study periods. Researchers have also been unable
to obtain the average state or series of permafrost data for their own study
period. The semi-empirical and semi-theoretical Kudryavtsev method has been
shown to be more effective and widely used for calculating permafrost active
layer thickness under different climatic conditions[10?C13] and is
suitable for large-scale applications in the northern hemisphere.
In this study,
the Kudryavtsev method was applied, using the model outputs from CMIP6
(CMCC-CM2-SR5[14] and CMCC-ESM2[15]) and SoilGrids 2.0[16]
soil data, to calculate the time series of the temperature at the top of
permafrost and active layer thickness in permafrost areas on a yearly scale in
the northern hemisphere. This dataset fills the gap in permafrost data for the
future under different scenarios for CMIP6 and provides data support for
research related to permafrost degradation, climate change, and Arctic ecology.
2 Metadata of the Dataset
The metadata of the
0.625????0.4712?? raster dataset of temperature at the top of permafrost and active
layer thickness in the northern hemisphere (2015-2100)[17] is summarized in Table 1.
It includes the dataset full name, short name, authors, year of the dataset,
temporal resolution, spatial resolution, data format, data size, data files,
data publisher, and data sharing policy, etc.
Table 1 Metadata summary of the 0.625????0.4712?? raster dataset
of temperature at the top of permafrost and active layer thickness in the
northern hemisphere (2015-2100)
|
Items
|
Description
|
|
Dataset full name
|
0.625????0.4712??
raster dataset of temperature at the top of permafrost and active layer thickness
in the northern hemisphere (2015-2100)
|
|
Dataset short
name
|
NH_Permafrost_2015-2100
|
|
Authors
|
Wu, X. R.,
Institute of Geographic Sciences and Natural Resources Research, Chinese Academy
of Sciences, wu_xiaoran@outlook.com
Zhao, N.,
Institute of Geographic Sciences and Natural Resources Research, Chinese
Academy of Sciences, zhaon@lreis.ac.cn
|
|
Geographical
region
|
Northern
hemisphere
|
|
Year
|
2015-2100
|
|
Temporal
resolution
|
Yearly
|
|
Spatial
resolution
|
0.625????0.4712??
|
|
Data format
|
.tif, .xls
|
|
|
|
Data size
|
35.6 MB
|
|
|
|
Data files
|
(1) mean annual
temperature at the top of permafrost; (2) annual active layer thickness; and
(3) annual permafrost area
|
|
Foundation
|
Chinese Academy
of Sciences (XDA20030203)
|
|
Computing
environment
|
Microsoft 365, ArcGIS, R
|
|
Data publisher
|
Global Change Research Data Publishing & Repository,
http://www.geodoi.ac.cn
|
|
Address
|
No. 11A, Datun
Road, Chaoyang District, Beijing 100101, China
|
|
Data sharing
policy
|
Data from the Global
Change Research Data Publishing & Repository includes metadata, datasets (in the Digital Journal of Global Change Data Repository), and
publications (in the Journal of Global Change Data & Discovery). Data sharing policy includes: (1) Data are openly
available and can be free downloaded via the Internet; (2) End users are
encouraged to use Data subject to citation; (3) Users, who are by definition
also value-added service providers, are welcome to redistribute Data
subject to written permission from the GCdataPR Editorial Office and the
issuance of a Data redistribution license; and (4) If Data are used to compile
new datasets, the ??ten per cent principal?? should be followed such that Data
records utilized should not surpass 10% of the new dataset contents, while
sources should be clearly noted in suitable places in the new dataset[18]
|
|
Communication and searchable system
|
DOI, CSTR, Crossref, DCI, CSCD,
CNKI, SciEngine, WDS/ISC, GEOSS
|
3 Methods
3.1 Data Collection
CMIP6
has the largest number of models involved, the most well-designed scientific experiments,
and the largest amount of simulation data available in the more than 20 years
of the CMIP program[19]. It uses a combined matrix of shared
socio-economic pathways (SSPs, representing different development patterns of
future economic and social systems) and representative concentration pathways
(RCPs, representing target radiative forcing values for the end of the 21st
century) to form different scenarios for the future. Scenario SSP126 is a combination
of scenario SSP1 (sustainability) and scenario RCP2.6. Scenario SSP245 is a
combination of scenario SSP2 (middle of the road) and scenario RCP4.5. Scenario
SSP370 is a combination of scenario SSP3 (regional rivalry) and scenario
RCP7.0. Scenario SSP585 is a combination of scenario SSP5 (fossil-fuelled
development) and scenario RCP8.5.
In this study,
near-surface air temperature (tas), snow thickness (snd) and soil moisture
(mrso) from two models, CMCC-CM2-SR5[14] and CMCC-ESM2[15],
were selected based on temporal resolution, spatial resolution and
experiment-driven conditions. These variables span the 2015-2100 period with a global spatial resolution of 288??192 pixels and
have outputs under four typical scenarios (SSP126, SSP245, SSP370 and SSP585).
The SoilGrids
2.0 dataset[16] uses state-of-the-art machine learning methods to
map the global spatial distribution of soil properties with a spatial
resolution of 250 m and contains six standard depth intervals (0-5 cm, 5-15 cm, 15-30 cm, 30-60 cm, 60-100 cm and 100-200 cm).
Five parameters from SoilGrids 2.0 were selected in this study: clay content, t
sand content, silt content, soil organic matter content and soil bulk density.
Soil data from six intervals were weighted and averaged and resampled to a spatial
resolution of 0.625????0.4712??.
3.2 Kudryavtsev Method
The
Kudryavtsev method is a widely used and validated semi-empirical approach that
integrates the effects of snow, vegetation, soil moisture, soil thermal
properties and other factors on the active layer. It divides the complex
atmosphere-permafrost system into separate components and considers the thermal
conditions of the components individually[20]. The main calculations
are as follows[1, 2, 8, 10, 21].
The Kudryavtsev
method assumes that the annual variation in air temperature can be approximated
as a cosine function. Then, the temperature T(t) can be expressed as:
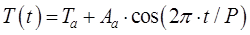 (1)
(1)
where Ta and Aa are the annual mean
air temperature and the annual mean air temperature amplitude, respectively. t
is time, and P is the period of temperature change (1 year).
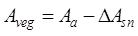
The surface temperature can be considered the result of the effect of
air temperature through snow and vegetation; therefore, the annual mean surface
temperature (Ts) and the annual mean surface temperature
amplitude (As) can be expressed as:
 (2)
(2)
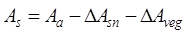 (3)
(3)
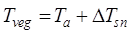
where ∆Tsn and ∆Asn are the snow cover
effects on the mean annual air temperature and the
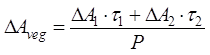
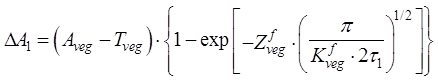
seasonal amplitude, respectively. Similarly, ∆Tveg and ∆Aveg are the vegetation effects on the mean annual air temperature and the
seasonal amplitude, respectively.
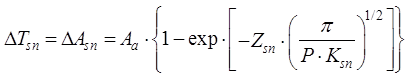 (4)
(4)
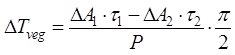 (5)
(5)
 (6)
(6)
 (7)
(7)
 (8)
(8)
 (9)
(9)
 (10)
(10)
where Zsn and Ksn
are the thickness and the thermal diffusion coefficient of snow, respectively. ??1 and ??2 are the durations of the cold and warm periods, respectively.
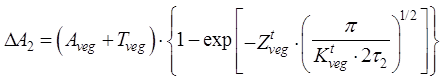
Zvegt/f and Kvegt/f are the thickness and
the thermal diffusion coefficient of the vegetation in the thawed/ freezing
state, respectively.
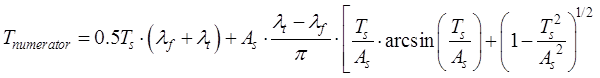
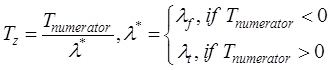
Finally, the mean annual temperature at the
depth of seasonal thaw (Tz),
i.e., the temperature at the top of the permafrost, can be expressed as:
 (11)
(11)
 (12)
(12)
where ??t/f
is the thermal conductivity of the soil in the thawed/freezing state.
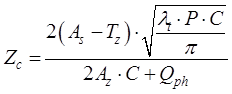
The
active layer thickness (Z) is
calculated as:
 (13)
(13)
 (14)
(14)
 (15)
(15)
 (16)
(16)
where Ct/f is the volumetric heat
capacity of the soil in the thawed/frozen state and Qph is the phase
transition heat in the active layer.
4 Data Results and Validation
4.1 Data Composition
The
ActiveLayerThickness folder contains active layer thickness data in 344 files.
The Temperature folder contains temperature at the top of the permafrost data
in 344 files. File ??NH_PermafrostArea.xls?? is the permafrost area time series
data in km2. The ??ReadMe.txt?? is the instructions file.
4.2 Data Products
As
shown in Figure 1, the permafrost in the northern hemisphere is mainly
distributed in three regions, the mid and high latitudes of northeastern
Eurasia, the high latitudes of the northern North American continent and the
Tibetan Plateau, in decreasing order of area. In the first two regions, the
active layer thickness decreases from south to north, while the thinnest active
layers in the Tibetan Plateau region are in the western and central-northern
regions.
The distribution of permafrost degradation
is similar across the four scenarios for the 2015-2050 period. It is mainly found in the southwestern Eurasian
permafrost region and in the southern North American continental permafrost
region. The northwestern Qinghai-Tibet Plateau region shows a smaller decrease in
permafrost area, while the change in active layer thickness increases with
increasing latitude.
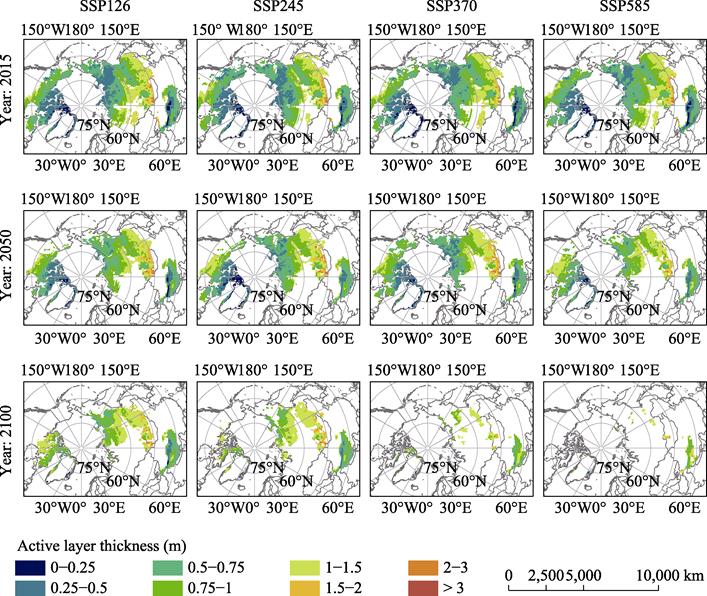
Figure 1 Active layer thickness in the northern
hemisphere under different scenarios in 2015, 2050 and 2100
Between 2050 and
2100, the differences in permafrost degradation between the scenarios are
highly significant. (1) Scenario SSP126: relatively little area of permafrost
loss and a small increase in active layer thickness, mainly in the northern
North American continental permafrost region and the eastern Eurasian
permafrost region. (2) Scenario SSP245: significant decrease in permafrost area
in the southern North American continental and Eurasian permafrost regions,
with a rapid increase in active layer thickness in the northernmost North
American continental permafrost regions. (3) Scenario SSP370: significant
reduction in permafrost area in the northern hemisphere, with near
disappearance of permafrost in the northern North American continent permafrost
region and severe degradation of permafrost in the Eurasian and Qinghai-Tibet
Plateau permafrost regions. (4): Scenario SSP585: near disappearance of
permafrost area in the northern hemisphere, significant increase in active
layer thickness in the remaining permafrost regions and severe permafrost degradation
on the Qinghai-Tibet Plateau.
As shown in Figure 2, the northern hemisphere
permafrost area in 2015 was approximately 20.99??106 km2
(estimated under scenario SSP245). In addition, the northern hemisphere permafrost
area shows a fluctuating decreasing trend under all four scenarios: SSP126,
SSP245, SSP370 and SSP585. Specifically, the end-of-century permafrost areas
under the four scenarios are 10.62??106 km2, 8.48??106
km2, 3.13??106 km2 and 1.34??106 km2,
which represent decreases of 49.37%, 59.60%, 85.09% and 93.63%, respectively,
compared to 2015.
|
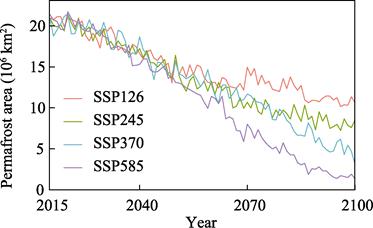
Figure 2 Time series of the northern hemisphere
permafrost area under different scenarios (2015-2100)
|
4.3 Data Validation
CMIP6 provides model
outputs under different scenarios from 2015 to 2100; therefore, there are no
corresponding ground observations that can be used as validation data.
Generally, the way to assess the accuracy of time series prediction models is
to validate the historical re-
cord.
Numerous studies using the Kudryavtsev method have been conducted in different
regions[1, 10?C13, 20?C22] and they concluded that this model is able
to simulate the permafrost distribution and active layer thickness well. Among
the model input data in this study, the model outputs of CMIP6 are currently
the most authoritative and applied data for predicting environmental variables
under different scenarios[19], while SoilGrids 2.0 is a widely used
high-precision soil dataset[16].
The area of
permafrost in the northern hemisphere estimated in this study was approximately
20.99??106 km2 in 2015, compared to 21.64??106
km2 (2014-2018)[2],
22.79??106 km2 (1920s-1990s)[23] and 19.96??106 km2 (2000-2015, without considering vegetation effects)[24].
Therefore, the estimates of permafrost area in the northern hemisphere in this
study can be considered reasonable.
5 Discussion and Conclusion
The
accuracy of the Kudryavtsev method has been well validated in historical
records. However, some model inputs, such as vegetation properties and soil
texture, are often set to constant values due to their unavailability under
different future scenarios, which affects the model accuracy. In addition,
near-surface air temperature and snow thickness are the most critical factors
in the permafrost model, but the coarse resolution of the CMIP6 model outputs
leads to the coarse resolution of the produced dataset. This makes it difficult
and uncertain to directly apply the dataset to local studies with large spatial
heterogeneity.
Shrinking the
permafrost area and increasing the active layer thickness will result in serious
climate feedbacks, ecological problems and engineering risks, while global climate
change has been accelerating permafrost degradation. Their interactions may
cause more complex and unpredictable changes to the climate, ecology and other
environments in the future. Predicting the future development of permafrost
will help to understand the response of permafrost to global climate change and
to prepare for possible ecological and engineering problems. Given the lack of
predictive data of future northern hemisphere permafrost, this study developed
a time series of permafrost data under different scenarios using the
Kudryavtsev method, which has been shown to perform well, with the CMIP6 model
outputs and SoilGrids dataset as input. The dataset provides predictions of the
spatial distribution, active layer thickness and area changes of permafrost for
up to 86 years, providing data support for research related to permafrost
degradation, climate change and Arctic ecology.
Author Contributions
Zhao,
N. was primarily responsible for the dataset design and reviewed the data
paper; Wu, X. R. collected and processed data such as soil and climate and
wrote the data paper; Ye, Y. L. optimized the model algorithm and reviewed the
data paper.
Conflicts of
Interest
The
authors declare no conflicts of interest.
References
[1]
Shiklomanov, N. I., Nelson, F.
E. Analytic representation of the active layer thickness field, Kuparuk River
Basin, Alaska [J]. Ecological Modelling,
1999, 123(2/3): 105‒125.
[2]
Li,
G. J., Zhang, M. Y., Pei, W. S., et al.
Changes in permafrost extent and active layer thickness in the Northern
Hemisphere from 1969 to 2018 [J]. Science
of the Total Environment, 2022, 804: 150182.
[3]
Zhang, T., Barry, R., Knowles,
K., et al. Statistics and
characteristics of permafrost and ground-ice distribution in the northern
hemisphere [J]. Polar Geography,
2008, 31(1/2): 47‒68.
[4]
Streletskiy,
D. Permafrost degradation [C]. In: Haeberli, W., Whiteman, C. (eds). Snow and
Ice-Related Hazards, Risks, and Disasters (Second Edition). Amsterdam:
Elsevier, 2021: 297?C322. https://doi.org/10.1016/B978-0-12-817129-5.00021-4.
[5]
Moon, T. A., Overeem, I.,
Druckenmiller, M., et al. The
Expanding Footprint of Rapid Arctic Change [J]. Earth??s Future, 2019,
7(3): 212‒218.
[6]
Melvin,
A. M., Larsen, P., Boehlert, B., et al.
Climate change damages to Alaska public infrastructure and the economics of
proactive adaptation [J]. Proceedings of
the National Academy of Sciences, 2017, 114(2): E122-E131.
[7]
Wu, Q. B., Li, X., Li, W. J.
The prediction of permafrost change along the Qinghai-Tibet Highway, China [J].
Permafrost and Periglacial Processes,
2000, 11(4): 371‒376.
[8]
Liu, L., Zhao, D. S., Wei, J.
Q., et al. Permafrost sensitivity to
global warming of 1.5 degrees C and 2 degrees C in the northern hemisphere [J].
Environmental Research Letters, 2021,
16(3): 034038.
[9]
Zhao,
S. M., Cheng, W. M., Yuan, Y. C., et al.
Global permafrost simulation and prediction from 2010 to 2100 under different
climate scenarios [J]. Environmental
Modelling & Software, 2022,
149: 105307.
[10]
Wang,
K., Jafarov, E., Overeem, I. Sensitivity evaluation of the Kudryavtsev
permafrost model [J]. Science of the
Total Environment, 2020, 720: 137538.
[11]
Panda,
S., Romanovsky, V., Marchenko, S. High-resolution permafrost modeling in the
Arctic Network National Parks, Preserves and Monuments [R]. Colorado: National
Park Service, 2016. https://irma.nps.gov/DataStore/Reference/Profile/2237720.
[12]
Streletskiy, D. A.,
Shiklomanov, N. I., Nelson, F. E. Spatial variability of permafrost
active-layer thickness under contemporary and projected climate in Northern
Alaska [J]. Polar Geography, 2012,
35(2): 95‒116.
[13]
Sazonova, T. S., Romanovsky, V.
E. A model for regional-scale estimation of temporal and spatial variability of
active layer thickness and mean annual ground temperatures [J]. Permafrost and Periglacial Processes,
2003, 14(2): 125‒39.
[14]
Lovato,
T., Peano, D. CMCC CMCC-CM2-SR5 model output prepared for CMIP6 ScenarioMIP. Version
20200622 [DS]. Earth System Grid Federation, 2020. https://doi.org/10.22033/ESGF/CMIP6.1365.
[15]
Lovato,
T., Peano, D., Butenschön, M. CMCC CMCC-ESM2 model output prepared for CMIP6 ScenarioMIP.
Version 20210202 [DS]. Earth System Grid Federation, 2021.
https://doi.org/10.22033/ESGF/CMIP6.13168.
[16]
Poggio, L., De Sousa, L. M.,
Batjes, N. H., et al. SoilGrids 2.0:
producing soil information for the globe with quantified spatial uncertainty
[J]. Soil, 2021, 7(1): 217‒240.
[17]
Wu, X. R., Zhao, N.
0.625????0.4712?? raster dataset of temperature at the top of permafrost and
active layer thickness in the northern hemisphere (2015-2100) [J/DB/OL]. Digital
Journal of Global Change Data Repository, 2022. https://doi.org/10.3974/geodb.2022.08.01.V1.
https://cstr.escience.org.cn/CSTR:
20146.11.2022.08.01.V1.
[18]
GCdataPR Editorial Office.
GCdataPR data sharing policy [OL]. https://doi.org/10.3974/dp.policy.2014.05
(Updated 2017).
[19] Eyring, V., Bony, S., Meehl, G. A., et al. Overview of the Coupled Model
Intercomparison Project Phase 6 (CMIP6) experimental design and organization
[J]. Geoscientific Model Development,
2016, 9(5): 1937‒1958.
[20]
Wang, C. H., Jin, S. L., Wu, Z.
Y., et al. Evaluation and application
of the estimation methods of frozen (thawing) depth over China [J]. Advances in Earth Science, 2009,
24(2):132‒140.
[21]
Anisimov, O. A., Shiklomanov,
N. I., Nelson, F. E. Global warming and active-layer thickness: results from
transient general circulation models [J]. Global
and Planetary Change, 1997, 15(3/4): 61‒77.
[22]
Wang, C. H., Jin, S. L., Shi,
H. X. Area change of the frozen ground in China in the next 50 years [J]. Journal of Glaciology and Geocryology,
2014, 36(1): 1‒8.
[23]
Zhang, T., Heginbottom, J. A.,
Barry, R. G., et al. Further
statistics on the distribution of permafrost and ground ice in the northern
hemisphere [J]. Polar Geography,
2000, 24(2): 126‒131.
[24]
Shi, Y. Y., Niu, F. J., Lin, Z.
J., et al. Freezing/thawing index
variations over the circum-Arctic from 1901 to 2015 and the permafrost extent
[J]. Science of the Total Environment,
2019, 660: 1294‒1305.