Dataset
of Blue Algae in Taihu Lake Based on Random Forest Algorithm and Satellite
Monitoring (2019)
Yang, Z.1,2 Pan, X.2,3* Yuan,
J. 1,2 Song ,H.
1,2 Xu, K. 1,2 Wu, Y. H. 1,2 Yang, Y. B.2,3*
1. School
of Earth Sciences and Engineering, Hohai University, Nanjing 211100, China;
2. Jiangsu
Province Engineering Research Center of Water Resources and Environment
Assessment Using Remote Sensing, Hohai University, Nanjing 211100;
3. School
of Geography and Remote Sensing, Hohai University, Nanjing 210098, China
Abstract: The
cyanobacteria data of Taihu Lake represent essential and important data for the
water resource management of Taihu Lake. In this paper, a GF-6 satellite image
of Taihu Lake in 2019 is selected, and the random forest method based on multiple
remote sensing factors (Normalized Differential Vegetation Index and Normalized
Differential Water Index) is used to extract cyanobacteria to obtain a
cyanobacteria dataset for the western part of Taihu Lake in 2019. The dataset
was validated using the overall classification accuracy, Kappa coefficient,
producer accuracy, user accuracy, misclassification error, and omission error.
The validation results showed that the mean overall classification accuracy and
Kappa coefficient for this dataset reached 0.97 and 0.95, respectively. The
dataset includes cyanobacteria distribution data from May to December 2019 for
six periods. The spatial resolution of the dataset is 20 m. The dataset is archived
in the .tif format, and it consists of six data files with a data size of 0.98
MB (compressed into one file, 601 KB).
Keywords: Taihu
Lake; cyanobacteria; random forest; 2019
DOI: https://doi.org/10.3974/geodp.2023.03.11
CSTR: https://cstr.escience.org.cn/CSTR:20146.14.2023.03.11
Dataset Availability Statement:
The dataset supporting this paper was published and is accessible
through the Digital Journal of Global
Change Data Repository at: https://doi.org/10.3974/geodb.2023.12.01.V1 or
https://cstr.escience.org.cn/CSTR:20146.11.2023.12.01.V1.
1 Introduction
Taihu
Lake is the second-largest freshwater lake in China. With the rapid development
of the economy and the expansion of industry, the phytoplankton in Taihu Lake
have multiplied, resulting in an outbreak of cyanobacteria. This has damaged
the ecosystem of Taihu Lake and affected the domestic water supply of the
surrounding cities. Therefore, it is important to monitor the outbreak of
cyanobacteria in Taihu Lake[1,2]. The traditional monitoring method
for blue-green algae is to collect water samples on site, but this method
requires high manpower and material resources, and the number of sampling
points that can be used is limited. Remote sensing technology allows
large-scale monitoring, and it is low cost and provides a fast response.
Therefore, in recent years, monitoring blue-green algae based on remote sensing
images has been a research direction of concern for domestic and foreign
scholars. GF-6 is the first optical imaging satellite with a red edge band in
China; it can better monitor vegetation, and cyanobacteria and vegetation have
similar spectral characteristics. Therefore, it is reasonable to generate the
Taihu Lake cyanobacteria dataset based on GF-6 satellite data.
The methods for
extracting blue-green algae locations based on remote sensing data mainly
include empirical modelling, threshold, and machine learning methods[3?C7].
The empirical model method establishes a nonlinear or linear model of an index
and measured chlorophyll concentration, and then it monitors blue-green algae
through the chlorophyll concentration; however, this method has regional
limitations[8, 9]. The threshold method extracts blue-green algae by
setting a single band or exponential threshold, but the accurate selection of
the threshold is a challenge[10, 11]. Machine learning methods are
based on feature indicators to classify and extract blue-green algae; these
methods can mine big data patterns, and they include support vector machines
and random forest methods[12]. The random forest method is a popular
method in machine learning and has been successfully applied to parameter
inversion.
Therefore, random
forest extraction based on GF-6 data can better meet the requirements of the
long-term and high-precision dynamic monitoring of cyanobacteria in Taihu Lake
in the future. This dataset is based on a 2019 GF-6 image of Taihu Lake of good
quality, and it uses the random forest method to achieve the extraction of
blue-green algae in Taihu Lake. This paper describes the generation of Taihu
Lake blue-green algae data products for 2019.
2 Metadata of
the Dataset
The
metadata of the Cyanobacteria dataset of
random forest algorithm for satellite monitoring in Taihu Lake (2019)[13] is summarized in Table 1.
3 Methods
3.1 Algorithm Principle
This
dataset mainly uses the random forest (RF) algorithm, which is a special
bagging algorithm proposed by Leo[15] for classification or
regression. The difference between the RF method and the original bagging
algorithm is that the RF method uses a decision tree as the model. In this
paper, the RF classification algorithm is used, and the class to which the
current object belongs is obtained by voting through the decision tree. The
establishment of an RF model requires representative values of the input
variables and classification results; finally, predictions of the results are
obtained based on the RF model[16].
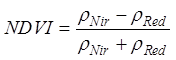
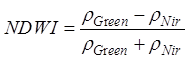
The input
variables selected in this dataset are the Normalized Differential Vegetation
Index (NDVI) and Normalized Differential Water Index (NDWI) because ideally,
Taihu Lake only has two kinds of surface features: water and cyanobacteria. The
NDVI and NDWI can identify vegetation and water bodies, respectively.
Therefore, the NDVI and NDWI are used as input variables for the RF method:
 (1)
(1)
 (2)
(2)
Table 1
Metadata summary of
the Cyanobacteria dataset of random forest algorithm for satellite monitoring
in Taihu Lake (2019)
|
Items
|
Description
|
|
Dataset full name
|
Cyanobacteria dataset
of random forest algorithm for satellite monitoring in Taihu Lake (2019)
|
|
Dataset short
name
|
Taihu_Cyanobacteria
|
|
Authors
|
Yang, Z., School of Earth Sciences and Engineering, Hohai
University, 18339161755@163.com
Pan, X., School of Geography and Remote
Sensing, Hohai University, px1013@hhu.edu.cn
Yuan, J., School of Earth Sciences and
Engineering, Hohai University, yj000801@163.com
Xu, K., School of Earth Sciences and
Engineering, Hohai University, 919505610@qq.com
Wu, Y. H., School of Earth Sciences and
Engineering, Hohai University, yuhangwu2022@163.com
Yang, Y. B., School of Geography and
Remote Sensing, Hohai University, yyb@hhu.edu.cn
|
|
Geographical region
|
Taihu Lake, 30??55??40??N?C31??32??58??N??119??52??32??E?C120??36??10??E
|
|
Year
|
2019 Temporal
resolution 2 days Spatial
resolution 20 m
|
|
Data format
|
.tif Data
size 0.98 MB
|
|
|
Data files
|
The dataset
includes six files, namely, the blue-green algae image of the Taihu Lake on
May 5, 2019, July 29, 2019, September 13, 2019, October 29, 2019, November 5,
2019, and December 12, 2019
|
|
Foundations
|
National Natural
Science Foundation of China (41701487, 42071346, 42371397)
|
|
Data publisher
|
Global Change Research Data Publishing & Repository,
http://www.geodoi.ac.cn
|
|
Address
|
No. 11A, Datun
Road, Chaoyang District, Beijing 100101, China
|
|
Data sharing
policy
|
(1) Data
are openly available and can be free downloaded via the Internet; (2) End
users are encouraged to use Data subject to citation; (3)
Users, who are by definition also value-added service providers, are welcome
to redistribute Data subject to written permission from the GCdataPR Editorial
Office and the issuance of a Data redistribution license; and (4)
If Data
are used to compile new datasets, the ??ten per cent principal?? should be
followed such that Data records utilized should not
surpass 10% of the new dataset contents, while sources should be clearly
noted in suitable places in the new dataset[14]
|
|
Communication and searchable system
|
DOI, CSTR, Crossref, DCI, CSCD, CNKI,
SciEngine, WDS/ISC, GEOSS
|
where,  ,
,  , and
, and  represent the reflectance of the red,
near-red, and green bands, respectively. According to the band requirements of
the NDVI, the GF-6 satellite uses the third and fourth bands to calculate the
NDVI. According to the band requirements of the NDWI, the GF-6 satellite uses
the second and fourth bands to calculate the NDWI.
represent the reflectance of the red,
near-red, and green bands, respectively. According to the band requirements of
the NDVI, the GF-6 satellite uses the third and fourth bands to calculate the
NDVI. According to the band requirements of the NDWI, the GF-6 satellite uses
the second and fourth bands to calculate the NDWI.
3.2 Data Collection and
Processing
The
technical roadmap of this dataset is shown in Figure 1, which mainly consists
of three steps: data preparation, data pre-processing, and the establishment
and prediction of RF models. The main purpose of data preparation is to find
high-quality GF-6 data from 2019 with low cloud cover. The data pre- processing
mainly involves the radiometric correction, atmospheric correction, and
geometric correction of the original
high-resolution GF-6 data. Because the original high-resolution GF-6
data are in the form of digital number (DN) values obtained by satellites,
these data need to be pre-processed and converted into surface reflectance
values. The establishment and prediction process of the RF model mainly
involves calculating the values of the NDVI and NDWI based on the pre-treated
GF-6 data, using these two factors as the RF training data to establish the
model, and finally predicting the blue-green algae in Taihu Lake.
4 Data Results and Validation
4.1 Data Composition
The dataset of blue
algae in Taihu Lake in 2019 based on the random forest algorithm and satellite
monitoring consists of
a total of one folder. The folder contains six periods of blue-green
algae data in the format of labelled image files (.tif).
|

Figure 1 The technology roadmap of
dataset development
|
4.2 Data Result
Figure
2 is a spatial distribution map of the blue-green algae in Taihu Lake in 2019,
where the colours blue and green represent water and blue-green algae,
respectively. As there is aquatic vegetation in the eastern part of Taihu Lake,
the spatial distribution of this area will not be shown. On 5 May 2019, the
blue-green algae in Taihu Lake were mainly concentrated in the southern and
north-west coastal areas of Meiliang Lake. On 29 July 2019, the outbreak of
blue-green algae in Taihu Lake was significantly weakened. The outbreak of
blue-green algae was concentrated in Zhushan Lake and Meiliang Lake, and there
was a small amount of blue-green algae in Gonghu Lake. Compared with 29 July
2019, on 13 September 2019, blue-green algae began to erupt in the north-west,
south-west, and southern coastal areas of Taihu Lake, and they continued to
erupt in Meiliang Lake. On 19 October 2019, blue-green algae broke out in Taihu
Lake, mainly in the middle of Taihu Lake and Meiliang Lake. On 5 November 2019,
the blue-green algae outbreak in Taihu Lake weakened rapidly, and there was
almost no blue-green algae in Gonghu Lake. The blue-green algae outbreak was
mainly in Meiliang Lake and along the north-west coast. On 12 December 2019,
there were almost no cyanobacteria in Taihu Lake, and sporadic cyanobacteria
were mainly concentrated in the south-west coastal area. This shows that in
2019, the blue-green algae in Taihu Lake mainly broke out in autumn, spring,
and summer; there were almost no outbreaks of blue-green algae in winter.
4.3 Data Validation
4.3.1 Verification Method
The confusion matrix was used to calculate six
indicators, the overall classification accuracy, Kappa
coefficient, producer accuracy, user accuracy, misclassification error, and
missed classification error[17], to evaluate the extracted results.
This dataset was validated using pseudocolour images synthesised from the
near-red, red, and green bands as a reference. Through visual interpretation,
300 sample points (150 blue-green algae samples and 150 water samples) were
uniformly selected for validation.
4.3.2 Verification Results
The
accuracy evaluation of this dataset is shown in Table 2. It can be seen that
the average overall classification accuracy of this dataset reaches 0.97, and
the average Kappa coefficient also reaches 0.95. This indicates that the
accuracy of this dataset is relatively high. In particular, the overall
classification accuracy, producer accuracy, and user accuracyof the Taihu Lake
cyanobacteria results on 12 December 2019 reached 0.99. The accuracy of the
Taihu Lake cyanobacteria results on 12 December 2019 was highest in the six
Taihu Lake images. On 5 May 2019, the accuracy of the cyanobacteria results for
Taihu Lake was relatively low, and the overall classification accuracy, Kappa
coefficient, and
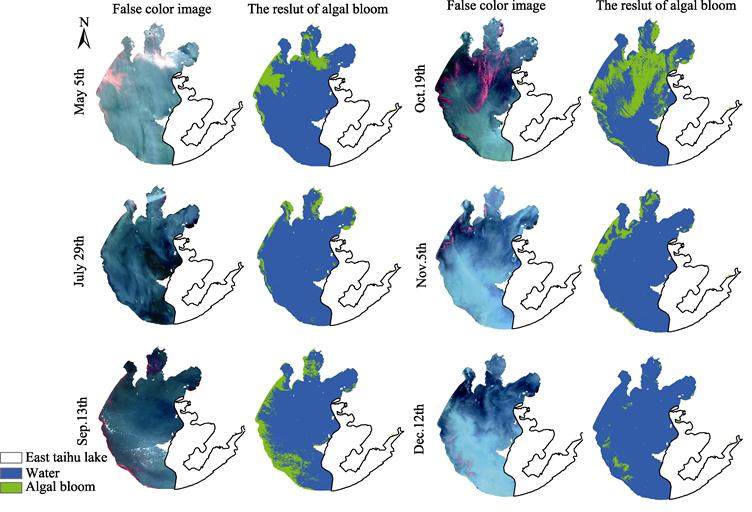
Figure 2 Maps of blue algae distribution
in Taihu Lake in 2019
producer
accuracy reached 0.95, 0.91, and 1.00, respectively. However, on 5 May 2019,
the cyanobacteria results for Taihu Lake wrongly classified water as
cyanobacteria, which may be due to the influence of thin clouds in the Taihu
Lake image from 5 May 2019. In conclusion, it can be seen from the table that
the RF method based on the NDVI and NDWI calculated from GF-6 data can better
extract the locations of cyanobacteria in Taihu Lake.
Table
2 The precision evaluation of the dataset
|
Date
|
Overall classification accuracy (%)
|
Kappa
|
Producer accuracy
|
User accuracy
|
Misclassification error
|
Omission error
|
|
May 5th
|
0.95
|
0.91
|
1.00
|
0.92
|
0.08
|
0.00
|
|
July 29th
|
0.98
|
0.97
|
1.00
|
0.97
|
0.03
|
0.00
|
|
Sep.13th
|
0.97
|
0.93
|
1.00
|
0.94
|
0.06
|
0.00
|
|
Oct.19th
|
0.96
|
0.98
|
1.00
|
0.96
|
0.04
|
0.00
|
|
Nov.5th
|
0.97
|
0.95
|
0.98
|
0.97
|
0.03
|
0.02
|
|
Nov.5th
|
0.99
|
0.98
|
0.99
|
0.99
|
0.01
|
0.01
|
|
Average
|
0.97
|
0.95
|
0.99
|
0.95
|
0.04
|
0.01
|
5 Discussion and Conclusion
Since
previous research on the extraction of cyanobacteria from Taihu Lake rarely
used domestic GF series satellite images as the data source, this design uses
the RF method to obtain a high-quality Taihu Lake cyanobacteria dataset for
2019 based on the GF-6 data. This dataset has undergone radiation correction,
atmospheric correction, and geometric correction, and the RF method trained on
the original high-resolution data was used to obtain predictions. The data
product contains the 2019 results of the Taihu Lake cyanobacteria, with a
relatively good original image quality, a spatial resolution of 20 m, and a
tagged image file format (.tif).
This dataset
provides data support for the environmental governance of Taihu Lake, and it is
of great significance for the dynamic monitoring of cyanobacteria in Taihu
Lake. Compared to the traditional threshold method for extracting blue-green
algae, the algorithm used to create this product avoids the uncertainty of
threshold values and is time-saving and labour-saving. However, the accuracy of
the algorithm in this product is strongly related to the number of training
samples and the distribution of the training samples, and the algorithm used to
create this product will need to consider the impact of clouds on the results
in the future.
Author Contributions
Pan, X. and Yang, Y.B designed the overall algorithms
of dataset. Yang, Z. and Yuan, J. contributed to the data processing and
analysis. Song, H., Xu,K. and Wu,Y.H. verify the data. Yang, Z. wrote the data paper.
Conflicts of Interest
The
authors declare no conflicts of interest.
References
[1]
Qin,
B. Q., Gao, G., Zhu, G. W., et al.
Lake eutrophication and its ecosystem response [J]. Chinese Science Bulletin, 2013, 58(10): 855?C864.
[2]
Zhu, L. Y. Remote sensing
monitoring and assessment of water quality for lakes [D]. Beijing: Institude of
Remote Sensing Applications, Chinese Academy of Sciences, 2006
[3]
Yang, Y., Hang, W. L., Xie, H.
B., et al. A study on water
information extraction method of cyanobacteria lake based on Landsat8 [J]. Remote Sensing for Land and Resources, 2020,
32(4) : 130?C136.
[4]
Wang,
M., Zheng, W., Liu, C., Application of Himawari-8 data with high-frequency
observation for Cyanobacteria bloom dynamically monitoring in Taihu Lake [J]. Journal of Lake Sciences, 2017, 29(5): 1043?C1053.
[5]
Shi, H., Li, X. W., Niu, Z. C.,
et al. Remote sensing information
extraction of aquatic vegetation in Taihu Lake based on Random Forest Model
[J]. Journal of Lake Sciences, 2016,
28(3): 635?C644.
[6]
Xia, X. R., Wei, Y. C., Xu, N.,
et al. Decision tree model of extracting blue-green algal blooms
information based on Landsat TM/ETM+ imagery in Taihu Lake [J]. Journal of Lake Sciences, 2014, 26(6):
907?C915.
[7]
Huang, J. Z., Zhao, R.,
Satellite remote sensing monitoring
of cyanobacteria outbreak in Taihu Lake [J]. Remote Sensing Information, 1999(4): 43?C44.
[8]
Li,
X. W., Shi, H., Zhang, Y., et al. Cyanobacteria
blooms monitoring in Taihu Lake based on the Sentinel-2A satellite of European
Space Agency [J]. Environmental
Monitoring in China, 2018, 34(4): 169?C176.
[9]
Miao, S., Wang, R., Li, J. C., et al. Retrieval algorithm of
phycocyanin concentration in inland lakes from Sentinel 3A-OLCI images [J]. Journal of Infrared and Millimeter Waves,
2018, 37(5): 621?C630.
[10]
Li, X. Z., Lv, H., Li, Y. M., et al. Spatial scale difference analysis
of cyanobacteria bloom extraction based on MODIS and GOCI data [C]. Jiangsu
Society of Oceanology and Limnology, 2013.
[11]
Li, Y. C., Sun, J. L., Xie, Z.
Q., et al. Extraction methods of
cyanobacteria bloom in Lake Tai based on MODIS vegetation index [J]. Journal of the Meteorological Sciences,
2011, 31(6): 737?C741.
[12]
Yang,
Z., Pan, X., You, C. S., et al. Spatio-temporal
variation of fractional vegetation coverage in the Aydingkol Lake Basin [J]. Journal of Applied Remote Sensing, 2022, 16(1): 1?C23.
[13]
Yang,
Z., Pan, X., Yuan, J., et al.
Cyanobacteria dataset of random forest algorithm for satellite monitoring in Taihu Lake (2019) [J/DB/OL]. Digital Journal of Global Change Data
Repository, 2023. https://doi.org/10.3974/geodb.2023.12.01.V1.
https://cstr.escience.org.cn/CSTR:20146.11.2023.12.01.V1.
[14]
GCdataPR Editorial Office.
GCdataPR data sharing policy [OL]. https://doi.org/10.3974/dp.policy.2014.05
(Updated 2017).
[15]
Breiman, L., Cutler, R. A.
Random forests machine learning [J]. Journal
of Clinical Microbiology, 2001, 45(1): 5?C32.
[16]
Pan,
X., Yang, Z., Yang, Y. B., et al. Comparison and applicability analysis of
methods for extracting cyanobacteria from Taihu Lake based on GF-6 data [J].
Journal of Lake Sciences, 2022, 34(6): 1866?C1876.
[17]
Yin,
J., Zhu, Y. F., Comparative study of water extraction methods in different
regions of OLI images [J]. Jiangxi
Science, 2020, 38(5): 743?C747.