Surface-soil Physicochemical Properties in
Near Industrial Areas in the Yanchi Desert Steppe
Xu, Z.1,2 Mi, W.
B.3 Mi, N.2 Tian, Y.4*
1. State
Key Laboratory of Urban and Regional Ecology, Research Center for
Eco-Environmental Sciences, Chinese Academy of Sciences, Beijing 100089, China;
2. College
of Agriculture, Ningxia University, Ningxia, Yinchuan 750021, China;
3. School
of Geography and Planning, Ningxia, Yinchuan 750021, China;
4. Ningxia
Forestry Research Institute, Ningxia, Yinchuan 750021, China
Abstract: With
rapid industrialization, insoluble pollutants are released into the environment
due to production, combustion, and transportation. The release of insoluble
pollutants can lead to the rapid deterioration of soil quality. Desert steppe
ecosystems are unique and are an important resource for ecological conservation
in China. The desert grasslands near the Gaoshawo industrial park, Yanchi county, China was used as the sampling area. The study area
is located in a different direction from the industrial park, 1–2 km apart, and
randomly distributed. The five-point cross-sampling method was used to sample
the surface soil (0–20 cm). The method included the collection of five soil
samples from each plot, which were mixed. A
total of 76 surface soil samples (0–20 cm) representing diferent pollution
sources were collected. The total N, total P, organic matter, available P,
available K, ammoniacal nitrogen, nitrate-nitrogen, and pH of the samples were analyzed
in the lab. The Pearson??s co-efficient was used to determine
the weightage of the soil quality index. A membership function model was
established and the status of soil quality in the study area was calculated by
using the soil-quality formula. On this basis, the geostatistics method in
ArcGIS 10.2 was used to make the spatial distribution map. The soil indicators
and analysis methods of the data collection are helpful to understand the soil
quality of the desert grasslands near industrial areas and provide a reference
for ecological conservation efforts of the desert grasslands. The dataset
includes geographic location data of sample points and content data of soil
physical and chemical indicators. The dataset is archived in .xls format, and
the data size is 63 KB (compressed into 1 file of 16.64 KB).
Keywords: desert steppe; soil quality; physical and chemical properties; spatial
interpolation
DOI: https://doi.org/10.3974/geodp.2022.02.14
CSTR: https://cstr.escience.org.cn/CSTR:20146.14.2022.02.14
Dataset Availability Statement:
The dataset supporting
this paper was published and is accessible through the Digital Journal of Global Change Data Repository at: https://doi.org/10.3974/geodb.2021.06.09.V1 or
https://cstr.escience.org.cn/CSTR:20146.11.2021.06.09.V1.
1 Introduction
Soil
quality can be defined as the ability of soil to sustain plant and animal
productivity, maintain or enhance water and air quality, and support human
health and habitats in natural and managed ecosystems[1,2].
Soil quality affects the diversity, functionality, and health of ecosystems[3–5]. The soil quality not
only depends on natural factors, but also by but also, anthropogenic factors,
such as industrial and agricultural activities[6].
In recent decades, urbanization and
industrialization in China have occurred at unprecedented rates[7].
Heavy metal elements are heavily released during production, transportation,
and combustion. Large- scale and
high-intensity coal mining activities have further threatened the fragile
ecosystems in northwest China. Ningxia, in the eastern part of northwestern
China, has an arid climate. The grassland types in this area are mainly desert
grasslands and steppes, which are distributed in the southern and eastern
regions of Ningxia. Coal, oil, and natural gas resources are located in the
area. Industrial activities, centered on the development and processing of
these natural resources, have greatly promoted local economic development but
have negatively impacted the environment. The fragile ecosystems in this region
make it susceptible to grassland degradation by improper resource utilization.
Therefore, heavy metal pollution has become an important factor to consider,
when evaluating the desert steppe soil quality.
The study area
is located west of the Gaoshawo town, Yanchi county, Ningxia
(106??49ʹ6.18ʺE, 38??07ʹ9.93ʺN) and is connected with the Mu Us Desert in
the Etuokeqian Banner of Inner Mongolia autonomous region in northern China. It
covers an area of 80.46 km2, at an altitude of 1,409 m, and has a
moderate temperate continental climate, with cold winters, hot summers, and an
average annual temperature and precipitation of 22.4 ??C and 276 mm,
respectively. The region is mainly composed of gentle slopes and hills and
contains a large amount of oil, coal, natural gas, and other resources. The soil
types are mainly calcareous and aeolian sandy soils, with loose particle
structure and low concentrations of organic matter and nutrients. The major
vegetation types in the area include Stipa breviflora, Agropyron
cristatum, Pennisetum centrasiaticum, Lespedeza potaninii, Potentilla
chinensis, and Artemisia scoparia Waldst. et Kit. The study area, which is the
main area for industrial production and raw material transportation, is crossed
by the Qingyin Expressway, 307 National Road, and the Taiyin Railway. In this
study, the measured dataset of surface soil quality, of desert steppe under
industrial activities, analyzed the measured soil quality indicators of the
desert grassland[8]. The results
of this study may serve as a reference for the sustainable development of
industries in desert steppes.
2 Metadata of the Dataset
The metadata of the Soil dataset of desert steppe surface
infected by industrial activities in Yanchi[8]
is summarized in Table 1. It includes the dataset full name, short name,
authors, year of the dataset, spatial resolution, data format, data size, data
files, data publisher, and data sharing policy, etc.
3 Methods
3.1 Sample Collection
In June 2019, a field survey based on a guide for grassland resources and
the comprehensive analysis of the slope, soil types, topographic features,
landscape features, and accessibility of the industrial park were conducted. At
different directions and distances from the industrial park, an interval of 1–2
km was used. A five-point cross-sampling method was used to analyze the surface
soil (0–20 cm), wherein five soil samples from each plot were
Table 1 Metadata summary of the Soil dataset
of desert steppe surface infected by industrial activities in Yanchi
|
Items
|
Description
|
|
Dataset full name
|
Soil dataset of desert steppe surface
infected by industrial activities in Yanchi
|
|
Dataset short
name
|
SoilDesertSteppeYanchi
|
|
Authors
|
Xu, Z.
AAS-2907-2021, Ningxia University, 496409847@qq.com
Mi, W. B.
AAS-2933-2021, Ningxia University, miwbao@ nxu.edu.cn
Mi, N.
AAS-2920-2021, Ningxia University, 705484905@qq.com
|
|
Geographical region
|
106º47ʹ17.16ʺE–107º0ʹ33.59ʺE, 38º03ʹ12.46ʺ–38º9ʹ24.95ʺ
|
|
Year
|
June 2019
|
|
Data format
|
.xls
|
|
|
|
Data size
|
63 KB (compressed
to one single file with 16.64 KB)
|
|
Data files
|
Measured data of
desert steppe soil quality in the study area: measured content of latitude
and longitude, total N, total P, organic matter, available P, available K,
ammoniacal nitrogen, nitrate nitrogen, and pH at 76 sampling points
|
|
Foundation
|
Key R&D
Project of Ningxia Autonomous Region (2018BEB04007)
|
|
Data publisher
|
Global Change Research Data Publishing & Repository,
http://www.geodoi.ac.cn
|
|
Address
|
No. 11A, Datun
Road, Chaoyang District, Beijing 100101, China
|
|
Data sharing
policy
|
Data from the Global Change Research Data
Publishing & Repository includes metadata, datasets (in the Digital Journal of Global
Change Data Repository), and publications (in the Journal of Global
Change Data & Discovery).
Data sharing
policy includes: (1) Data are openly available and can
be free downloaded via the Internet; (2) End users are encouraged to use Data
subject to citation; (3) Users, who are by definition also value-added
service providers, are welcome to redistribute Data subject to written
permission from the GCdataPR Editorial Office and the issuance of a Data
redistribution license; and (4) If Data are used to compile new
datasets, the ??ten per cent principal?? should be followed such that Data
records utilized should not surpass 10% of the new dataset contents, while
sources should be clearly noted in suitable places in the new dataset[9]
|
|
Communication and searchable system
|
DOI, CSTR, Crossref, DCI, CSCD, CNKI, SciEngine, WDS/ISC, GEOSS
|
mixed. The original weight of the sample was
greater than 1 kg, and a total of 76 soil
samples were collected (Figure 1). During
field sampling, appropriate adjustments were made according to the actual
environment around 27 preset sampling points. The latitude and longitude of
each sample point were recorded using GPS during the sampling, and further
environmental information around the sample point was recorded. After the soil
was air-dried, roots, rocks, and other debris were removed, and the samples
were passed through a 1-mm nylon sieve and bagged for later use. The
determination of heavy metals requires a 100-mesh nylon sieve, and the soil was
passed through 0.149, 0.25, and 0.5 mm aperture sieves for the determination of
the physicochemical properties of the soil. Three groups of parallel
experiments were conducted, and the average value was taken. Samples were
analyzed according to methods described in a previous study by Bao[10]. The Kjeldahl method was used
to determine the total N (TN) content. Near-infrared spectroscopy was used to
determine the total P (TP) content. Sodium bicarbonate extraction
with molybdenum-antimony resistance colorimetry and flame photometry were
used to determine the available P (AP) and available K (AK), respectively. The potassium dichromate method to determine the soil organic
matter (SOM). Nitrate nitrogen (NO3-N) adopts ultraviolet
spectrophotometry, ammoniacal nitrogen (NH4-N) adopts Nessler??s reagent
colorimetric method and the electric potential method was used to measure the
pH value (the water:soil ratio was 5:1).
3.2 Data Collection and Processing
The
correlation coefficient and membership function were used to determine the weight
and membership degree of the evaluation indexes, while avoiding subjective
influences. First, the correlation coefficient between the single index was
calculated (Table 2). According to the correlation coefficients, the mean value
of the correlation coefficient between a single index and the other indexes was
obtained, and the ratio of the mean value to the sum of all indexes was used as
the weight of this factor (Table 3).
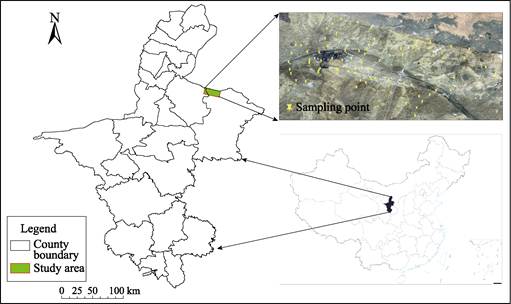
Figure 1 Distribution of soil sampling
points in the study area near the Gaoshawo town, Yanchi county, Ningxia, China
Table
2 Correlation coefficients between soil fertility
indicators
|
Fertility index
|
TN
|
TP
|
AP
|
AK
|
SOM
|
NH4-N
|
NO3-N
|
pH
|
|
TN
|
1
|
|
|
|
|
|
|
|
|
TP
|
0.446
|
1
|
|
|
|
|
|
|
|
AP
|
–0.364
|
–0.231
|
1
|
|
|
|
|
|
|
AK
|
0.373
|
0.207
|
–0.113
|
1
|
|
|
|
|
|
SOM
|
–0.122
|
–0.099
|
0.0003
|
–0.222
|
1
|
|
|
|
|
NH4-N
|
–0.069
|
0.104
|
–0.014
|
–0.147
|
0.044
|
1
|
|
|
|
NO3-N
|
0.368
|
0.123
|
–0.115
|
0.171
|
–0.008
|
–0.07
|
1
|
|
|
pH
|
–0.075
|
–0.17
|
0.212
|
0.214
|
0.08
|
0.017
|
–0.114
|
1
|
Table
3 Fertility index correlation coefficients and their index weights
|
Fertility index
|
Mean correlation
coefficient
|
Weights
|
Fertility index
|
Mean correlation
coefficient
|
Weights
|
|
TN
|
0.259
|
0.212
|
SOM
|
0.082
|
0.067
|
|
TP
|
0.197
|
0.161
|
NH4-N
|
0.066
|
0.054
|
|
AP
|
0.149
|
0.122
|
NO3-N
|
0.138
|
0.113
|
|
AK
|
0.206
|
0.168
|
pH
|
0.126
|
0.103
|
Based on the actual situation in the study
area, the soil TN, TP, AP, AK, SOM, NH4-N, and NO3-N
belong to the membership function of Equation 1:
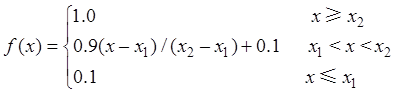 (1)
(1)
In combination with the practices in the study area,
the minimum and maximum values of each indicator were taken as inflection
points x1 and x2 of the function. The inflection points of TN, TP, AP, AK,
SOM, NH4-N, and NO3-N membership are shown in Table 4.
The membership value of the pH is shown in Table 5.
The soil quality indicators (SQI) calculation equation was
as follows:
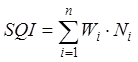 (2)
(2)
where Wi is the
weight value of the i index, Ni is the membership
degree of the  th index, and n is the
number of evaluation indexes.
th index, and n is the
number of evaluation indexes.
Table
4 Value of the inflection point (x) of the evaluation
index in the membership function curve
|
Inflection point
|
TN
|
TP
|
AP
|
AK
|
SOM
|
NH4-N
|
NO3-N
|
|
(g/kg)
|
(g/kg)
|
(mg/kg)
|
(mg/kg)
|
(g/kg)
|
(mg/kg)
|
(mg/kg)
|
|
x1
|
0.07
|
0.11
|
5.4
|
23
|
1.38
|
6.38
|
2.97
|
|
x2
|
0.91
|
0.49
|
17.4
|
155
|
45.51
|
38.11
|
11.27
|
Table
5 Memberships values of the pH values
|
pH
|
Membership
|
pH
|
Membership
|
pH
|
Membership
|
|
<6.50
|
0.5
|
7.51–8.00
|
0.7
|
8.26–8.50
|
0.2
|
|
6.50–7.00
|
1
|
8.01–8.25
|
0.5
|
>8.51
|
0.1
|
|
7.01–7.50
|
0.9
|
|
|
|
|
4 Data Results
and Validation
4.1 Descriptive Statistics
of Soil Quality Index
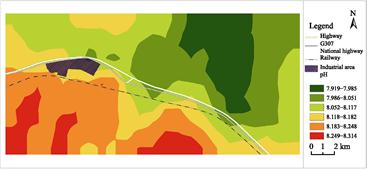
The
average pH was 8.13 ?? 0.25, i.e., the soil was alkaline (Table 6). The average
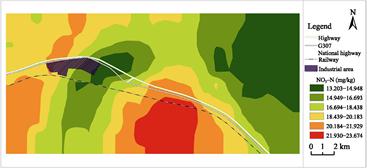
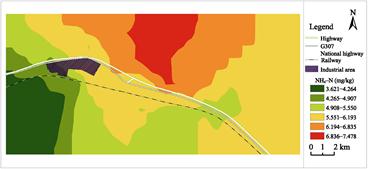
of TN, TP, and SOM were 0.44 ?? 0.19, 0.19 ?? 0.06, and 11.08 ?? 6.57 g/kg, respectively, and the average of AP, AK, NH4-N,
and NO3-N were 8.4 ?? 3.04, 56.85 ?? 25.31, 18.13
?? 6.76,
and 5.62 ?? 1.76 mg/kg, respectively. The
coefficient of variation of the soil pH was 0.03 and showed weak spatial
variation. The coefficient of variation for other quality indicators was
between 0.31 and 0.59, which is a medium variation. The order of the
coefficient of variation were SOM > AK > TN > NH4-N > AP
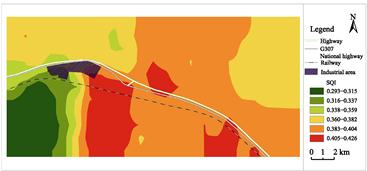
> TP >NO3-N > pH. The soil-quality index in the study area
was at a poor middle-to-low level, and the overall content of TN, TP, and AP
was low.
Table
6 Descriptive statistical characteristics of the soil
quality indicators
|
Fertility index
|
Max
|
Min
|
Mean
|
Standard deviation
|
CV
|
|
TN (g/kg)
|
0.91
|
0.07
|
0.44
|
0.19
|
0.43
|
|
TP (g/kg)
|
0.49
|
0.11
|
0.19
|
0.06
|
0.32
|
|
AP (mg/kg)
|
17.4
|
5.4
|
8.4
|
3.04
|
0.36
|
|
AK (mg/kg)
|
155
|
23
|
56.85
|
25.31
|
0.45
|
|
SOM (g/kg)
|
45.51
|
1.38
|
11.08
|
6.57
|
0.59
|
|
NH4-N (mg/kg)
|
38.11
|
6.38
|
18.13
|
6.76
|
0.37
|
|
NO3-N (mg/kg)
|
11.27
|
2.97
|
5.62
|
1.76
|
0.31
|
|
pH
|
9
|
7.43
|
8.13
|
0.25
|
0.03
|
4.2 Spatial Submap of
Soil Index
According
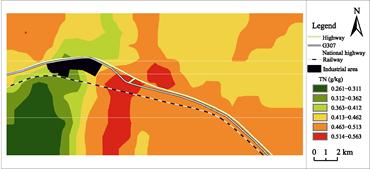
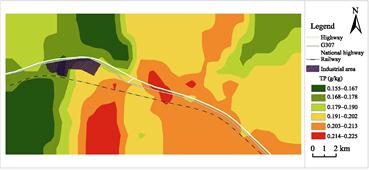
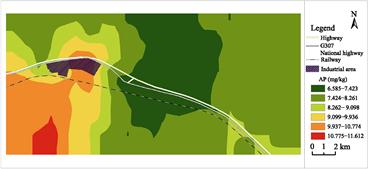
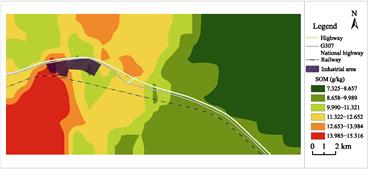
to the spatial distribution map of the measured data for each indicator, the
distribution characteristics of TN (Figure 2), TP (Figure 3), and AK (Figure 5)
in the study area were similar, with high values concentrated on both sides of
the highway. The content of the soil quality indicators was lower in the
southwest of the industrial park. AP (Figure 4) and SOM (Figure 6) were high in
the southwest and low in the northeast. High NO3-N (Figure 8) were found to the south of the highway. Some indicators
showed a trend of high concentration in the south and low concentration in the
north, with the highway as the demarcation point. High-concentration pollutants
were mainly distributed in the area north of the study area, and the area south
of the industrial park is relatively safe[11]. The pollutants, such
as heavy metals, reduced the nutrient content of some samples. However, the
spatial distribution of NH4-N (Figure 9) followed an opposite trend
compared to the other indicators. High concentrations of NH4-N were
detected in the north of the highway, which may be related to the soil pH
content. The pH content of the soil samples obtained from the south of the
highways was higher (Figure 7). As sulfur oxides are emitted by thermal power
plants, the smelting of non-ferrous metals, and the production of the coal, the
surrounding soil is acidified, resulting in differences in the spatial distribution
soil pH. As NH4-N is easily solubilized in soil and volatilized in
alkaline soil, it affects the content of NH4-N in the soil. The
soil-quality index in the study area ranged from 0.383 to 0.404, and the
overall soil quality in the majority of the study area was relatively low
(Figure 10).
|
|
|
|
Figure 2 Spatial
distribution of soil
total N content
|
Figure 3 Spatial
distribution of soil
total P content
|
|
|
|
|
Figure 4 Spatial
distribution of soil
available P content
|
Figure 5 Spatial
distribution of soil
available K content
|
|
|
|
|
Figure 6 Spatial distribution of
soil
organic matter content
|
Figure 7 Spatial distribution of
soil pH
|
|
|
|
|
Figure 8 Spatial
distribution of soil
nitrate nitrogen content
|
Figure 9 Spatial
distribution of soil
ammoniacal nitrogen content
|
|
|
|
Figure 10 Spatial distribution of soil quality
In summary, the
spatial distribution of soil quality indicators in the study
area follow a trend. In this study, the highway was taken as a
demarcation point, with soil pollution increasing to the north of it and
decreasing in the south. Therefore, we see the difference across the spatial
distribution of the soil-quality indicators in the study area.
5 Discussion and Conclusion
The
measured dataset of surface-soil quality in the desert steppe under industrial
activities included N,
TP, AP, AK, SOM, NH4-N, and NO3-N concentrations, as well
as the pH of the surface soil from the study area. The
research is calculated by the correlation coefficient method and the membership
function method, and the spatial interpolation graph was combined to understand
the soil quality distribution status more comprehensively in the study area.
This study area was located in the northern desert steppe area, with year-round
aridity, low rainfall, serious soil desertification,
lack of water and nutrients, low soil water holding capacity, and low soil N,
P, SOM, and other nutrients. The industrial activities in the region have
further reduced the soil quality of the desert steppe. The soil quality indicators
in this dataset are helpful to understand the soil quality of desert steppe
under industrial activities. This study provides a reference for the
conservation of the fragile desert steppe ecosystem in China.
Author Contributions
Mi, W. B. and Mi, N. designed the algorithms of
dataset. Xu, Z. and Tian, Y. contributed to the data processing, analysis and
wrote the data paper.
Conflicts of Interest
The authors declare no conflicts of interest.
References
[1]
Doran, J.
W., Parkin, T. B. Defining and assessing soil quality [C]//Defining soil
quality for a sustainable environment. Special Publication, Soil
Science Society of America, Madison, WI. 1994, 35: 3–21.
https://doi.org/10.2136/sssaspecpub35.c1.
[2]
Karlen, D. L., Andrews, S. S., Doran, J. W. Soil quality:
current concepts and applications [J]. Advances in Agronomy, 2001, 74: 1–40.
[3]
Nehrani, S. H., Askari, M. S., Saadat, S., et al. Quantification of soil quality
under semi-arid agriculture in the northwest of Iran [J]. Ecological
Indicators, 2020, 108: 105770. https://doi.
org/10.1016/j.ecolind.2019.105770.
[4]
Nakajima, T., Lal, R., Jiang, S. Soil quality index of a crosby silt loam in central Ohio [J]. Soil Tillage
Research, 2015, 146: 323–328.
[5]
Ma, Q. H., Zhang, G. H., Geng, R., et al. Evaluation on soil quality of different land use types in
Zhifanggou Watershed of the Loess Plateau [J]. Research of Soil and Water
Conservation, 2018, 25: 30–35, 42.
[6]
Yang, Q. Q., Li, Z. Y., Lu, X. N., et al. A review of soil heavy metal pollution from industrial and
agricultural regions in China: Pollution and risk assessment [J]. Science of the Total
Environment, 2018, 642(15): 690–700.
[7]
Huang, Y., Kuang, X., Cao, Y., et al. The soil chemical properties of reclaimed land in an arid
grassland dump in an opencast mining area in China [J]. RSC Advances,
2018, 8(72): 41499–41508.
[8]
Xu, Z., Mi, W. B., Mi, N. Soil dataset of desert steppe surface infected by
industrial activities in Yanchi [J/DB/OL]. Digital
Journal of Global Change Data Repository, 2021.
https://doi.org/10.3974/geodb.2021.06.09.V1.
https://cstr.escience.org.cn/CSTR:20146.11.2021.06.09.V1.
[9]
GCdataPR Editorial Office. GCdataPR data sharing policy
[OL]. https://doi.org/10.3974/dp.policy.2014.05 (Updated 2017).
[10]
Bao, S. D. Soil Agrochemical Analysis [M]. Beijing: China
Agricultural Press, 2007: 268–270, 389–391.
[11]
Xu,
Z., Mi, W., Mi, N., et al.
Characteristics and sources of heavy metal pollution in desert steppe soil
related to transportation and industrial activities [J]. Environmental
Science and Pollution Research, 2020: 1–14.